

Abstract
Big Data and machine learning (ML) technologies have the potential to impact many facets of environment and water management (EWM). Big Data are information assets characterized by high volume, velocity, variety, and veracity. Fast advances in high-resolution remote sensing techniques, smart information and communication technologies, and social media have contributed to the proliferation of Big Data in many EWM fields, such as weather forecasting, disaster management, smart water and energy management systems, and remote sensing. Big Data brings about new opportunities for data-driven discovery in EWM, but it also requires new forms of information processing, storage, retrieval, as well as analytics. ML, a subdomain of artificial intelligence (AI), refers broadly to computer algorithms that can automatically learn from data. ML may help unlock the power of Big Data if properly integrated with data analytics. Recent breakthroughs in AI and computing infrastructure have led to the fast development of powerful deep learning (DL) algorithms that can extract hierarchical features from data, with better predictive performance and less human intervention. Collectively Big Data and ML techniques have shown great potential for data-driven decision making, scientific discovery, and process optimization. These technological advances may greatly benefit EWM, especially because (1) many EWM applications (e.g. early flood warning) require the capability to extract useful information from a large amount of data in autonomous manner and in real time, (2) EWM researches have become highly multidisciplinary, and handling the ever increasing data volume/types using the traditional workflow is simply not an option, and last but not least, (3) the current theoretical knowledge about many EWM processes is still incomplete, but which may now be complemented through data-driven discovery. A large number of applications on Big Data and ML have already appeared in the EWM literature in recent years. The purposes of this survey are to (1) examine the potential and benefits of data-driven research in EWM, (2) give a synopsis of key concepts and approaches in Big Data and ML, (3) provide a systematic review of current applications, and finally (4) discuss major issues and challenges, and recommend future research directions. EWM includes a broad range of research topics. Instead of attempting to survey each individual area, this review focuses on areas of nexus in EWM, with an emphasis on elucidating the potential benefits of increased data availability and predictive analytics to improving the EWM research.
Export citation and abstract BibTeX RIS

Original content from this work may be used under the terms of the Creative Commons Attribution 3.0 licence. Any further distribution of this work must maintain attribution to the author(s) and the title of the work, journal citation and DOI.
1. Introduction
Big Data and artificial intelligence (AI) are transforming many aspects of our social, political, and economical lives. Various scientific fields are no exceptions. In a 2007 presentation, data scientist Jim Gray argued that the emerging 'data intensive science' should be taken as a new and the fourth paradigm of scientific research, after a long evolution from empirical observation, theoretical analyses, and computational simulation paradigms [1]. In the context of environment and water management (EWM), Peters-Lidard et al [2] recently advocated that hydrologists need to embrace data science as a new paradigm by leveraging 'emerging datasets to synthesize and scrutinize theories and models, and to improve the data support for the mechanisms of Earth system change.' Data and data analysis have always been one of the main pillars of scientific research, serving as the basis of theoretical and numerical model developments. Currently many questions, confusions, and even doubts exist about the emerging data science, the differences between the new breed of data analytics and the classical data analyses, and the potential impact of digital transformation on EWM. For a paradigm shift to actually occur in the EWM and for hydrologists and geoscientist to have a competitive edge in an increasingly digitized and connected world, the community not only needs to have a thorough understanding of the relevant technologies behind the modern data science, but also needs to form a strong and unanimous vision about what can be done with these new technologies in the context of environmental and hydrological applications. The main purpose of this survey is thus to conduct an evidence-based review on the subject matter, including existing use cases and the current technological and institutional obstacles to the adoption of Big Data and machine learning (ML) technologies in the EWM.
Humans came to realize very early in our evolution that the world is not just made up of 'dry' facts (i.e. data), but these dry facts are glued together by an intricate web of cause–effect relationships [3]. It is the seeking of explanations to those causal relationships that has shaped the bulk of our scientific knowledge existing today. Historically, a lot of knowledge in the EWM was acquired through either empirical or hypothesis-driven research, in which synthesis was done at a pace managed by individual researchers or research groups. In the past decade, the speed of data generation has greatly surpassed the speed of traditional data compilation and analyses, due to the advent of high-resolution remote sensing and smart Information and Communication Technologies (ICT) enabled by Internet-of-Things (IoT), cloud computing, and machine to machine (M2M) infrastructure. It is estimated that the world produces about 2.5 quintillion bytes of data every day and by 2020 over 40 Zettabytes (1 Zettabypes is 1 trillion Gigabytes) of data will have been generated [4]. In the field of Earth observations, the total volume of data stored in NASA's Earth Observing System Data and Information System archive at the beginning of 2017 was about 22 Petabytes, but that number will soon be exceeded, with the upcoming NISAR satellite mission alone expected to add as much as 85 Terabytes of data each day to the archive [5]. The emerging forms and volume of data significantly refine the time-space granularity of data availability and introduce a multitude of modalities in environmental sensing (citizen sensing and UAV). However, a strong asymmetry now exists and is likely to continue to exist between the pipelines of data generation and knowledge extraction, creating the so-called 'dark data' or 'data iceberg' situations where all acquired data cannot be ingested in time to derive new knowledge, thus losing a significant portion of their scientific or business values [6].
Various ML-driven technologies are sought to automate data discovery, reducing the gap in information ingestion across both spatial and temporal scales. Modern high-performance computing machines can now process large amounts of information at a high speed—200 petaflops to be exact for the world's most powerful supercomputer existing today [7]. However, human knowledge acquisition and synthesis are typically made over longer time scales and at lower frequency. Thus, machines are needed to perform the job of information throttling/funneling by regularizing, filtering, and aggregating raw data, sending only the most high-level information to human users. The last decade has seen a great leap forward in ML technologies, with machines now demonstrating superior skills in automated data analytics, processing millions of real-time events per second [8, 9]. The recent and near-term evolution of AI is perceived to consist of three waves [10]. The first wave of AI (1970s–1990s) mainly dealt with knowledge representation in well-defined domains, enabled reasoning over narrowly defined problems (e.g. rule engines), but generally offered poor handling of uncertainty. The second wave of AI (2000s–present) is distinguished by advances in statistical representation and learning as evidenced by the appearance of a large number of unsupervised and supervised ML algorithms; the handling of uncertainty has significantly improved, but the reasoning and generalization abilities are still limited. The third and future wave of AI (2020s and beyond) will include technologies with contextual adaptation and reasoning abilities, which can learn with minimal supervision. The surge of interest in data science in recent years has been driven by this parallel advances in computing hardware and in ML algorithms that possess strong pattern recognition and even some AI-like contextual reasoning capabilities. It is important to point out, however, that different waves of AI do not supersede each other, instead they serve for different purposes and deal with subsets of AI problems that often coexist. In ML, a common example is scalar time series analytics versus image time series analytics—the former may be adequately analyzed by traditional ML algorithms, while the latter often require more sophisticated computer vision algorithms.
Concerns over Big Data are whether various datasets can be transmitted (to those who mostly need them), ingested, and stored in a timely, secure, and cost-effective manner for harnessing information embedded in the data, and whether new forms of insights derived from autonomous Big Data analytics can help improve the transparency and equity of policy making and further social justice in an unbiased way. On the AI side, some lingering doubts and concerns are (a) whether the field of AI is stuck with solving the narrow-AI problems (i.e. association type) and whether they can ever reach human-level cognition and causal reasoning capabilities (according to [3], most of the present-day learning machines perform the so-called association type learning by looking for regularities in observations); (b) whether the mainstream scientific community, deeply rooted with process-based causal reasoning and inquiries, will be more receptive to outcomes of ML methods that are often perceived as black boxes; and (c) whether the young generation of researchers should be too carried away at knowing how to use AI tools, at the expense of understanding the discoveries and knowing the causes [11].
To address these questions and concerns in EWM, one not only needs to be aware of successful applications involving the Big Data and ML technologies, but also needs to have an unbiased and open-minded view toward their strengths and limitations and their roles in advancing the current research. It is not exaggerating to say that we are at the crossroads of Big Data and ML. As more private entities and government funding agencies start to invest in these technologies, doubts and questions are also mounting from failed cases in which the new technologies could not meet the hyped expectations [12]. Such a cyclical pace is normal and healthy in the evolution history of any major technology, including AI itself. Perhaps a more meaningful question to ask at this time is what the EWM community has learned and benefited from the Big Data and ML technological breakthroughs in the last decade [13], in terms of the types of domain-specific applications that have been solved, what remains to be solved, the current challenges, and the near-term opportunities.
Although a number of recent surveys and position papers have been published on the prospects and applications of Big Data and ML for environmental and earth sciences, they tend to either focus on (a) specific topical areas within EWM such as remote sensing [14–18], hydrology [13], groundwater [19], ecology [20], smart city [21, 22], renewable energy [23], hydroinformatics [24], and disaster response and resource management [25–27]; or (b) computing technologies [28–30]. Given the rapidly evolving technological landscape, an evidence-based review is deemed necessary to provide an update-to-date synthesis of the technologies and their challenges.
The main hypotheses of this review are (a) Big Data represents disruptive technology that will affect many aspects of EWM, from sensing to governance; (b) data-driven research may provide novel insights and help discover salient features that are otherwise difficult to capture using conventional workflows, and (c) the current Big Data and ML approaches are most useful when combined with physics-based research to generate results that are human interpretable. In the literature, the terms AI, ML, and deep learning (DL) are sometimes used interchangeably. For the purpose of this survey, AI is a general term referring to the use of computers/machines to imitate human-like behaviors, ML is a branch of AI that aims to train machines to learn and act like humans and to improve their learning in autonomous fashion through data fusion and real-world interactions, while DL refers to a newer generation of ML algorithms for extracting and learning hierarchical representations of input data [31]. In the following, we first summarize our search criteria. To allow us to focus on more recent developments, we selected papers related to Big Data and DL, as opposed to the traditional shallow learning ML that has already been extensively surveyed for EWM applications (e.g. [32–34]). We define the characteristics and sources of EWM Big Data, and the DL technologies used to enable Big Data analytics. The types of existing Big Data and ML applications are synthesized according to respective EWM fields. In particular, we review problems that can be solved by the the current technologies, that can be solved but with some help, and that can eventually be solved. Prominent issues related to EWM fields, such as inadequate training samples, nonstationary learning environments, and the development of human-interpretable hybrid ML and physics-based solutions will be reviewed. Finally we provide an outlook of the near-term opportunities of Big Data and ML in EWM. The hypotheses and organization of this review are further illustrated in figure 1.

Figure 1. The three hypotheses and structure of this review.
Download figure:
Standard image High-resolution image2. Literature search method
2.1. Search criteria
For this review, we searched the online citation database Scopus for existing literature related to the subject matter. We used a combination of related keywords (Big Data, deep learning, Big Data analytics) and EWM domain filters (hydrology, remote sensing, water resources, ecosystem, and environmental management). To narrow down the search results, we limited our search to those published in peer-reviewed journals in English during the period 2004–2018. In addition, we used the keyword 'deep learning' instead of the broader 'machine learning' to allow us to focus more on the recent developments. We also unchecked a number of unrelated subject areas (e.g. pharmacy, medicine) on the search dashboard of Scopus. The final search criteria used become
(ALL ('big data' OR 'big data analytics' OR 'predictive analytics' OR 'deep learning') AND TITLE-ABS-KEY ('remote sensing' OR 'hydrology' OR 'water resources' OR 'ecosystem' OR 'environmental management')) AND DOCTYPE (ar OR re) AND PUBYEAR > 2004 AND PUBYEAR < 2019 AND (EXCLUDE (SRCTYPE , 'k') OR EXCLUDE (SRCTYPE , 'd') OR EXCLUDE (SRCTYPE , 'p')) AND (EXCLUDE (SUBJAREA , 'MEDI') OR EXCLUDE (SUBJAREA , 'IMMU') OR EXCLUDE (SUBJAREA , 'HEAL') OR EXCLUDE (SUBJAREA , 'PSYC') OR EXCLUDE (SUBJAREA , 'PHAR') OR EXCLUDE (SUBJAREA , 'NURS') OR EXCLUDE (SUBJAREA , 'VETE')) AND (LIMIT-TO (LANGUAGE , 'English'))
The search listed in the above initially returned a total of 2227 documents. We refined the search results in several iterations. We first went through the title and abstract of each item to determine its relevance to our review subject (in case it was not clear from the title and abstract, we also read the full text to determine whether an article should be included). For example, papers related to 'cloud environmental management' and 'information ecosystems' were filtered out. The refining process reduced the number of papers to 1451, of which 7.9% (or 114) of the documents are review papers and the rest are articles.
Figure 2 shows a summary of search results according to their publication year and subject area. Figure 2(a) suggests that the number of publications related to our view topic has experienced a dramatic increase since 2013. The top originating categories are Earth and Planetary Sciences, Engineering, Environmental Science, and Computer Science (figure 2(b)).

Figure 2. Summary of Big Data and ML articles retrieved for this review: (a) number of documents by publication year, and (b) documents by subject area.
Download figure:
Standard image High-resolution image2.2. Top keywords and topics
The top 20 author-listed keywords of all articles are shown in figure 3(a), which suggest that remote sensing is the most commonly listed keyword (836 times), followed by neural networks, image classification, deep learning, classification, and Big Data.

Figure 3. (a) Top 20 author-listed keywords, and (b) top 20 most salient bigram terms extracted from all articles.
Download figure:
Standard image High-resolution imageTo explore of the content of the large number of articles, we used topic modeling, which is a class of unsupervised ML methods for automatically discovering 'topics' that occur in a large collection of documents. Topic modeling is often used as an exploratory analysis tool for guiding more focused, intensive synthesis efforts without having to sift through massive volumes of literature [35]. More specifically, we applied the latent Dirichlet allocation (LDA) method, which is a generative probabilistic topic model that identifies topics based on the frequency of words from a collection of documents [36]. LDA is commonly used for unsupervised document classification—when fitting to a set of documents, the topics are interpreted as themes in the collection, and the document representations indicate which theme each document is about [37, 38]. We used the Python package gensim [39] to perform the LDA-based topic modeling.
Here we restricted ourselves to bigram terms (i.e. a pair of consecutive words) extracted from all documents. Figure 3(b) shows the top 20 salient bigrams extracted from our collection of papers. The term salience is defined as the product of the frequency of a term (i.e. how often a bigram appears in documents) and the distinctiveness of the term (i.e. how informative a specific term is for determining the generating topic versus a randomly selected term) [40]. The use of the salience measure enables rapid classification and disambiguation of topics. Insights that may be gleaned from the topic modeling include (a) most of the papers are related to the application of Big Data and DL in remote sensing; (b) some topics are related to the application of DL on high-resolution satellite images and Earth observations, in topical areas such as land cover/land use change detection, real-time disaster responses (e.g. oil spill), climate change, and water resources; (c) topics related to algorithm training techniques (e.g. training sample, feature extraction, spatial resolution, and classification accuracy) are often discussed in the papers; (d) the convolutional neural network (CNN), a building block of many DL models, is mentioned by many of the studies; (e) decision support and water resources represent significant areas of research in EWM data analytics; (f) social media (citizen science) is emerging as an important data source. The top author-listed keywords and the salient terms learned from topic modeling generally agree with each other, both suggesting that so far Big Data and DL publications in EWM have been dominated by theoretical developments and applications related to remote sensing. While the dominance of remote sensing may be a consequence of the use of DL in our search criteria, it is consistent with the fact that many high-dimensional EWM datasets originate from remote sensing. This topic modeling exercise provides a high-level guidance for organizing the remainder of this review.
3. Result synthesis on Big Data
3.1. Big Data characteristics
The definition of Big Data evolves over time. According to the US National Institute of Standards and Technology (NIST), Big Data consists of extensive datasets that have characteristics of high volume, variety, velocity, and variability (4V), and that require a scalable architecture for efficient storage, manipulation, and analysis [41]. In addition to the 4V characteristics, recent definitions also add veracity and value to the descriptors of the Big Data [4]. Some authors explicitly emphasize the scale and complexity of Big Data by adding high dimension, high complexity, and high uncertainty (3H) descriptors to the definition [42], while others suggest that the intricacy of a dataset should be a significant factor in determining whether the dataset is big [4].
Volume. The volume attribute refers to the size of Big Data. The data volume is considered large if it is at a scale beyond the capability of the traditional in-house IT infrastructure to process within a reasonable amount of time. As a result, migration to a distributed computing platform is necessary for scalable data handling. The volume of a dataset is relative and may have different implications in different applications. Thus, NIST was careful in adding that data is usually considered 'big' if the use of scalable architectures provides a 'cost' or 'performance efficiency' over the traditional architectures for processing the data [41]. The rise of Big Data coincides with the rapid evolution of ICT and IoT in the past decade. Commercially available cloud computing services (e.g. infrastructure as service) allow distributed processing of large datasets on clusters. Switching data platforms, however, may incur disruptions to established data life cycles and, thus, represents a decision that can have both explicit costs (e.g. acquisition of new cloud service and/or software and new skill sets) and hidden costs (data integrity and security) associated with it. Depending on the application, the volume may also have a hidden temporal dimension that makes data size keep increasing. This is especially true for EWM, which involves archiving and querying Earth observations or simulations accumulated over decades. Thus, even though the size of each individual data instance is not big, collectively all data holdings represent a Big Data problem.
Variety. The variety attribute refers to heterogeneity in both the source and format of Big Data. Because of the observation-based nature of EWM, variety has been a well-known issue to hydrologists that predated the Big Data era, with the disparity in spatial and temporal resolution being one of the main concerns [43]. On the basis of sources, EWM Big Data may be classified as either passive or active, with the former coming from derivative products of digital media (e.g. terms used in online search or mobile phone GPS data) and the latter coming from planned data collection activities (online surveys, field campaigns, or targeted remote sensing). The main difference is that passive data is collected without active user involvement and, as a result, it typically reveals certain things happen but does not explain why. On the basis of format, EWM data may be either structured (sensor readings and satellite data) or unstructured (email, video, audio, and text from social media), with the main difference between the two being that unstructured data cannot be easily described using a predefined data model. In addition to data format disparity caused by vendors and distributors, variety also arises due to organizational behaviors. In data science, data silo is a term used to describe isolated 'data islands' that exist in one department of an organization, but are isolated from the rest of the organization. Variety inevitably creates an extra layer of complexity when dealing with Big Data, representing one of the main frictions in data processing pipelines. A recent survey of data scientists suggests that over 80% of their time at work is spent on data cleansing [44]. As data is increasingly generated in silos and as the boundary between natural and social sciences is increasingly blurred, data variety may become both an enabler and hinderer. In mitigating data variety, two commonly used techniques are data virtualization and data federation. The goal of data virtualization is to hide the technical complexity of data from end users to deliver data with simplified and integrated view, whereas the purpose of data federation is to aggregate heterogeneous data from disparate sources so that it can be viewed in a consistent manner from a single point of access. Thus, data federation represents a form of data virtualization. Note that data virtualization does not normally persist or replicate data from sources to itself; instead, it can be considered a broker that connects and combines disparate data sources and makes data accessible from a single place.
Velocity. The velocity attribute may refer to not only the speed of data generation, but also the speed of data analytics that is required for data ingestion. The velocity of data generation is a direct consequence of the ever-increasing connectivity, the pervasive use of smart devices, and real-time monitoring networks. High speed data sets that are continuously generated by different sources require specialized processing. A data stream is defined to be an unbounded sequence of events that need real-time or near real-time processing [45]. Real-time data streams are becoming more common in EWM applications because of the increasing use of distributed sensors and remote sensing techniques. Streaming analytics enables users to query continuous data stream and identify abnormal conditions quickly after receiving the data [46, 47]. Streaming analytics is arguably one of the most interesting developments in data analytics in recent years, not only because of its potential for turning raw data streams into value-added information, but also because it poses new challenges to data storage and processing algorithms, requiring high throughput data stream servers with low latency (e.g. in-memory processing) and efficient online ML algorithms that can filter and process events on the fly. Significant challenges exist to process large-scale Earth observation data in real time because of bottlenecks in data transmission related to network bandwidth and lacking of scalable data analytics platforms [14]. Edge computing has been (re-)introduced as an alternative paradigm for easing some of the challenges associated with the high velocity of Big Data. Under edge computing, data processing and reduction are done close to where data is generated, before transmitting the filtered data to a cloud-based environment for central processing [48].
Variability. The variability attribute refers to variations in all other attributes of the Big Data, for example, variations in data flow rates (velocity) or changes in data meaning, with the latter often being the case in crowd sourced data. In EWM, variability may be caused by endogeneous factors (e.g. sensor drift, change of sensors, and inherent variations of the physical process being monitored) and exogeneous factors (e.g. disparity in sensor metadata, social media data, and changes introduced by human activities). Variability is a major concern to EWM because many ML algorithms work under the premise of stationarity.
Veracity. The veracity attributes refers to potential inconsistency and data quality problems, such as missing data, anomalies, and data entry errors. Although data quality control is the first and foremost part of scientific research, the high-volume and high-velocity attributes of Big Data may render the traditional manual procedure for data quality check infeasible. Rule-based procedures may be instituted to automatically check data integrity. A significant number of processing and fusion steps are behind high-level data products released by data centers. With the data centers constantly updating algorithms, however, managing data versions becomes a significant challenge when ingesting multisource data. The democratization of large datasets presents huge opportunities for all types of businesses and public institutions, but it also carries the potential of undesirable and malicious use, including privacy violation and misinformation, which is especially true for passive data [49]. Thus, the design of data collection and mining platforms need to be guided by explicit and transparent principles and policies for protecting data integrity and gaining user trust.
The nature of EWM Big Data warrants the development of specialized data governance systems for managing the availability, usability, integrity and security of EWM datasets. Although such needs have long been recognized by government agencies (e.g. the US National Oceanic and Atmospheric Administration and European Copernicus Programme) in terms of data archiving, access, and stewardship, the traditional centralized data governance model is unlikely to serve different levels of user data needs, nor does it typically have strong support for stakeholder participation and engagement. In recent years, the notion of self-service or agile data governance model is gaining momentum, which is oriented toward providing service and decision support to individual users that are the most close to actions [50]. Ultimately managing Big Data will require a sustainable ecosystem enabling different stakeholders (e.g. citizens and advocacy groups, research organizations, policy analysts, scientists, software developers, journalists and politicians) to participate and find their data ecosystem niches [49].
3.2. Sources of EWM Big Data
EWM Big Data may originate from (a) high-frequency data products derived from Earth observation systems, (b) multi-sensor data collected from ground-based monitoring networks and IoT, (c) large-scale datasets collected from field experiments via multiple instruments, (d) data simulated by large-scale Earth system models, and (e) crowdsourced data from social media and citizen science [29]. Table 1 gives some examples under each of the categories. Earth observation datasets falling under the remote sensing category are generally available in gridded format, the sizes of which depend on the level of postprocessing, the spatial and temporal resolution, the number of attribute fields included in each dataset, as well as on the frequency of data generation. For example, the Soil Moisture Active Passive satellite mission, Level 4 (SMAP L4) surface and root zone soil moisture global product (temporal resolution 3 h, spatial resolution 9 km) include geophysical, analysis, and land-model constants subgroups, with each group in turn including multiple fields [51]. Each SMAP L4 dataset is about 219 Mb in size and the total data size for a year is about 0.63 Tb. The Moderate Resolution Imaging Spectroradiometer (MODIS) sensors onboard the Terra and Aqua satellites have been in orbit since 2000 and have enabled dozens of products related to atmosphere, land, ocean, and cryosphere sensing. Most global climate and Earth system simulation models also generate data in gridded format. Common file formats used in disseminating gridded data include ASCII, GRIB (gridded binary), netCDF (network common data form), and HDF (hierarchical data format).
Table 1. Examples of EWM data.
| Category | Field | Subfield | Data Source | Data Size (format, spatial res) | Temporal Coverage (freq) |
|---|---|---|---|---|---|
| Remote Sensing | Hydrology | Terrestrial water storage | GRACE (RL05) | 39 Mb (Ta)(netcdf, 220 km) | 2002–2017 (monthly) |
| Soil moisture | SMAP (L4) | 219 Mb (hdf5, 9 km) | 03/31/2015–present (3 h) | ||
| Precipitation | GPM (L3) | 5 Mb (hdf5, 0.1 deg) | 03/12/2014–present (0.5 h) | ||
| Land mapping | Landsat8 (L1) | 1 Gb (geotiff, 30 m) | 2013–present (16 d) | ||
| Snow and ice | ICESat (L1) | 4 Mb (hdf5, 70 m) | 02/20/2003–10/11/2009 (23 min) | ||
| ET | MODIS (L4) | 5 Mb (hdf5, 500 m) | 01/01/2001–present (8 d) | ||
| Vegetation index | MODIS (L3) | 28Mb (hdf5, 500 m) | 02/2000–present (16 d) | ||
| Hazards | oil spill, flooding | Sentinel-1(L1) | 1 Gb (SAFE, 5 m) | 2014–present (12 d) | |
| Ground based | Hydrology | Streamflow | Stream gauge | varies | varies (15 min) |
| Field campaign | Geophysics | Earthquake | distributed acoustic sensing | 1 Gb (segy, 8700 channels at 1 kHz) | 30 s recording period |
| Areal survey | Topography | LiDAR | 5.9 Gb (per sq km) | ||
| Simulation | Hydrology | Atmospheric and land surface | GLDAS-NOAH(L4) | 2 Mb (netcdf, 1 deg) | 01/01/2000–present (3 h) |
| ERA-Interim | 38 Tb (T)(GRIB, 0.7 deg) | 01/01/1979–present (6 h) | |||
| NCEP climate forecast system reanalysis | 67 Tb (T) (GRIB, 0.1 deg) | 01/01/1979–present (6 h) | |||
| Crowd sourced | Hydrology | Flood | Social media | Picture, video and texts | – |
Data derived from satellite missions and simulation models are good examples of structured data. On the other hand, most crowdsourced data comes in unstructured forms. Social sensing is defined as sensing of real-world events using unsolicited content from digital communications (e.g. phone calls, social media, and web searches) [52]. Ground-based datasets from environmental monitoring networks tend to be dominated by time series, which become sizable when the length of time series is long and/or the number of observation points is large. Data from field campaigns may become sizable when data acquisition is done at high intensity and/or high spatial resolution. In general, data volume increases with the level of processing. At the preprocessing stage, the data volume increases by 45% compared to the original raw data, while the value-added processing stage adds another 20% compared to the preprocessing stage [53].
3.3. Data wrangling with Big Data ecosystems
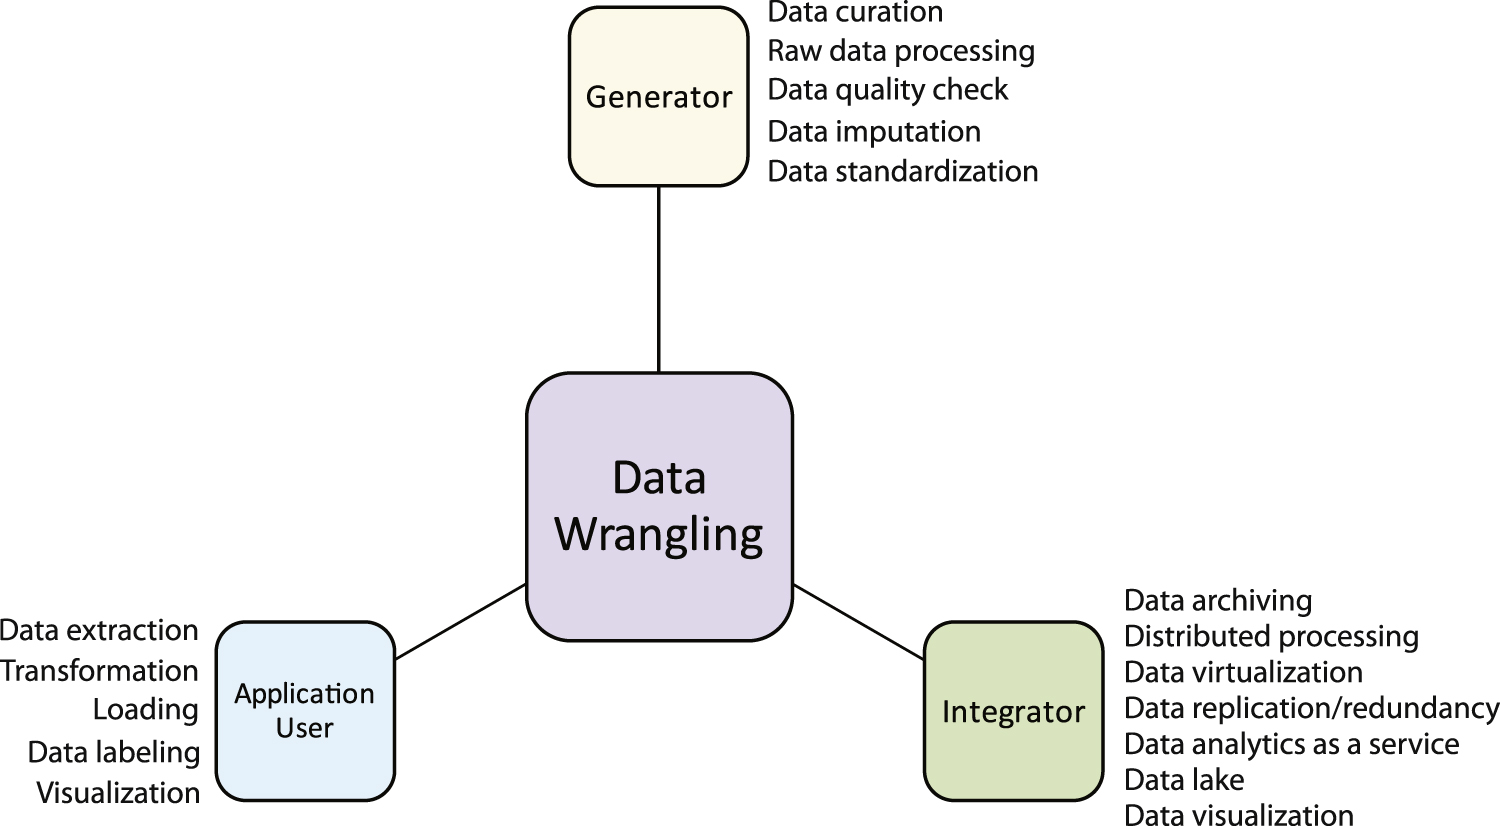
Before datasets can be ingested, they must be processed and integrated into a unified view for feeding the downstream analyses. In data science, data wrangling broadly refers to steps that data scientists take to reduce or eliminate data frictions resulting from data variety, variability, and veracity. Data wrangling is concerned with data gathering, cleansing, transformation, virtualization, and visualization. Although not mentioned explicitly in most of the EWM literature (only in two of the papers collected for this survey), virtually all data-related EMW research involves some form of data wrangling [54, 55]. A somewhat less appreciated aspect is that data wrangling also represents a significant investment in time and effort, especially when performed on Big Data platforms. In general, EWM users who interact with Big Data can be divided into three groups, data generator, data integrator, and data user. Depending on the group, the objectives and tasks of data wrangling also vary, as shown in figure 4. Data generators are mainly concerned with raw data acquisition, quality control, and processing. Data integrators are responsible for data gathering (from multiple sources), virtualization, storage, provisioning, and development of data analytics as services. Ideally, application users would only need to focus on problem solving by leveraging features offered by a user-friendly data analytics platform. In reality, however, the boundaries between different groups are often blurred.

Figure 4. Common data wrangling tasks conducted by data generator, integrator, and application user groups.
Download figure:
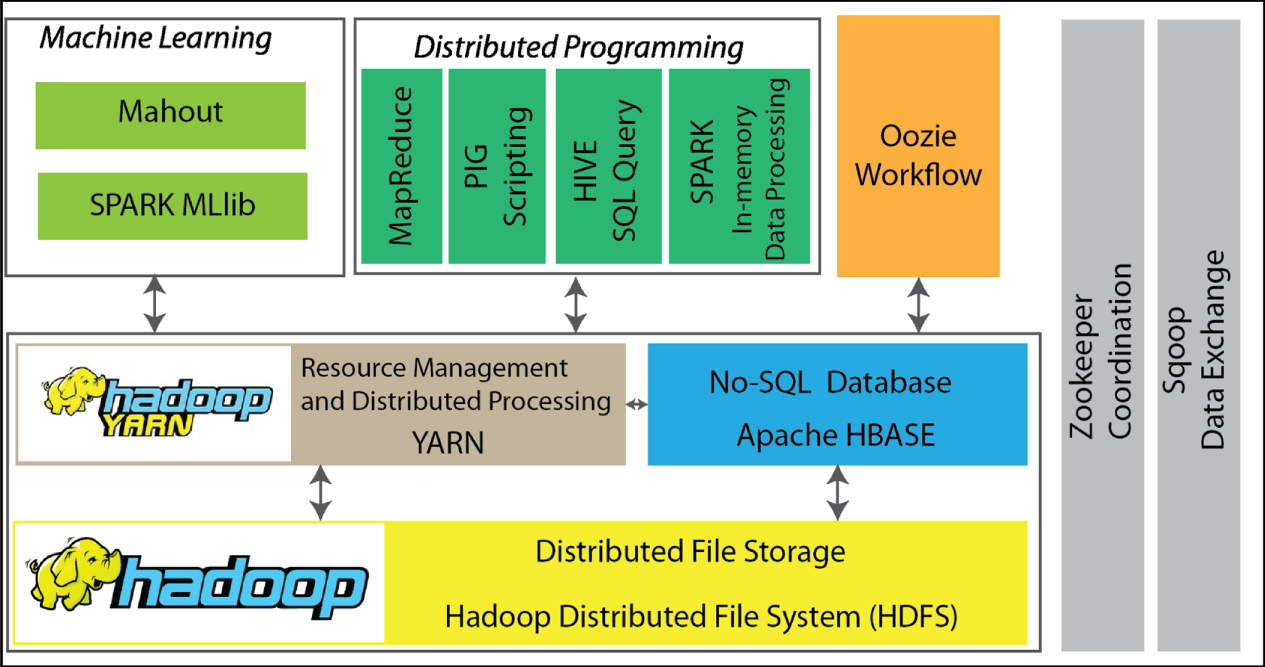
Standard image High-resolution imageA large number of open-source and commercial Big Data analytical products are currently available and the number keeps increasing, making navigation through the maze of products a formidable task. On the brighter side, the current trend in Big Data product development favors interoperability and compatibility of products which, in turn, nurtures the formation of Big Data ecosystems that are consisted of complementary products and subsystems. For example, figure 5 shows some of the commonly seen products under the open-source Apache Hadoop ecosystem. The base of the ecosystem is Hadoop, which includes the Hadoop distributed file system (HDFS), Yet Another Resource Negotiator (YARN), and MapReduce. HDFS is a distributed file storage system that provides scalable and reliable data storage through clusters. MapReduce is a distributed programming framework that performs parallel processing of data by partitioning a large dataset into smaller ones to be processed on different cluster nodes (mapper) and then automatically gathers the results across the multiple nodes to return a single result (reducer). Apache SPARK is a faster alternative to MapReduce. Unlike MapReduce which persists interim datasets to local disks, SPARK performs in-memory processing of data and can be up to 100 times faster than MapReduce [56]. Apache YARN is responsible for Hadoop resource management, helping to allocate computing resources to various applications running on a Hadoop cluster and to dispatch tasks to be executed on different cluster nodes. Apache HBASE is a type of columnar, non-relational distributed database (also called No-SQL database) that runs on top of HDFS. Unlike the traditional relational databases, No-SQL databases are designed to handle large volumes of rapidly changing structured, semi-structured, and unstructured data, and can be scaled up horizontally by adding more nodes. The base components provide distributed infrastructure support for higher-level applications. For example, Mahout is a mature library of distributed ML algorithms that can operate on large datasets. SPARK MLlib is a newer generation of ML library that is part of SPARK [57]. PIG and HIVE provide scripting support for working with large datasets, with the latter using a SQL-like interface. A distributed system must handle multiple jobs/tasks in parallel. Oozie helps to schedule Hadoop jobs, combining multistage jobs from PIG or HIVE into a single job, while Zookeeper maintains shared objects used in a cluster environment and coordinates synchronization among the cluster nodes. Finally, Sqoop provides an interface for transferring bulk data between a Hadoop ecosystem and structured data stores.

Figure 5. Common components in the open-source Apache Big Data ecosystem.
Download figure:
Standard image High-resolution imageBig Data ecosystems like the one portrayed in figure 5 reduce the barrier to entry to Big Data analytics, and help various EWM users and organizations to develop high-level, self-service data analytics.
3.4. EWM Big Data applications
3.4.1. Problems Big Data have tackled
Problems tackled by the collection of papers retrieved for this review span a wide range of EWM topics. In figure 6, these topical areas (right side) are mapped to their data sources (left side) by also linking (in a qualitative sense) to the levels of data volume, variety, and velocity, which are three of the most common Big Data characteristics (3V). Table 2 further lists the number of papers fallen under each category, with a list of examples. In general, the topics are identified according to the salient topics listed under section 2.2 (figure 3) and based on the papers surveyed for this study.

Figure 6. Qualitative mapping between EWM Big Data sources and application areas in terms of volume, variety, and velocity of the data.
Download figure:
Standard image High-resolution image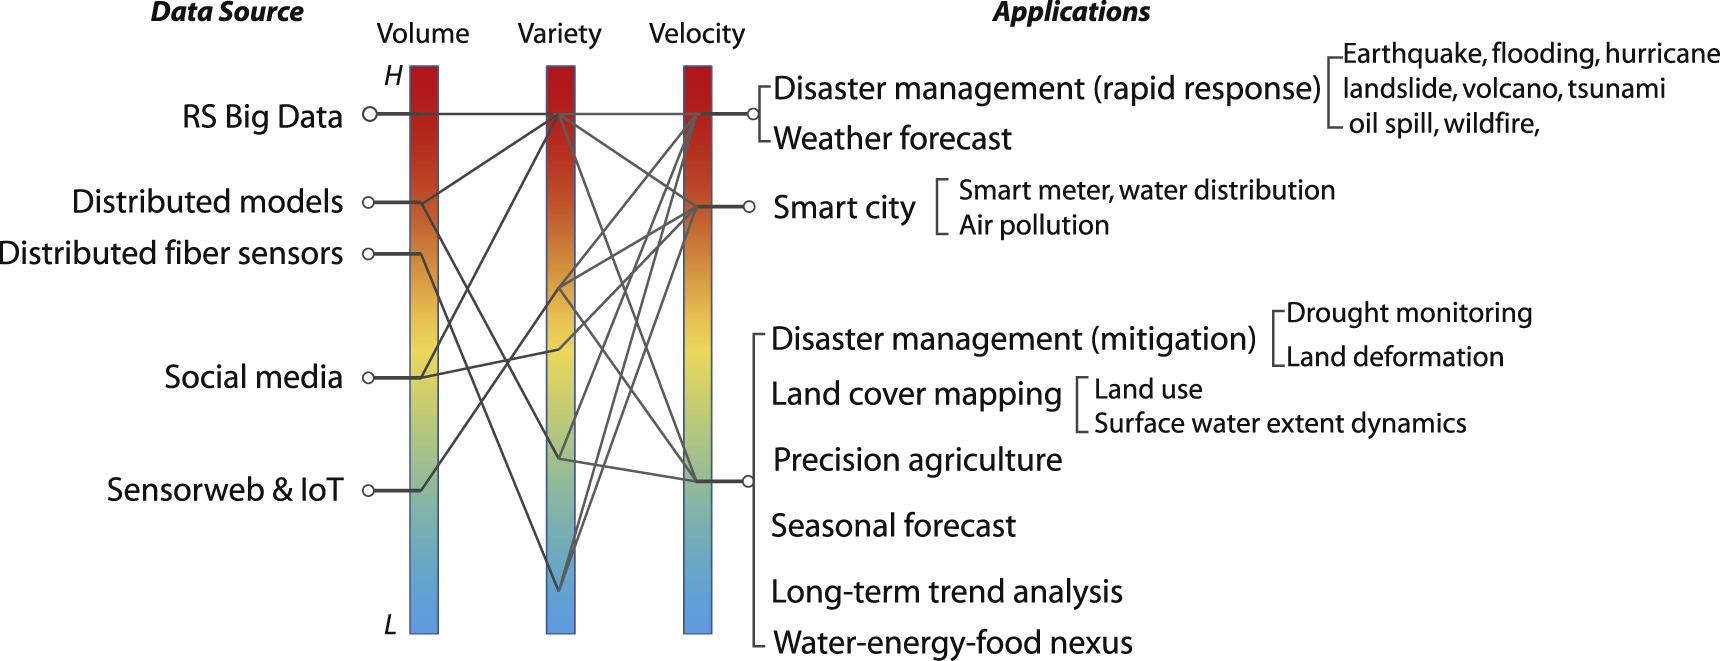
Table 2. A survey of EWM Big Data applications (number in parentheses indicates the number of articles found under each subcategory).
| Application area | Subarea | Example studies | Main challenges |
|---|---|---|---|
| Disaster management | Flooding (25) | Remote sensing [61, 62, 65] | Real-time data access, data integration, lack of co-observed images |
| Social sensing [67, 68, 70, 91] | Data validation, missing geotags | ||
| Earthquake (10) | [92–95] | Real time damage assessment | |
| Landslide (2) | [96–98] | Data fusion for early warning | |
| Oil spill(5) | [99, 100] | Data resolution | |
| Smart city | Water distribution and allocation(2) | [87] | Data fusion and governance |
| Sustainability (17) | [86] | ||
| Land cover mapping (27) | Surface water extent | [82, 83] | Data volume |
| Drought monitoring (8) | [76, 101] | Data fusion, trend detection | |
| Land deformation (4) | [102] | ||
| Crop yield, precision agriculture (11) | [78, 79, 103] | Data validation | |
| Long-term trend analysis (6) | [82, 84] | Multiresolution, nonstationarity | |
| Food-water-energy nexus (5) | [104, 105] | ||
On the data source side, so far remotely sensed (RS) Big Data represents the most prevalent data source in all papers surveyed. On the application side, the problems can be further classified into predictive, diagnostic, descriptive, and prescriptive analyses. Rapid disaster response is a commonly documented application area that ranks high in all 3V attributes. Natural disasters are often characterized by their unpredictability, availability of limited resources in impacted areas, and rapid situation changes [27], making RS data the most useful and, sometimes, the only source of information for assessing the situation on the ground. Disaster management in many countries is a closed-loop process involving four major stages: (a) long-term planning and mitigation, (b) early warning and prevention, (c) rapid response and rescue, and (d) recovery and restoration [27, 58]. The characteristics of Big Data thus vary according to the stage of disaster management and the RS technology involved, as well as the actual application needs, which is illustrated in figure 6.
Flooding is one of the most frequently occurring natural hazards, causing significant socioeconomic damage in many regions around the world [59, 60]. Thus, not surprisingly flooding is one of the most studied topics under EWM Big Data. During flooding events, RS provides a cost-effective way for delineating and tracking surface water dynamics, including the extents and water stage. Pollard et al [61] discussed Big Data approaches for handling coastal flooding on issues related to synthesis of coastal datasets, data handling and validation, and integration with process-based models in real time. Huang et al [62] reviewed sources and techniques for detecting, extracting, and monitoring surface water extents using optical remote sensing. Remote sensing of surface water bodies can be done using multispectral, hyperspectral, and microwave sensor data (e.g. synthetic aperture radar, or SAR). Hyperspectral sensing is concerned with the extraction of information from objects or materials on the Earth's surface, based on their radiance acquired by airborne or spaceborne sensors [63]. Hyperspectral imagery typically includes hundreds of bands and carries more detailed spectral information that may be used to differentiate materials with only slightly different spectral characteristics [64]. For the same reason, information in the resulting hyperspectral sensing images is also highly redundant, meaning values in the neighboring locations and wavelengths are highly correlated.
Common public domain RS sources for surface water monitoring include MODIS (250–1000 m), Landsat8 (15–80 m), and Sentinel-1, 2, 3 (10–300 m) satellites. On the other hand, commercial RS data sources (e.g. IKONOS, RapidEye, Worldview, ZY-3, Quickbird, and GF-1/2) may provide images with spatial resolutions at meter or even submeter resolution, but are limited to small-scene coverage and longer revisit intervals. Notti et al [65] discussed potential and limitations of the public domain RS data for flood mapping; in particular, cloud coverage, spatial resolution, and the latency of co-observations (e.g. co-observed SAR imagery) were believed to limit the value of these public domain data in disaster response operations, although multiresolution data fusion techniques may alleviate some of the limitations (see section 4). In recent years, the launch of microsallite or cubesat constellations, which consist of groups of lower-Earth-orbit, light-weight satellites working together, may fundamentally change the landscape of Earth imaging. Planet's SkySat constellation (commercial data), for example, can scan the Earth at sub-meter resolution every single day and can generate continuous video clips lasting up to 90 s at 30 frames per second for pattern-of-life monitoring and 3D modeling (https://planet.com). The volume of data generated has pushed RS data processing to a new level that is dubbed by some authors as Remote Sensing 2.0 [66].
Social sensing is also emerging as a form of unstructured data for inferring real-time situations. In the case of flooding situation awareness, Arthur et al [67] used publicly available social media data (Twitter data) to detect and locate flood events in UK, by following a four-step data analytics process, namely, data collection, content filtering, location inference and event detection. The authors suggested that the number of tweets may be used as a proxy for the severity of floods. Smith et al [68] assessed the utility of combining social networking data and real-time high-resolution hydrodynamic modeling, where the Twitter data stream was used to inform locations of storm events for invoking near real-time, hydrodynamic model runs. Main challenges identified by those authors are (a) typically only a small percentage of tweets have GPS coordinates attached as metadata, making geolocation inference difficult; (b) downloading and use of social media data are often restricted by vendor policies; and (c) semantics of social media data is often vague and hard to quantify. In urban environment, a possible workaround is to supplement social sensing data with known-location sensor data. Zhai et al [69] described a traditional sensorweb framework for fusing multisource sensor streams during hydrological disaster events by using web services. Restrepo-Estrada et al [70] proposed a transformation function for converting georeferenced social media data into a proxy indicator for use in conjunction with gauge hydrometeorological data to calibrate a streamflow model. In the Array-of-Things Project [71], hundreds of networked sensor nodes (camera, air quality sensor, weather sensor) were mounted on light poles in Chicago, US, to provide high spatial and temporal resolution sensor data; all sensor nodes are equipped with an edge computing platform to process the sensor data on the node so that privacy information is stripped from the derived data products. These sensor data hubs potentially encourage more public participation and can eventually lead to more sustainable cities, but they also pose new challenges in terms of long-term maintenance and data stream analytics.
Unmanned aerial vehicles (UAVs) represent yet another data source for aiding disaster response and rescue effort. Compared to satellite RS data, UAV data collection is considered more agile—UAVs can be remotely controlled or have a programmed route to perform autonomous flights. UAVs have been deployed to collect small-scene geodata to improve situation awareness during and after natural disaster events [66]. UAV data has been used in earthquake and tsunami damage assessment, and landslide survey [25, 72, 73]. Many UAVs carry hyperspectral sensors onboard that can sample narrow band spectra and provide more details that are otherwise unnoticeable if multispectral sensors are used. However, the high volume of hyperspectral data currently represents a Big Data processing challenge, especially for real-time applications [63, 74].
Monitoring and analysis of non-time-sensitive phenomena are generally less data intensive, but may require significant effort when working with long time series and multisource data. Droughts, caused by sustained rainfall deficits, represent a slowly developing natural hazards and can occur in virtually all climatic zones [75]. RS Big Data have been used to (a) perform drought monitoring from a climatological perspective, by retrieving hyperspectral, multispectral, thermal infrared, gravimetry, or microwave satellite data to monitor precipitation, soil moisture, evapotranspiration, or terrestrial water storage; and (b) assess and quantify drought impacts from an ecosystem perspective, by using satellite observations to assess vegetation health [76]. Drought analyses focus on early warning and impact assessment. Although the velocity of observation data is less of a concern and most of the analyses are performed offline, scalable distributed platforms are desirable to manage and synthesize information from multisources and multi-sensors [77]. Main data analytics challenges are related to (a) fusion of multi-sensor data to derive drought information, (b) development of robust long-term climatology for drought assessment, (c) development of robust change detection methods for drought warning, and (d) enabling self-service, region-specific drought analyses at different user-specified resolution or scales.
Big Data and IoT are behind many precision agriculture or smart farming applications. For example, estimation of crop yield, defined as the ratio of total mass of harvested product to cropped area, is an application area that may benefit from recent advances in Big Data analytics. Traditionally, crop yield relies heavily on field survey. Azzari et al [78] introduced a scalable satellite-based Crop Yield Mapper (SCYM) that combines crop model simulations with imagery and weather data to generate 30-m resolution yield estimates; their work focused on tracking spatial crop yield variation using publicly available data (Landsat and MODIS) on the Google Earth Engine platform. Burke and Lobell [79] showed that high-resolution satellite imagery (SkySat) can be used to make predictions of smallholder agricultural productivity to an extent that is as accurate as the survey-based measures. Adão et al [74] discussed processing and application of UAV hyperspectral data in agricultural and forestry applications.
EWM trend analysis involves the use of long-term observation time series from multiple sources of information. It becomes a Big Data problem when each slice of the time series in turn involves multi-dimensional data such as multispectral or even hyperspectral imagery. So far, Landsat datasets, with nearly 40 years of continuous observation, are the most analyzed. Kennedy et al [80] described LandTrendr (Landsat-based detection of Trends in Disturbance and Recovery), an algorithm to extract spectral trajectories of land surface change from yearly Landsat time series stacks. Wulder et al [81] surveyed Landsat-based change detection applications including, for example, forestland change, phenology, wetlands, land fragmentation, and urban impervious surface change. In an application that is more related to flood prevention and planning, Heimhuber et al [82] and Heimhuber et al [83] modeled surface water extent dynamics using statistically validated long-term time series consisting of more than 25 000 Landsat images available for the period 1986–2011, in combination with streamflow, rainfall, evaporation, and soil moisture data, for Australia's Murray-Darling Basin. Zou et al [84] analyzed open-surface water bodies using Landsat 5, 7, and 8 images (∼370 000 images, >200 TB) of the contiguous US in the period 1984–2016.
In parallel to the development in high-resolution remote sensing, sensor web and IoT are being increasingly deployed in smart city applications. Abella et al [85] defined smart city as 'a public-private ecosystem providing services to citizens and their organizations with strong support from technology, and considers the social and economic impact on the society.' Bibri and Krogstie [86] coined the term smart sustainable city, which refers to the pervasive and massive use of advanced ICT to enable the city to control available resources safely, sustainably, and efficiently to improve socioeconomic outcomes. The use of Big Data to create added value and innovative services is a key element in smart city applications. Smart city sensor networks typically deploy a large number of environmental sensors as mentioned in the Array-of-Things application. Most of the smart city applications are still in their nascent stage, but cost-effective cyberinfrastructure and Big Data platforms, as well as transparent data governance policy, have already been identified as the key enabling components. March et al [87] described the experience of smart water meter use in Alicante, Spain, and suggested that the access to detailed knowledge of water use at the household level can be used to identify patterns of water consumption, eventually leading to better water conservation and improvement of efficiency of the water network. Stewart et al [88] presented web-based system for collecting real-time water consumption data through a smart water metering system, and transferring and storing the data into a repository for knowledge extraction. Eggimann et al [30] reviewed the role of data analytics in urban water management applications (e.g. urban pluvial flood-risk management and forecasting, drinking water and sewer network operation and management), and suggested that data-driven urban water management analytics allows for optimization of the efficiency of the existing network-based approach and can extend functionality of the current systems.
Many of the applications described in the above are interwoven and are increasingly being studied under cross-disciplinary initiatives such as food-energy-water (FEW) nexus. Creating a Big Data analytics platform for supporting FEW nexus studies is challenging and requires inherent support for (a) interfacing coupled models involving physical, chemical, and biological models, socioeconomic models, and models of law and policy; and (b) engaging participation of multiple stakeholders. The success of these platforms depends on whether multi-faceted datasets can be transformed and ingested to support decision making. In addition, the process-based coupled models are often computationally costly to run and not suitable for web-based decision support. Surrogate models may be developed to bridge process-based modeling and decision support [89, 90] (see also 4.2.3).
3.4.2. Problems Big Data can tackle, but with some help
Big Data analytics can lead to smarter decisions, optimal solutions, and deeper insights, but the success of Big Data analytics hinges on whether knowledge can be extracted in a timely manner and delivered to those who most need it. Many EWM applications involve problems that can be potentially solved using Big Data analytics, but the solutions of which are not yet being sought due to technological difficulty, institutional resistance, lack of in-house talents, and high entry cost.
Technology wise, remote sensing technologies can now provide synoptic view of exposed objects and structures at an extremely high level of details [66]. Some authors used the term 'big crisis data' to refer to the large amount of unstructured and structured data generated during disaster events, which has the potential to significantly improve situational awareness and support decision making during disasters [25]. Operational disaster management is an area that can benefit from better cyberinfrastructure and higher throughput Big Data pipelines. The need for speed was highlighted as one of the most crucial elements in disaster management [66]. Loading and transmission of Earth observation Big Data in real time, however, represent a main bottleneck for data ingestion, especially when high-resolution data streams are involved, for example, in UAV and microsatellite applications. Key data ingestion considerations include velocity, size, and format of the incoming data. In addition to improving the network bandwidth scalability, strategies are needed to reduce data volume, which may include data compression and reduction implemented at the edge for each data instance. Data compression techniques seek to reduce spatial and temporal data volume by using, for example, data aggregation/upsampling and sparse representation (e.g. principal component analysis, discriminative sparse coding, joint sparse representation, sparse autoencoder (SAE), and discrete wavelet transform) [106–109].
Data modeling and standardization also represent a critical challenge for ingesting real-time IoT data streams. The Open Geospatial Consortium (OGC) has developed a number of specifications for standardizing geospatial web services, including web coverage service and web map service, for individual users to employ in a client-server spatial computing setting. WaterML is a data standard for modeling hydrological time series and was developed by the Consortium of Universities for the Advancement of Hydrologic Science (CUASHI) and OGC [110]. OGC recently developed SensorThings standard to help overcome the interoperability challenge in the IoT domain [111]. SensorThings uses OGC's Observations and Measurement standard as data model, and defines a REST-like application programming interface (API) to interconnect IoT devices over the Web, and to interact with and analyze their observations [112]. The characteristics of Big Data, however, often require data standardization and other data wrangling tasks to be performed more efficiently. Cloud-based data warehouses are repositories of cleansed and structured data stored in a cloud. On the other hand, data lakes typically endorse a 'store all' philosophy and are used to store raw data in its native format, both structured and unstructured, until it is needed. By design, data lakes give the end user more flexibility (or elasticity in terms of data provisioning) and probably even more insight because of the availability of raw data. The downside, however, is that data lakes tend to create additional complexity, cost, and latency, which only get worsened as data volume increases. Apache Sqoop (http://sqoop.apache.org) can facilitate the transfer of bulk data between data lakes and data warehouses efficiently. A number of Apache projects (Storm, Flink, Spark, Kafka) are designed to provide distributed frameworks for performing real-time or near real-time data ingestion, allowing the EWM users to focus more on domain specific problems.
Organizational wise, data silos still widely exist because of data acquisition cost and lack of incentives to share data. Open data policies have been shown to have a profound impact on scientific discoveries [85, 113]. One of such well-known examples is Landsat data, which was charged US$600 per scene prior to 2008, but has been made freely available to the public since 2008 [81]. Mass processing of Landsat data, enabled by the cloud-based Big Data platform, opened new venues for understanding long-term ecological and land cover dynamics. Another example is European Union's Earth observation program, Copernicus, which assembles and produces open-source remotely sensed data (currently 12 Tb d−1) from a global network of thousands of sensors (https://copernicus.eu/en/access-data). Several authors have analyzed the role of open data in the context of smart cities and demonstrated the potential impact of open data on data-driven innovation in cities [85]. Historically, the opening and commercialization of remote sensing technology in 1990s happened at the same time as a shift in environmental security discourse towards human security and resilience. The focus of environmental security in recent decades has increasingly shifted away from the international system or the nation-state towards individuals' and local communities' vulnerabilities and local environmental risks [114]. New actors, including non-government organizations, commercial entities, social scientists, and general public, are increasingly involved in forming narratives and storylines of environmental migration and conflict, because of the easy access to visual assemblages of EWM Big Data. Nevertheless, at this time many high resolution datasets are collected and owned by private firms who do not have strong incentives to share their digital assets [115]. A benign cycle needs to be formed to encourage investment from the government, non-government organizations, and private entities, eventually leading to lowered data cost and wider accessibility; in return, the data users should open-source the derived products and methods, instead of hoarding the data in silos. Toward this goal, Shum et al [49] envisioned a Global Participatory Platform (GPP), which consists a coherent set of interfaces, services, software infrastructures, tools, and APIs, as well as social institutions, legal and social norms that would allow the participants to collaborate openly, freely and creatively in the development and use of knowledge. Main functionalities of the envisioned GPP may include (a) sensing the environment in order to pool data, (b) mining the resulting data for patterns in order to model the past/present/future, and (c) sharing and contesting possible interpretations of those models, and in a policy context, possible decisions.
Finally, central to the success of EWM Big Data is the availability of a trained workforce that is proficient in bothdata science and EWM disciplines. The current environmental and geosciences curricula need to be enriched to equip students with the latest knowledge and Big Data analytics techniques.
3.4.3. Problems Big Data can eventually solve
Currently EWM Big Data analytics address more association type of inference than causal inference; thus, Big Data alone is unlikely to provide explanations of causal mechanisms on the observed environment processes [114, 116]. In other words, rather than providing answers to questions, the current Big Data platforms mainly enable the cability for researchers and policymakers to seek courses of action and to determine their consequences [117]. Nativi et al [118] described a geodata discovery and access broker (DAB) to provide necessary mediation on data discovery. Google recently released Google Dataset Search (https://toolbox.google.com/datasetsearch) to facilitate data sharing and discovery. The EWM community needs to leverage the enhanced data discovery tools to develop strong inference and predictive analytics engines, and to improve sensemaking and situation awareness.
EWM is lagging behind the business intelligence world in the ability to infer meaning from data and subsequently take actions based on that meaning (e.g. recommendation engines for online shopping or social networks). Most EWM problems are also inherently more complicated than the typical business intelligence problems, often requiring the syntheses of multivariate and higher-dimensional time series for sensemaking. As the data quantity continues to increase and data quality improve in the future decades, ML is expected to be more well trained and reliable, and the inference capability of EWM is expected to improve as well. The fate of EWM Big Data will depend on the actions taken within all three groups shown in figure 4, as well as the coordination among the groups.
Eventually the role of EWM Big Data analytics will be to facilitate and automate common tasks related to the provision of datasets, data mining, reinforced learning, participatory decision making, and even to the making of human-like inference. In the course of doing so, the current Big Data will become leaner but more intelligent Smart Data in the future, with a large portion of data complexity removed and more high-level information infused. The road to the Smart Data era will require a different scale of operation from the current one, specifically the current EWM data platforms will need to better support collective intelligence of human agents. A collective computing platform such as the GPP envisioned by Shum et al [49] will also be necessary, in which different agents/stakeholder are equipped to effectively sense their environments, interpret signals, share the results, deliberate and debate, and ultimately, make better decisions.
3.4.4. EWM data analytics platforms used
The role of an integrated platform in Big Data analytics cannot be overemphasized. According to Khalifa et al [119], the six pillars of the Big Data platforms are storage, processing, task scheduling, analytics workflow assistance, user interface, and deployment. Table 3 lists the analytics platforms mentioned in the papers collected for this review. The Apache Big Data ecosystem (Hadoop, MapReduce, and Spark) is the most frequently cited in the papers reviewed. These software components are built for general purposes. So far, only a few integrated platforms are specially designed for ingesting and analyzing Earth observation applications. Google Earth Engine, which is free for research, education, and nonprofit use, provides a large collection of Earth observation data, as well as APIs to enable the analysis of these large datasets on Google Cloud without downloading the data. Amazon's cloud service is behind NASA's Earth Data portal. In addition, Amazon also hosts its own selection of Earth observation data (e.g. Landsat, DigitalGlobe Open Data). Microsoft, teaming with Environmental Systems Research Institute (ESRI), provides a GeoAI Data Science Virtual Machine service for geospatial analytics. Plenar.io is an open data portal for sharing and analyzing data streams from smart city applications. Cloudera and Hortonworks offer cloud-based software and services for performing data analytics.
Table 3. Survey of Big Data analytics platforms used.
| Platform | URL | No. Articles | Availability |
|---|---|---|---|
| Apache Hadoop, MapReduce, Spark | http://apache.org | 37 | Open source |
| Google Earth Engine | https://earthengine.google.com | 17 | Free for non-commercial uses |
| Earth on AWS | https://aws.amazon.com/earth | 8 | Open data |
| https://earthdata.nasa.gov | |||
| Planet Analytics | https://planet.com | 10 | Commercial |
| Microsoft Data Science VM | https://azure.microsoft.com | 1 | Commercial |
| Microsoft AI for Earth | https://microsoft.com/en-us/ai-for-earth | 1 | Commercial |
| Plenar.IO | http://plenar.io | 1 | Open source |
| tableau | https://tableau.com | 1 | Commercial |
| Hortonworks | https://hortonworks.com | 1 | Open source |
| Cloudera | https://cloudera.com | 4 | Commercial |
4. Result synthesis on deep learning
4.1. Deep learning (DL)
ML algorithms have been around for decades if not centuries, considering the linear regression problem originally studied by CF Gauss is a type of supervised learning. A summary of the traditional ML algorithms can be found in many classical textbooks (e.g. [120]). The modern DL era is commonly believed to start in 2006 with the publication of the seminal paper by Hinton et al [121], who proposed an efficient algorithm to train an artificial neural network (ANN) with many layers. The fact that modern DL era started about the same time as the Big Data era is not just a pure coincidence. The availability of more powerful computers with multi-processor CPU and GPU contributed directly to the record-breaking performance of DL algorithms in recent computer vision contests [122, 123]. It is the rapidly growing Big Data, however, that motivates the development of more scalable and commercially operational DL algorithms for Big Data analytics and knowledge discovery. Thus, the modern ecosystems of Big Data and DL are highly intertwined, sharing common use cases and providing mutual impetus to each other's advancement.
Traditional forward neural nets with many hidden layers were hard to train because of the 'vanishing gradient' problem arising during training [122]. The backpropagation algorithm used to train ANN invariably adopts a certain gradient based algorithm. For an ANN model involving many hidden units that are connected using the traditional activation functions (e.g. hyperbolic tangent or sigmoidal function), the gradients of the network's output with respect to the unknown weights can quickly become too small, resulting vanishing updates. Three key changes were instrumental for paving the way of the modern DL era [31, 124]. The first key change was the adoption of piecewise linear activation functions, such as rectified linear function (ReLU), in lieu of the traditional activation functions, which have been shown to significantly suppress the vanishing gradient problem [124]. ReLU, defined as  , where x is the input, is a simple function that is faster to compute and leads to sparse representations; more specifically, only about half of the hidden units are active and have non-zero outputs. The second key change was the incorporation of better regularization techniques to reduce overfitting. Besides regularization used on the cost functions, two commonly used heuristic regularization techniques are dropout and batch normalization. Dropout is a simple technique that randomly ignores a portion of hidden units during training. To compensate for the reduced effective capacity of a model due to dropout, a large model size must be used. Batch normalization partitions the training data into small batches (mini-batch) and then normalizes each mini-batch to have zero mean and unit variance [125]. Batch normalization makes it possible to use larger learning rate (learning rate is a hyperparameter that controls the step size in gradient descent algorithms) and in some cases even eliminate the need for dropout. The third key change is the incorporation of shared weights and biases in each hidden layer. Weight sharing drastically reduces the number of unknown parameters resulting from each pair of connected layers, with many units in the input connecting to the same units (or local receptive field) in the output. When combined with a large training dataset, the seemingly trivial techniques mentioned herein make it possible to train a deep network architecture layer by layer, at an accelerated training speed while avoiding overfitting.
A direct consequence of adopting deeper architectures in DL is that discriminative features of input data can be extracted and learned through hierarchical representations such that higher-level features are derived from lower-level features [126]. Thus, the burden of feature design is shifted to the underlying DL system. In comparison, many traditional ML algorithms rely on hand-crafted features, which are selected via a so-called feature engineering process, to achieve good performance. Like for the traditional ML, the existing DL algorithms can also be divided into unsupervised, supervised, and semi-supervised learning algorithms. Under supervised learning, classification and regression problems are commonly solved. For classification problems, a classifier is used at the output layer, such as the softmax function that gives probability distribution of different classes. For regression problems, both linear or nonlinear (e.g. hyperbolic tangent) activation functions can be used to get continuous outputs. For completeness, in the following we first briefly describe several dominant algorithm categories that are used in the papers surveyed, before presenting the actual DL applications in EWM.
4.1.1. Autoencoder
Autoencoder, or AE, is a neural network used for unsupervised learning of unlabeled data. A typical AE consists of a couple of functions, an encoder and a decoder. For input data  , where N is data dimension, the encoder function maps the input to a latent space, y = f(x), where
  is latent representation or code. The decoder function then conducts an inverse mapping or reconstruction, from the latent space to the input space,
  . For an AE with a single hidden layer, the encoder may be expressed as
  , and the decoder may be written as
  , where
  and
and  are element-wise activation functions (e.g. sigmoid) used to transform (reconstruct) the input, and
  and
and  are weight matrices and bias vectors of the encoder and decoder, respectively. Training of AE is done by minimizing a cost function,
  that measures the similarity or distance between input data and reconstruction, for example, the mean square error. In essence, the AE tries to reproduce the input, but in a parsimonious way that promotes learning the most useful features of the input data. In other words, the main purpose of AE is to learn a generative process (see more about generative modeling below) and AE provides a nonlinear alternative to the commonly used PCA for feature extraction and dimension reduction. Thus, sparsity of the AE is an important consideration in its design—if the encoder and decoder are allowed too much capacity (i.e. too many hidden units), the AE only duplicates the input without learning the most useful features [31]. In SAE, an extra sparsity constraint is added to the cost function
  A commonly used sparsity penalty term is the Kullback–Leibler (KL) divergence [127, 128]

where r is a sparsity parameter (typically close to zero),  denotes the average activation of the jth hidden unit that is averaged over the training set, and s is the total number of hidden units in a layer. To progressively learn higher level representations, a deep Stacked SAE (SSAE) architecture is usually formed by chaining the input and hidden layers of a number of SAEs on top of each other [129]. The number of hidden units, the type of activation function, and the number of layers in an AE model are hyperparameters and need to be tuned during validation.
SAE and SSAE are mainly used to perform the so-called unsupervised pretraining, the outputs of which (i.e. high-level feature representations) are passed to a classifier (e.g. a logistic regression function or a supervised learning algorithm) to perform the actual classification.
4.1.2. Convolutional neural networks
CNNs, first introduced by LeCun and his collaborators [130–132], are multilayer feedforward neural networks designed to process input data that has grid-like structured topology, which appears in a large number of EWM applications involving time series of scalars (1D), gray-scale images (single channel 2D inputs), color images (three-channel 2D inputs), and multi-dimensional, time-varying Earth observation data ( 3D). A standard convolution layer consists of three operations, namely, convolution, nonlinear transformation, and pooling. The convolution operation systematically moves a kernel (filter) across the input layer and outputs a feature map. Each move generates an element (pixel) of the feature map obtained by computing a dot product between the kernel and a local region in the input (or receptive field). The dimensions of the kernel are typically much smaller than that of the input. For a 2D input of dimensions W × H, and a kernel of sizes Wf × Hf, outputs of the convolution operation are

where I is the input, K is the kernel,  is a stride parameter that controls the skip distance between consecutive kernel moves, and x(i, j) is the value of the feature map at location (i, j), i = 1, ..., W, j = 1,..., H. The size of the feature map is ((W − Wf)/Sf + 1),(H − Hf)/Sf + 1)). The convolution operation is followed by an element-wise transformation using a nonlinear activation function,
  . So far, ReLU and its variants are the most widely used hidden layer activation function for reasons mentioned in the beginning of this section. In the third stage, outputs are further modified through pooling, which is a subsampling operation that replaces the output at a certain pixel with the summary statistics (e.g. maximum, average) from a local region surrounding the pixel. The convolution layer exemplifies three core concepts of ML, namely, sparse connectivity, parameter sharing, and equivariant representation [31]. The former two are accomplished by using a single and small-sized kernel to scan the entire input, whereas the equivariant representation property is achieved by design—when the input changes, the output changes in the same way. In practice, each convolutional layer may consist of a large number of kernels (filter bank) to extract different aspects of the input data (e.g. edges, corners). A deep CNN is a multilayer architecture composed of multiple stacked convolutional layers to extract hierarchical feature representations, with each convolutional layer also being used in conjunction with the dropout or batch normalization layers to reduce overfitting and improve learning speed. The kernel weights and biases of convolutional layers are trainable parameters.
CNNs have been used in all three types of learning problems. The success of CNNs relies on their capability to learn hierarchical representations of context invariant features, which are particularly useful for image classification [133]. At present a large number of CNN-based deep architectures exist in the literature, including those that have won the recent computer vision contests, such as AlexNet [134], GoogLeNet [135], VGGNet [136], and ResNet [137]. Early CNN architectures (e.g. AlexNet, VGGNet) use one or more fully-connected dense layers between the last convolutional layer and the classifier to enable classification into a small number of classes, while recent designs favor end-to-end fully convolutional networks (FCNs). Representative designs of the latter kind include the standard FCN [138], U-Net [139], and SegNet [140].
In computer vision, CNN architectures for pixel level classification use two main approaches, patch-based and pixel-to-pixel based methods. In patch-based methods, a CNN classifier is trained on small image patches, which is then used to predict the class of each pixel using a sliding window; this type of methods are suitable for detecting large objects. In pixel-to-pixel methods, a FCN-like method is used to predict class labels. For example, in the standard FCN, the classifier is a convolutional layer of the same size as the input, which allows fine-grained inference such that each pixel is labeled with the class of its enclosing object or region [138]. U-Net and SegNet further the ideas of the standard FCN by using a symmetric contraction-expansion architecture, which includes a downsampling (encoding) path followed by an upsampling (decoding) path to recover the input resolution. Downsampling by pooling inevitably loses fine-detailed information. To recover information lost in the downsampling path, skip connections are used in FCNs to concatenate feature maps from the same level of downsampling path and upsampling path, such that more abstract semantic information is fused with shallow fine-scale information. To further improve learning, transposed convolutional layers with trainable parameters are also used in upsampling paths, instead of the bilinear interpolation, to recover more spatial information [138]. Pixel-based classification accuracy may be further improved as part of the post-processing by enforcing spatial regularity (smoothness) using probabilistic graphing models, such as the conditional random fields (CRF) that model the posterior distribution of labels for given observed data [141].
4.1.3. Generative models
Many fields of EWM are characterized by limited labeled data and small sample sets, due to, for example, sparse in situ observation networks and high costs associated with labeled data creation. Training a supervised ML algorithm on limited training data can result in severe overfitting. The advent of Big Data era has created a wealth of unlabeled data. It is thus desirable to utilize the abundant unlabeled data to compensate for the lack of labeled data in many applications. Several ways exist for tackling this problem, which all fall under semisupervised learning.
Transfer learning seeks to learn a less observed process or domain y by exploring 'indirect clues' from another related process/domain x with abundant data. Putting in a slightly different way, transfer learning may also be regarded as using what has already been learned about x to improve generalization of y. Similarly, domain adaptation refers to learning a single system from the set of domains for which labeled and unlabeled data are available and then applying it to any target domain (labeled or unlabeled) [142].
Generative modeling seeks to learn a good representation of x through unsupervised learning of unlabeled data, and then uses it to compute the conditional distribution  , for which only a small sample set exists. A variant of generative modeling is to assume a latent variable h exists that represents the underlying causes of the observed x, and the outputs y are among one of the causes. Then learning h makes it possible to predict y. These ideas are behind a number of DL models. For example, the AE described before can be considered a type of generative model that learns a latent variable. The deep belief network (DBN), which was used in the original work of Hinton et al [121] to demonstrate training of deep architectures, is a type of deep generative graphical model. A commonly used building block of DBN is the restricted Boltzmann machine (RBM), which is a simple undirected probabilistic graphic model containing a visible layer v and a hidden layer h. The latent variables are typically binary. The RBM is fully connected, meaning each unit in a layer is connected to all other units in the neighboring layer; however, there are no direct interactions between units inside the same layer. The RBM is an energy-based model with its joint probability distribution specified by an energy function,

where a, c, and W are trainable parameters. Like AE, RBM performs nonlinear dimension reduction and feature extraction, and it can extract features in hierarchical levels when stacked. As shown in Hinton et al [121], training of a DBN can be done using a greedy layer-wise unsupervised learning procedure that trains the DBN one layer at time. At the last stage, supervised fine-tuning is optionally done to adjust parameters of all layers together.
The generative adversarial network (GAN), first proposed by Goodfellow et al [143], pairs a generative network with a discriminator network in a game-theoretic framework. The generator network samples from a probability distribution  in other words, it transforms samples from a low-dimensional latent variable z to samples of a potentially high-dimensional variable x. The discriminator network,
  , tries to distinguish 'faked' samples generated by
  from the training data samples, assigning a value of 0 to faked samples and a value of 1 to real training samples. Here,
  and
and  are trainable parameters of the generator and discriminator networks, respectively. In a zero-sum game, the generator and discriminator attempt to maximize their own payoff, leading to a minimax optimization problem

in which the cost function V(g, d) is

where  denotes the expectation operator over the respective probability distribution. At convergence of the optimization, the discriminator is maximally confused, meaning the generator samples are indistinguishable from the training samples, forcing the discriminator to emit a probability of 0.5 on all inputs. The standard GAN essentially trains the discriminator into a classifier using a small amount of labeled data, thus providing a powerful framework for semi-supervised learning.
Training of GANs, however, is known to be challenging due to larger networks (i.e. more trainable parameters), the nonconvex cost functions used in GAN formulations, diminished gradient (the discriminator gets so successful that the generator's gradient vanishes and learns nothing), and mode collapse (the generator only returns samples from a small number of modes of a mutimodal distribution). Nevertheless, GANs represent one of the most active research areas in DL. A number of GANs have emerged from the computer vision research for (a) image generation, such as Wasserstein GAN [144], and stacked GAN [145]; (b) cross-domain image translation where labeled information in the form of either text description or image is used to generate images in another domain, such as coupled GAN (coGAN) [146], conditional GAN (cGAN) [147], CycleGAN [148], and DualGAN [149]; (c) image super-resolution, where the resolution of coarse images is enhanced, such as deep-convolution GAN (DCGAN) [150] and superresolution GAN [151].
4.1.4. Training of DL models
Training of DL models is computationally challenging. First, large-scale DL models may have thousands to millions of trainable parameters, which need to be tuned using a large amount of data. Second, solving the optimization problems involved in DL is more of an art, requiring careful considerations on factors related to, for example, the design of cost functions (including hyperparameters), the selection of solvers, and heuristic strategies (e.g. early stopping, dropout, batch normalization) for preventing overfitting and accelerating training speed. ML training optimization is different from the general optimization problems in the sense that training algorithms do not halt at local minimum; instead, ML training usually minimizes a performance measure defined with respect to the training dataset, and halts when a convergence criterion based on early stopping is satisfied over a validation dataset [31]. Commonly used state-of-the-art large-scale DL algorithms include stochastic gradient descent (SGD), SGD with momentum (Momentum), adaptive moment estimation (Adam), and root-mean-square propagation (RMSProp) solvers. A detailed description of the solvers can be found in [31].
In general, large-scale learning can get help from scalable parallel solvers, the efficient use of in-memory processing to reduce data transfer cost, and hardware acceleration through GPUs or Field Programmable Gate Arrays (FPGA). Most stochastic solvers (e.g. SGD) are scalable by performing parallel processing on subsets of training data, instead of on the whole set of training data. The best strategy for EWM domain users may be leveraging the distributed ML support provided by existing Big Data ecosystems, including Spark MLlib and Apache Mahout (see figure 5). Out-of-box support for hardware acceleration is also provided by open DL packages and libraries, such as Theano, Caffe, Torch, and Google Tensorflow.
4.2. DL applications in EWM
Table 4 provides a summary of DL applications based on the papers collected for this review. For each type of application, a small set of citations are listed as examples.
Table 4. Survey of DL methods and applications.
| Category | Subcategory | DL technique used | Example articles |
|---|---|---|---|
| RS classification | |||
| Scene classification | [187] | ||
| Automatic target recognition | Generative Adversarial Network (GAN) | [188] | |
| Segnet | [189] | ||
| Deep CNN w/ fully connected layers (DCNN) | [190, 191] | ||
| Deep Belief Network (DBN) | [99] | ||
| Rotation invariant CNN (R-ICNN) | [192] | ||
| Transfer learning | [193] | ||
| Faster Region-based Convolutional Network (Faster R-CNN) | [159] | ||
| Image registration | DCNN | [194] | |
| GAN | [195] | ||
| Pixel-based classification (Semantic segmentation) | DCNN | [155, 158] | |
| Stacked autoencoder (SAE) | [196] | ||
| Fully Convolutional Network (FCN) | [197–199] | ||
| SegNet | [200–202] | ||
| Fine segmentation network (FSN) | [203] | ||
| Gated segmentation network (GSN) | [204] | ||
| Ensemble FCN | [205] | ||
| Super-resolution CNN (SR-CNN) | [206] | ||
| Multiresolution CNN (FuseNet) | [207] | ||
| DeepWaterMap | [208] | ||
| HallucinationNet | [209] | ||
| GAN | [156, 157, 210, 211] | ||
| Data fusion | |||
| Pansharpening, spatial-spectral | Pansharpening CNN (PS-CNN) | [212] | |
| Deep residual PS-CNN (DPS-CNN) | [213, 214] | ||
| Deep metric learning (DML) | [165] | ||
| Pansharpening U-net (PUnet) | [164] | ||
| Spatial-temporal, multiresolution | Deep convolutional spatiotemporal fusion network (DCSTFN) | [167] | |
| Long short-term memory (LSTM) | [170] | ||
| Change detection | DCNN | [215] | |
| Surrogate modeling | FCN | [181, 182] | |
| GAN | [216, 217] | ||
| Inversion, parameter estimation | State-Parameter Identification GAN | [183] | |
4.2.1. Earth data classification
A large number of existing DL studies in EWM pertain to remote sensing data classification problems, including scene classification, semantic segmentation, object tracking, and change detection. The goal of scene classification is to automatically assign an image to predefined semantic labels. In particular, holistic scene understanding aims at recovering multiple aspects of a scene so as to provide a better understanding of the scene as a whole, while semantic segmentation, also known as pixel-based classification or dense prediction, aims to predict and assign a class label to each pixel in an image. In object tracking/detection, the goal is to identify objects of interests (e.g. airplane, vehicle, or ship) from various sensing images.
Liu et al [152] was one of the first to apply CNN to detect extreme climate events (heatwave, hurricane, cyclone) from climate simulations and reanalysis products. Classification of hyperspectral image (HSI), which are 3D data cubes containing rich spectral and spatial information of the same scene, has attracted significant attention in recent years. A key interest in all HSI applications is to extract high-level feature representations of joint spectral-spatial information using DL. It has been found that incorporating both spatial and spectral information can provide significant advantages for improving the performance of classification techniques [63]. Chen et al [153] proposed a hybrid PCA and stacked AE method to perform HSI classification, in which PCA is applied to condense the volume of HSI while preserving spatial (contexual) information, the outputs from which are then passed to an SSAE. Similarly, Abdi et al [128] applied a deep SSAE to first perform unsupervised learning, and the output feature descriptors are used as input to a logistic regression classifier. Zhong and Gong [141] designed an end-to-end DBN and CRF model that leverages the strength of DBN in learning a high-level representation and the ability of CRFs to model (or regularize) contextual (spatial) information in both the observations and labels. Labeled HSI training samples are often limited. Chen et al [154] proposed to apply Gabor filtering as an unsupervised pre-training technique before CNN to help extract features, thus indirectly mitigating the CNN overfitting problem caused by the lack of labeled data. Hamida et al [155] recently developed 3D CNN architectures for the HSI classification. They showed that their 3D CNN models were able to achieve a better classification rate than the standard 2D CNN models. He et al [156] and Zhu et al [157] applied GAN to HSI classification, who showed that GAN gave better performance than the traditional CNN when training data was limited.
In object tracking, Alshehhi et al [158] used a patch-based CNN to extract roads and buildings, and a post-processing method to incorporate spatial structure (e.g. road connectivity and building closure). Ding et al [159] applied the faster region-based CNN (Faster R-CNN) for object detection. The Faster R-CNN [160] consists of two modules. The first module is a deep fully convolutional network for generating region proposals, where region proposals are boxes/regions in an image that potentially bound the object of interest. The second module is a detector that uses the proposed regions to find the occurrences of objects (i.e. classification).
4.2.2. Spatial and temporal data fusion
Fusion of spatial and temporal data has been extensively studied in the EWM literature [161–163]. Significant interests now exist in using DL methods to provide automated processing of large sensing datasets. In general, spatiotemporal data fusion is a special class of regression problems that seeks to obtain a better (e.g. more complete or less corrupted) dataset with higher spatial and temporal resolutions. Typical application areas found in the papers surveyed for this review include (a) pansharpening, (b) data imputation, (c) fusion of images from multiple satellites to reconstruct high-quality dense time-series data, and (d) fusion of remote sensing data with point measurements for space infilling.
Pansharpening refers to fusion of multispectral images with a high spatial resolution panchromatic image. It is also closely related to superresolution (SR) in image processing, which refers to the enhancement of the spatial resolution of imaging sensors by inferring information at the subpixel level. Yao et al [164] presented a variant of U-Net, the pansharpening U-Net, to enhance resolution of multispectral images, in which the inputs are low-resolution multispectral and panchromatic images, and the outputs are high-resolution multispectral images. Xing et al [165] trained an ensemble of SSAE to perform pansharpening of low-resolution panchromatic images. In their method, low-resolution images from different satellites are first divided into a large number of training image patches and are then clustered according to their shallow geometric structures. SSAEs are trained to learn mappings between the low- and high-resolution patches used for training. The resulting SSAE ensemble can then be used to construct high-resolution images from low-resolution images.
Jean et al [166] used CNN to predict the nighttime light intensities corresponding to input daytime satellite imagery, where the nighttime light intensity was used as a proxy for economic activity. In their method, a transfer learning approach was taken to use a CNN model pre-trained on a large number of labeled images from a different domain (a VGG model). Tan et al [167] and Song et al [168] developed CNN models to generate high spatiotemporal resolution images by fusing high-temporal, low-spatial resolution images and low-temporal, high-spatial resolution images. Their models are demonstrated using MODIS (low-spatial, high-temporal resolution) and Landsat Operational Land Imager (high-spatial, low-temporal resolution) data. In high-latitude regions, large fractions of snow-covered surface and frequent snowfall adversely affect the quality of precipitation products for those regions. Tang et al [169] trained a deep multilayer perceptron model to extract information from Global Precipitation Measurement Microwave Imager and MODIS channels to estimate high-latitude rain and snow. Fang et al [170] used a hybrid CNN and long short-term memory (LSTM) model (ConvLSTM) to extrapolate Soil Moisture Active Passive (SMAP) L3 soil moisture product with atmospheric forcings, model-simulated moisture, and static physiographic attributes as inputs. The impact of clouds on optical satellite imagery can be of major concern, especially in tropical locations and regions with variable topography. Zhang et al [171] proposed a CNN-based approach for thick cloud removal and demonstrated their method using Landsat Thematic Mapper images. Sun et al [172] applied DL and a land surface model to extend the terrestrial total water storage (TWS) data from the Gravity Recovery and Climate (GRACE) satellite mission, which was decommissioned in 2017. Because of missing processes or conceptualization errors, model-simulated TWS anomalies (TWSA) can be different from the GRACE-derived TWSA over many global river basins [173]. In their work, Sun et al [172] used CNN models to learn the spatiotemporal patterns of mismatch between model-simulated and GRACE-derived TWSA, so that the trained model can be used to predict the 'corrected' TWSA in the absence of GRACE data.
In many data-driven EWM applications, monitoring time series may exist only at monitoring locations and it is desirable to perform data infilling using auxiliary information. Traditionally, geostatistical regression methods have been extensively used for space infilling based on point measurements, but most methods assume Gaussian-like data distributions [174, 175]. As mentioned in the previous method reviews, many DL methods, especially the generative models, are designed to learn the salient features of arbitrary data distributions in a nonlinear and yet scalable way. Li et al [176] used DBN to extend the spatial coverage of PM2.5 (i.e. particulate matter with an aerodynamic diameter of 2.5 μm or less) monitoring networks by fusing nearby point observations (ground-level PM2.5 time series) and satellite data (e.g. satellite-derived aerosol optical depth, MODIS normalized difference vegetation index). Zhang et al [177] used a deep multilayer perceptron (MLP) model to upscale point measurements of soil moisture for croplands using Visible Infrared Imaging Radiometer Suite (VIIRS) raw data records consisting multiple moderate-resolution spectral bands and visible bands; the DL regression model was trained using labeled in situ measurements and VIIRS data.
4.2.3. Hybrid modeling and reduced-order modeling
A long held view of ML models is that they are black box models having no physical meanings and lacking the ability to deliver mechanistic explanations of the underlying physical processes. For this reason, the scientific community was and still is reluctant to accept black-box models, even though those models can achieve more accurate performance. Significant interests exist in developing human-interpretable ML models by combining ML and physics-based solutions, which can be particularly fruitful in the Big Data and DL era. Toward this goal, the theory-guided data science (TGDS) paradigm aims to introduce scientific consistency as an essential component for learning generalizable models [178]. TGDS attempts to infuse theories into data-driven models in two ways. First, TGDS attempts to learn dependencies that have a solid basis in physical principles and thus have a better chance to represent causative relationships; second, TGDS attempts to achieve better generalizability than purely data-driven models by learning models that are consistent with scientific principles. These hybrid models are referred to as the 'physically consistent' models [178].
A subarea of research of the TGDS is related to the development of reduced order models or surrogate models. The basic idea behind surrogate modeling is to find an alternative and yet, computationally efficient and accurate approximation of the input–output relations simulated in a (large-scale) dynamic model. Main requirements of surrogate modeling are to provide quantitatively accurate descriptions of the dynamics of systems at a computational cost much lower than the original model, and to provide a means by which system dynamics can be readily interpreted [179, 180]. Zhu and Zabaras [181] developed an end-to-end FCN model to capture the complex forward mapping between the high-dimensional input–output fields in a stochastic partial differential equation. Mo et al [182] developed a similar FCN model to learn the high-dimensional input–output relationship in a subsurface multiphase flow model by using paired permeability realizations and the corresponding system outputs for training. In Sun [183], a state-parameter identification GAN is formed to learn not only the forward mapping, but also the reverse mapping between high-dimensional model inputs and outputs. These end-to-end regression models work under the premise that a low-dimensional latent space exists and that the image-to-image GAN can learn this mapping implicitly. In the next steps, these DL-driven models need to have the ability to assimilate data so that they can be continuously updated when new information becomes available. In recent years, the notion of data space inversion (DSI) [184–186] has been introduced in subsurface modeling. The main purpose of DSI is to combine an uncertain numerical model with Monte Carlo sampling to establish a statistical relationship between the historical and forecast variables. This allows quantifying posterior uncertainty on the forecast variable without explicit inversion or history matching. Similarly, the DL-driven models can be applied as an ensemble in the DSI sense to quantify uncertainty, thus providing an alternative to the conventional data assimilation and uncertainty quantification procedures.
5. Conclusions and future directions
This review provides an evidence-based survey on applications of Big Data and machine learning (ML) in EWM, with an emphasis on deep learning (DL). EWM data exemplifies many V's of Big Data and calls for a broad set of Big Data analytics, from data virtualization, edge computing, low-latency data transmission to high-throughput, real-time processing. It is not exaggerating to say that the multidisciplinary EWM represents some of the most interesting and yet challenging use cases that are out there for Big Data and DL.
A wide range of applications are presented in the 1000+ papers surveyed for this review. The applications show that (a) Big Data will fundamentally change the way that EWM researchers are conceiving, conducting, and analyzing experiments; (b) the benefits of Big Data can only be maximized when appropriate automated data wrangling and cleansing are accessible with relatively low cost; (c) DL techniques have already demonstrated superior performance in solving a number of problems, especially in the areas of remote sensing image classification, high-dimensional spatial and temporal data fusion, and multisource data predictive analytics. Many of the studies call for a digital transformation within EWM, one where the researchers and institutions must continually re-invent themselves by adapting to disruptive changes like cloud computing and IoT. In turn, the multiplication of modalities and agencies of environmental sensing, the proliferation of new environmental governance actors, transparency in data collection, accessibility, and integration may create the conditions for potentially significant transformations in environmental governance [218].
The main roadblocks identified are (a) data cleansing challenge associated with unifying heterogeneous data sources and data streams arising from new IoT and sensing technologies, including autonomous data quality check; (b) lack of labeled datasets; (c) mismatch between data ingestion and data generation speeds; (d) lack of fundamental understanding of DL architectures and best practice guidance for algorithmic selection, training, and tuning; (e) lack of hybrid ML and physics-based approaches for developing human-interpretable solutions; (f) high costs associated with Big Data platforms; and last but not least, (g) lack of a data governance and sociotechnical infrastructures for engaging a wide range of stakeholders to improve data quality and democratize data assets in a socially justified manner. Regarding the last bullet, the future generation of Big Data solutions must be designed and produced by people who understand the problems and context, not just by those who understand the algorithms [115]. One potential way to achieve this is though fostering collaboration among data scientists, domain experts, governments, the public, and the private sectors. It is also critically important to train the next generation of EWM researchers to be more proficient in data science and to design semantically rich, reproducible data products from the ground up. As suggested by Vitolo et al [28], scientific data should be associated with provenance to aid interpretation and trust, and description of methods to support reproducibility.
The road toward Smart Data (the future of Big Data) will require a different scale of operation from that of the current, and one that is predicated on AI and automated execution. The potential reward associated with embracing Big Data and DL for EWM is also huge, considering the improved humanitarian effort in disaster relief due to better and faster information flow. Ultimately Big data and AI will become most valuable when it can improve causal inference and reasoning. For EWM, this means Big Data and DL will need to significantly improve situation awareness skills, leading to not only a better capability to predict short-term changes, but also a better understanding of the gradual changes that the Earth system is experiencing, in terms of environmental conditions and human pressure.
Acknowledgments
The authors were partially supported by funding from Jackson School of Geosciences, the University of Texas at Austin. The authors are grateful to Dr Michael Fienen and an anonymous reviewer for their constructive comments on the original manuscript.