

Abstract
Wetlands provide valuable ecosystem services and play a central role in global carbon cycling. Changes in rainfall and the flood-pulse are likely to disrupt the processes that maintain these landscapes; further, landscape modification may dramatically alter wetlands and promote terrestrialization. The Pantanal, South America, is the world's largest wetland due to flooding along the Upper Paraguay River. Predicting how water resources in the Pantanal may change is problematic due to a complex drainage network, resulting in the out-of-phase timing of rainfall and the flood pulse. We use remote sensing data of vegetation and climate to better understand the relationships among the rains, the flood pulse, and vegetation. Although rainfall is regionally synchronous, vegetation responses differ based on position relative to inundated areas. Away from rivers, vegetation greening occurs immediately following rainfall. Along channels, greening may lag rainfall by six months, responding closely to local flood stage. Interannual rainfall variability also impacts vegetation differently near flooded areas, with weaker, lagged responses to rainfall due to local water storage. This work suggests that the importance of flood pulse timing for vegetation productivity in inundated areas means that local conditions in wetlands may be the strongest controls on biogeochemical processes.
Export citation and abstract BibTeX RIS

Original content from this work may be used under the terms of the Creative Commons Attribution 3.0 licence. Any further distribution of this work must maintain attribution to the author(s) and the title of the work, journal citation and DOI.
1. Introduction
Wetlands are critical environments that provide ecosystem services valued at trillions of annually [1]. They help mitigate flood risk, provide key freshwater resources [2], and support many local and regional economies [3]. Further, wetlands play an essential role in nutrient cycling as well as in carbon sequestration, through the preservation of organic matter in waterlogged soils [2, 4].
The Pantanal of western Brazil is the largest wetland in the world, covering an area of over 130 000 km [2, 5]. Despite its immensity, the Pantanal remained relatively unknown due to harsh conditions in the Brazilian frontier until the twentieth century [6]. Early explorers discovered a rich, low-lying area which seasonally transformed into expansive flooded fluvial megafans connected by diverse riparian and lacustrine environments. The Pantanal houses an incredibly diverse flora and fauna, which includes unique and unusual species such as leopards, black caimans, and giant otters [7, 8]. Further, recent work has demonstrated that because of links to both regional and global hydrology and biogeochemistry, the Pantanal can accurately be described as one the most important wetlands in the world [9, 10].
In the Pantanal and many other wetlands worldwide, the threat of degradation from climate and land-use change has the potential to pose problems at a global scale. Rising temperatures and changes in rainfall can lead to alterations in hydrology within these ecosystems [4]. Further, intensification of land-use pressures can have a large impact on wetland geomorphology and ecology [9, 11]. For example, dam construction changes flow paths, discharge dynamics, river stage, and sediment transport [12–14]. Agriculture both within wetlands and in tributary drainages results in the deforestation, draining of waterlogged soils, and alterations in sediment yields while promoting the potential for nutrient and contaminant transport [15]. Further, large scale land-use change has altered ecohydrological dynamics [16] and compromised important wetland ecosystem services such as carrying capacity, nutrient retention, water availability and purification, resulting in decrease of resilience. Most importantly, Ramsar, UNESCO, and the intergovernmental panel on climate change (IPCC) have stated that the risk of terrestrialization may have significant impacts on carbon cycling and energy balance due to decreased storage and increased carbon emissions once waterlogged soils are exposed [1, 4].
Therefore, understanding and predicting how wetlands will change is crucial to both being able to properly manage them and as a significant way to regulate carbon emissions. However, hydrological dynamics within a wetland, particularly one the size of the Pantanal, are complicated due to a complex network of drainages where flood pulses through streams and rivers may lag climatological processes by many months [17]. Because of this, vegetation productivity throughout the system, which accounts for a large portion of the carbon inputs, may be also offset seasonally. Further, if vegetation responds differentially at the seasonal-scale to local hydrological conditions instead of regional climate, it is yet unclear if vegetation variability from year to year might be predicted by changes in climate or local conditions. Moreover, in a large and remote tropical system, such as the Pantanal, in situ measurements of vegetation responses seasonally or interannually are virtually unknown. Due to these challenges, recent studies have utilized spatially-explicit satellite data within the Pantanal at local-scales to note the disconnect between hydrology and climate locally [17, 18]. Here, we seek to consider the system as a whole by using coupled remotely-sensed vegetation (1 km 2000–2016 MODIS enhanced vegetation index—EVI) and climate data (Tropical Rainfall Measuring Mission—TRMM) with in situ streamflow data from river gauges to conduct spatial analysis. We quantitatively evaluate the link among vegetation, rainfall, and the flood pulse through a large tropical wetland system.
1.1. Modern setting
The Pantanal wetlands (16–20 °S, 55–58 °W; figure 1) occupy a low altitude (<200 m asl mean elevation) oval-shaped basin that sits within Brazil, Bolivia, and Paraguay [19]. The formation of the depression is linked to Andean tectonics and flooding within the basin covers a surface area exceeding 130 000 km [2, 20, 21]. Perhaps the most distinct aspect of the Pantanal is the seasonal flooding of the Upper Paraguay River, which flows along its westernmost margin. Austral summer rainfall in the highlands surrounding the Pantanal and the Upper Paraguay River drainage result in a slow-moving flood pulse which travels from north to south. Due to water retention through floodplain storage processes, inundation of central and southern Pantanal may occur several months after the peak in rainfall [17, 22, 23]. Additionally, numerous large rivers from the east enter the Pantanal, creating extensive fluvial megafans, eventually drain into the Paraguay River [24, 25]. Arrival of the flood pulse can result in a raising of the river stage in the main channel by more than 5 m over several months. This hydrological delay, largely associated with backwaters due to bottlenecks [19], is supported by a study showing that floodplain lake levels connected to the main channel track the timing of the flood pulse rather than rainfall [23].
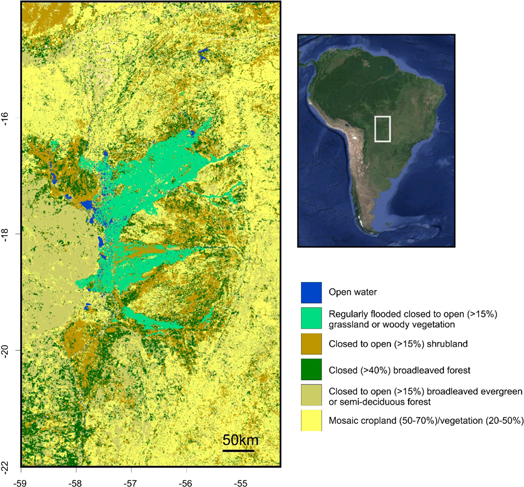
Figure 1. Map of landcover in the Pantanal [31]. Inset map is satellite image of South America showing the location of the Pantanal (grey rectangle).
Download figure:
Standard image High-resolution imageClimate within the Pantanal is strongly controlled by the Intertropical Convergence Zone (ITCZ), which results in austral summer rainfall (figure 2). Rainfall on average is 1000 mm yr−1. During the wet season, from October to April, low level convergence over southern South America associated with the ITCZ results in the advection of moist air masses via northwesterly winds derived from the Amazon Basin [10, 26, 27]. Rainfall variability is thought to have strong linkages to ENSO; however, recent studies have also pointed to the occurrence of quasi-periodic heavy rainfall events associated with the South American Convergence Zone (SACZ), which are driven by the southern Atlantic and the Madden–Julien Oscillation [26, 28, 29].

Figure 2. (a) Difference in EVI for the wet season (DJF) minus the dry season (JJA) illustrating variation in the timing of vegetation greening (dark green = strongly seasonal vegetation during DJF; white = no dominant seasonality; red = strongly seasonal vegetation during JJA). Red dots are the river gauging stations throughout the Pantanal. (b) Bar plots of monthly rainfall from climate stations near each river gauging station showing the synchronicity of the rainy season across stations.
Download figure:
Standard image High-resolution imageVegetation within the Pantanal is controlled by a complex pattern of climate, flood intensity, topography, and soil type (figure 1) [30, 31]. A mixture of cerrado (tropical savanna) and semi-deciduous forest are found away from rivers [32]. Dense, low-canopy riparian forests border the channels, and floodplains are dominated by aquatic plants and seasonally waterlogged woodlands and grassland [33]. The species composition of both these swampy forests and grasslands is variable with respect to flooding and therefore very sensitive to flood stage and timing [33].
2. Materials and methods
To look at the relationship between rainfall and vegetation throughout the Pantanal basin, we conducted spatial analyses using multiple datasets. We refer to analyses as 'seasonal' when the seasonal cycle is retained in the timeseries to evaluate relationships from month-to-month, and 'interannual' when the timeseries has been filtered to remove the seasonal cycle in order to evaluate relationships from year to year. To represent the seasonal and interannual vegetation, we created a timeseries of monthly 1 km 2000–2016 MODIS (MOD13A2) EVI data using the Application for Extracting and Exploring Analysis Ready Samples (AρρEEARS) for each grid cell within the Pantanal basin (14–22 °S; 54–59 °E).
Past studies in South America have used both EVI and the Normalized Vegetation Difference Index (NDVI) data to effectively capture seasonal and interannual vegetation [17, 34–37]. EVI and NDVI have been used to investigate climate-vegetation relationships within natural and agricultural landscapes in Mato Grasso and Amazon regions [36–40]. Within the Pantanal, most spatial analyses have either been local in scale [18, 41] or attempted to relate vegetation structure directly to climate without taking local conditions into account [35]. Here, we employ EVI as it performs well specifically in the Pantanal for capturing wet to dry season vegetation transitions [35]. Our EVI time series is thus a spatially explicit time series related to vegetation structure and phenological properties, such as greenness [42].
Rainfall data both from meteorological stations as well as from satellite-derived measures from the TRMM were used. Rainfall climatologies were extracted from ClimateExplorer (https://climexp.knmi.nl/start.cgi) for six meteorological stations nearest available flood stage gauging stations (figure 2). These stations were Cuiabá (15.60 °S, 56.10 °E), Cáceres (16.10 °S, 57.70 °E), an unnamed Bolivian station (17.83 °S, 60.75 °E), Corumbá (19.00 °S, 57.70 °E), Battia Negra (20.10 °S, 58.10 °E), and Puerto Sastre (22.03 °S, 58.03 °E).
Also, 0.25° resolution 2000–2016 TRMM (3B42, Version 7) was downloaded from NASA Earthdata [43]. To look at the dominant patterns of seasonal and interannual variability within the Pantanal, an empirical orthogonal function (EOF) was calculated using the monthly TRMM timeseries within the basin (14–22 °S; 54–59 °E). For the EOF of seasonal TRMM, the rainfall timeseries for each grid cell was first standardized prior to analysis. For interannual TRMM, the rainfall timeseries for each grid cell was filtered to remove the seasonal cycle then standardized.
River stage data from the six stations in figure 2 were obtained from the Brazilian National from Water Agency, or ANA (http://3.ana.gov.br/ANA-EN), along a north-south transect from Cuiabá (15.62 °S, 56.10 °E), Cáceres (16.08 °S, 57.70 °E), Bela Vista do Norte (17.64 °S, 57.69 °E), Ladário (19.00 °S, 57.60 °E), Forte Coimbra (19.92 °S, −57.79 °E), and Porto Murtinho (21.70 °S, 57.89 °E) (figure 3). Measurements were obtained from 2004 to 2016, as no data exists before 2004, except for at Bela Vista do Norte where measurements began in 2008. Peak analysis was conducted for each site to determine the day of year when highest levels are reached.
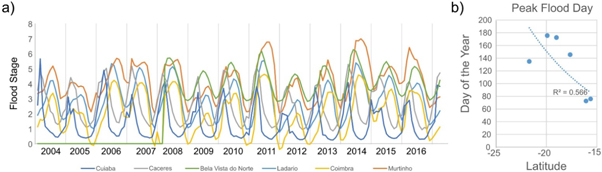
Figure 3. (a) River stage timeseries from 2004 to 2016 from 6 stations within the Pantanal. (b) correlation of average day of the year when peak flooding occurs and latitude of gauging station.
Download figure:
Standard image High-resolution imageTo investigate the relationship between the seasonal timing of rainfall/flood pulse and vegetation productivity, spatial correlation analysis was conducted through pointwise correlation of the seasonal EVI fields and the EOF1 timeseries of seasonal TRMM or the monthly timeseries of river stage from each gauging station. To investigate the possibility that the vegetation response may lag the peak in rainfall, lagged correlations of 1 to 6 months (EVI lagging TRMM) were also conducted. All timeseries were standardized, and summary plots display the resulting correlation coefficient (figure 4) or, for the lagged correlation, the number of months lag that resulted in maximum correlation between EVI and TRMM and the corresponding maximum correlation coefficient (figure 5). In order to look at the relationship between interannual variability of rainfall and vegetation productivity, a spatial correlation analysis was conducted through pointwise correlation of the interannual EVI and interannual EOF1 timeseries. For all correlations, a significance threshold for correlation coefficients (p < 0.05) is marked on the legend.

Figure 4. (a) First Empirical Orthogonal Function (EOF1) of 2000–2016 seasonal TRMM within the Pantanal correlated with 2000–2016 fields of seasonal Enhanced Vegetation Index (EVI). (b)–(g) seasonal river stage for all gauging stations correlated with 2000–2016 fields of seasonal EVI. A significance threshold for correlation coefficients is R > 0.14 and R<−0.14 for TRMM x EVI and R > 0.16 and R<−0.16 for stage x EVI.
Download figure:
Standard image High-resolution image
Figure 5. (a) Number of months lag resulting in the maximum correlation coefficient when 2000–2016 seasonal EVI is correlated with and lags 2000–2016 seasonal EOF1 of TRMM, (b) maximum correlation coefficient for the lag presented in part (a). A significance threshold for correlation coefficients is R > 0.14 for TRMM x EVI.
Download figure:
Standard image High-resolution image3. Results
The EOF analysis of seasonal TRMM resulted in only one significant EOF explaining 76.6% of the total variance. EOF1 shows strong positive correlation of the timing of seasonal rainfall throughout the entire basin (figure S3 is available online at stacks.iop.org/ERL/14/124017/mmedia). The EOF1 timeseries furthermore shows a single peak in rainfall from December through March (figure S4). This indication of strong synchronicity of rainfall basin-wide is supported by the rainfall from the meteorological stations (figure 2).
The EOF analysis of interannual TRMM within the Pantanal resulted in two significant EOFs explaining a total of 61.1% of the variance. The EOF1 pattern explains 47.5% of the total variance and shows high correlation of rainfall variability basin-wide (figure S3). The EOF1 timeseries is characterized by positive rainfall anomalies predominantly in October, December, and April, suggesting that wet years have increased rainfall during the beginning and ending of the rainy season (figure S4). The interannual EOF2 pattern explains 13.6% of the total variance but is not used for the rest of these analyses.
Peak analysis for the river stage timeseries for all six gauging stations identified the day of the year that maximum level within the channel was reached (figure 3). From north to south, peak river stage occurred at Cuiabá at 75.8 d (March 17), Cáceres at 72.5 d (March 14), Bela Vista do Norte at 145.5 d (May 26), Ladário at 172.4 (June 21), Forte Coimbra at 175.5 d (June 24), and Porto Murtinho at 134.9 d (May 14). Further, latitude of the gauging stations and peak river stage produce a significant negative correlation (R2 = 0.566; p = 0.0422; figure 3(b)). This suggests that a more southerly position is linked to later peak flood, with latitude explaining 56.6% of the variance in the timing of flood pulse.
When the seasonal EOF1 of TRMM is correlated with EVI, significant positive correlations (R > 0.14) occur widely throughout the basin (figure 4(a)). The resulting pattern, however, is strongly related to basin geomorphology, as the only exception is near river channels where correlation coefficients are not significant or show significant negative correlations (R < −0.14). This suggests that the seasonal relationships between rainfall and vegetation productivity are dependent on channel position. Correlations of the monthly river stage timeseries with EVI show significant positive correlations region throughout the region for only the northerly stations (Cuiabá, Cáceres; figures 4(b), (c)). This resulting spatial pattern is similar to that of seasonal EOF1 of TRMM, with non-significant correlations only proximal to channels. In contrast, correlation of monthly river stage timeseries from the central and southern Pantanal differ (figures 4(d)–(g)). Bela Vista do Norte, the northernmost station in the central Pantanal, shows significant positive correlations in areas nearest the station and along adjacent megafan lobes, however, non-significant correlation coefficients are produced in much of the basin. The remaining stations (Ladário, Forte Coimbra, Porto Murtinho) show a pattern with significant positive correlations restricted only to proximal channel environments.
To evaluate possible lags between the seasonal timing of rainfall and EVI, we also conducted lagged correlations with the seasonal EVI fields lagging seasonal EOF1 of TRMM by 1–6 months. Figure 5 shows both the maximum correlation coefficient produced with a lag of 1–6 months and month in which such a maximum correlation occurs. Maximum correlation between seasonal EVI appears to lag EOF1 of TRMM in much of the basin; however, in areas proximal to the river channels lags are considerably longer (1–2 months distal to rivers; 5–6 months along rivers). Further, the maximum correlation coefficient follows that same pattern with high positive significant correlations only in areas away from the river channels. This suggests regional rainfall and vegetation productivity are out of phase.
When the interannual EOF1 of TRMM is correlated with EVI, significant positive correlations occur throughout the basin; however, the areas nearest river channels show no significant correlation between rainfall and EVI (figure 6(a)). The interannual EOF1 of TRMM correlated with TRMM fields for all tropical South America show strong significant positive correlations along a broad northwest to southeasterly path crossing the Pantanal (figure 6(b)). Finally, correlation of the interannual EOF1 of TRMM with EVI improves for most areas of the Pantanal when EVI lags rainfall by up to 60 months (5 years; figure 7). In particular, areas associated with streams and waterlogged vegetation show a maximum positive correlation with longer lags (>24 months).

Figure 6. (a) First Empirical Orthogonal Function (EOF1) of 2000–2016 interannual TRMM within the Pantanal correlated with 2000–2016 fields of interannual Enhanced Vegetation Index (EVI), (b) EOF1 of interannual TRMM within the Pantanal correlated with 2000–2016 fields of interannual TRMM from all of tropical South America. A significance threshold for correlation coefficients is R > 0.14 and R<−0.14.
Download figure:
Standard image High-resolution image
Figure 7. (a) Number of months lag resulting in the maximum correlation coefficient when 2000–2016 interannual EVI is correlated with and lags 2000–2016 interannaul EOF1 of TRMM, (b) maximum correlation coefficient for the lag presented in part (a). A significance threshold for correlation coefficients is R > 0.14 and R<−0.14 for TRMM x EVI.
Download figure:
Standard image High-resolution image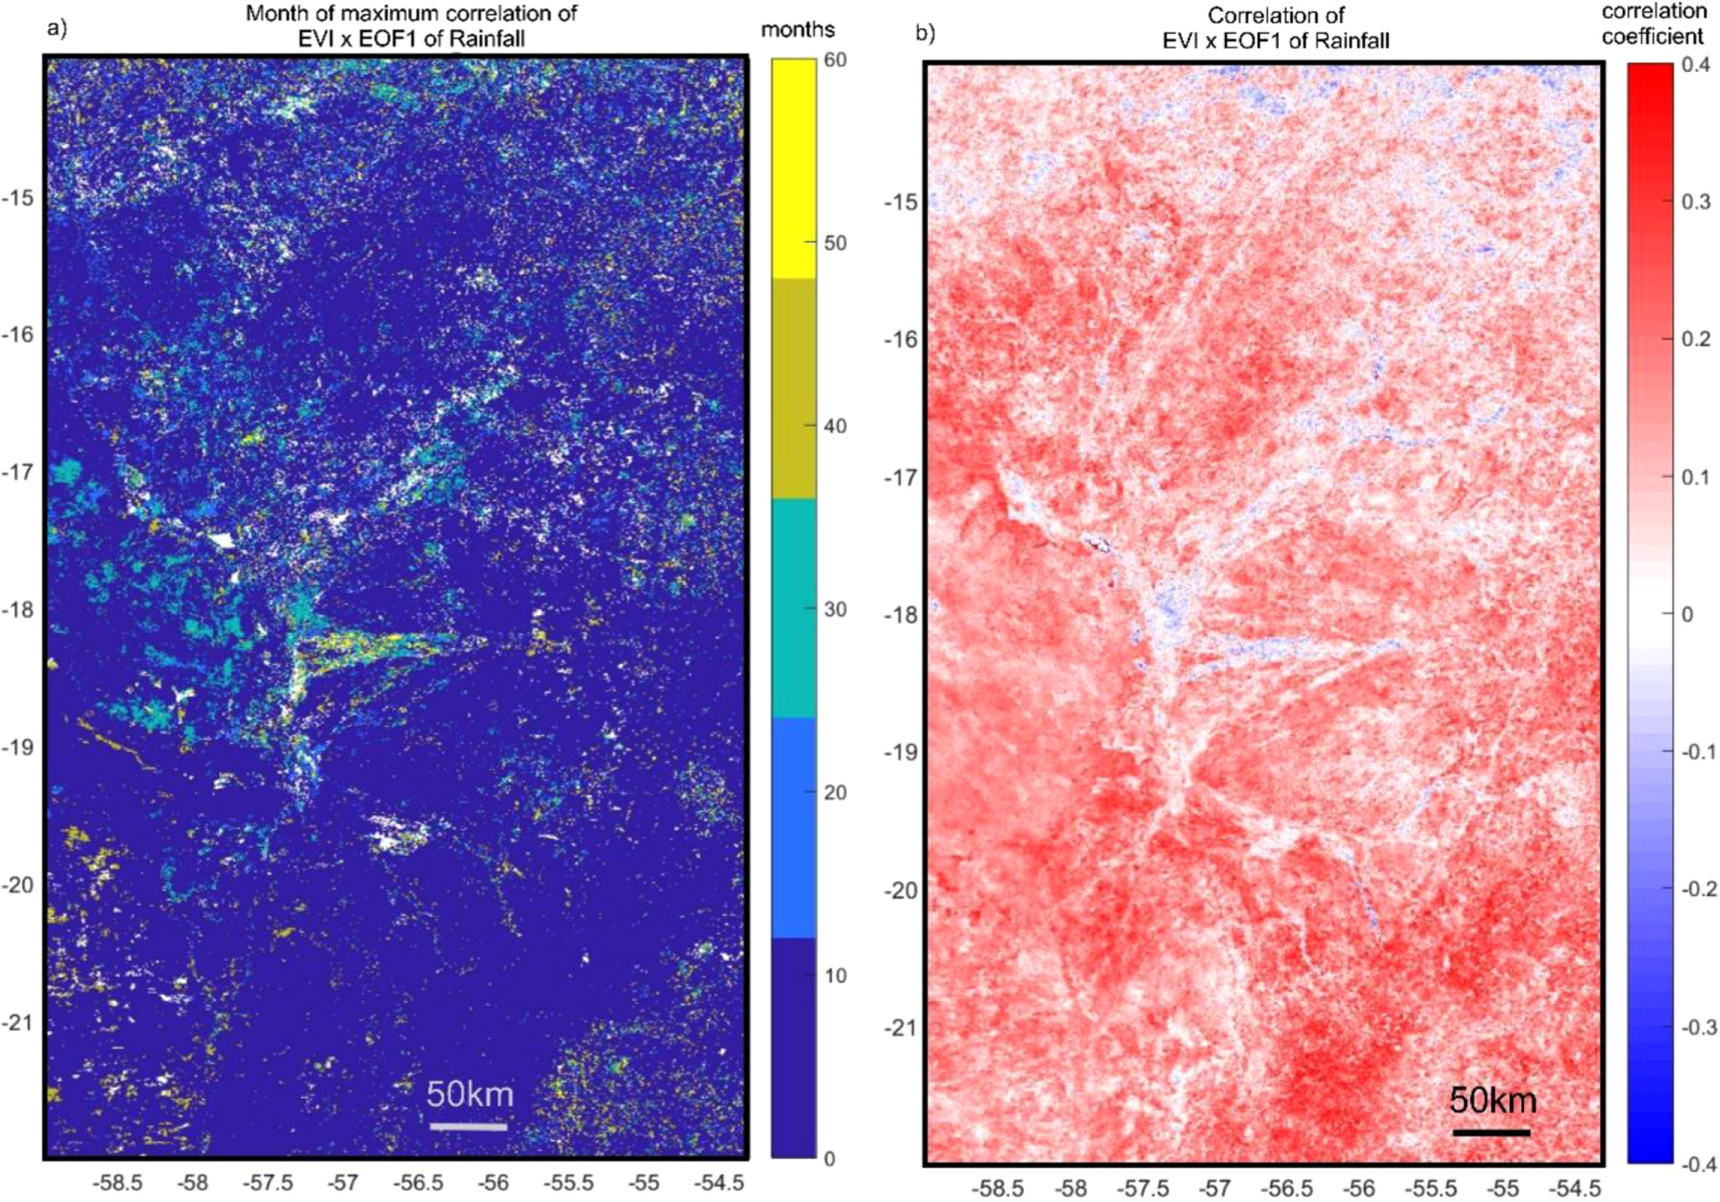
4. Discussion
The seasonal pattern of vegetation productivity in the Pantanal is heterogeneous and quite complex in its relationship to regional climate. Rainfall climatologies from meteorological stations show that the seasonal rainfall timing is synchronized (figure 2). Although the in situ rainfall observations are sparse, satellite-derived TRMM rainfall observations agree with station data (figure S3). In fact, EOF1 of seasonal TRMM suggests that 76.6% of the variance in the dataset is related to a strongly unimodal pattern with rainfall occurring throughout the basin primarily in November–March (figure S4).
Yet despite the synchronous rainfall, the seasonal cycle of vegetation is partially decoupled from this signal. In areas away from floodplains, seasonal vegetation and rainfall yield strong significant positive correlations within the same month (figure 4(a)). This suggests that in terrestrial areas, deciduous and annual vegetation responds quickly to rainfall, with greater vegetation density immediately following the rains. This is not true in the flooded areas. In these areas, correlations between rainfall and EVI are non-significant or result in significant negative correlations, suggesting that vegetation phasing differs. This is supported by de Souza et al [44] who identified a six month lag in the response of vegetation along the floodplain in certain subregions of the Pantanal. This suggests that rainfall is not a good predictor of local vegetation structure in areas that flood seasonally.
In contrast, seasonal river stages show little significant correlation to vegetation at a broad regional scale. However, immediately adjacent to individual gauging stations, the timing of flood pulse passage yields a much stronger positive correlation to local vegetation than does rainfall (figure 4). This behavior does vary throughout the basin. For example, there is a marked difference in the response of vegetation in flooded areas in the northern versus central and southern Pantanal. In the central and southern basin, the vegetation response is delayed until after the rains only near the river channels.
This delay is likely related to position along a channel that undergoes a time-transgressive flood pulse. In the north, proximity to upland drainages results in almost immediate flooding following the rains [17]. Therefore, the vegetation response both along channels and away from channels is synchronous. Storage capacity within channels, in the floodplain and its lakes, and in the waterlogged backwaters must first exceed its limits for the flood pulse southward to initiate. This means that flooding along the main channel is routinely delayed by many months in the southernmost reaches of the Upper Paraguay River within the Pantanal [17, 22].
In the Pantanal, differences in the type of vegetation and landcover may result in a strong dependence on either climate or local conditions. In southern Brazil, deciduous forests and woodlands dominate [32]. Those type of dry season tolerant vegetation are specifically adapted to thrive under strongly seasonal rainfall [32, 34]. The dominance of dry-season deciduous trees implies a strong coupling to rainfall as it constitutes the most important phenological control on growth [35]. Thus, it is not surprising that vegetation occurring away from easy access to water shows a seasonal pace that is synchronized closely with the arrival of regional rainfall.
Vegetation near rivers and waterlogged areas covers a significant but lesser total land area (37%) but also comprise different types of plants [31, 32]. These areas are a complicated mosaic of riparian forest interfingered with hydromorphic vegetation, such as swamps and seasonally-inundated grasslands (figure 1) [31, 32]. Rather than being adapted to seasonal moisture deprivation, these plants are adapted to very different physiological constraints. For semi-deciduous riparian forests, the need for increased water use efficiency, such as is required in tropical dry forest, is no longer advantageous. Instead, position with respect to the channel for acquiring moisture is balanced with sensitivity to oxygen deprivation during flooding [33]. Thus, trees typical of moist tropical forests, such as Inga vera, are common [45]. Further, swampy grasslands demonstrate another adaptation that confers an advantage in a seasonally inundated landscape. These plants, which have a shorter life cycle often have species-specific timing to seed germination and non-vegetative reproduction which allows them to reach maturity at a moment when flood tolerance is optimal [46].
Even when lagged responses are considered, the maximum correlation of EVI with rainfall along rivers is generally lower than in seasonally dry areas (figure 5). This is likely related to the filtered effect of basin storage capacity on the signal of rainfall. Although rainfall seasonality results in the initial buildup of water in parts of the basin, it is overflow of water storage, which integrates numerous years worth of rainfall that ultimately initiates the flood pulse [18]. Thus, the rainfall signal is filtered over time and space by local conditions.
We investigate the interannual EVI timeseries to look at how variability is related to larger-scale phenomena. Mirroring the seasonal pattern, interannual rainfall variability results in significant positive correlation with anomalies in vegetation in much of the basin except along floodplains (figure 6). In these areas, aquatic vegetation shows either no significant or negative correlation with rainfall anomalies. This suggests that the interannual variability of terrestrial vegetation is strongly dependent on the magnitude of summer rainfall. Although seasonal rainfall timing is connected to the ITCZ, the interannual EOF1 of TRMM suggests that rainfall variability may derive from a more southerly source. Further, the EOF1 timeseries suggests that anomalies occur in the later months of the year (figure 6). The correlation pattern revealed by figure 7(b) resembles that of de Oliveira Vieira et al [27], which attributed this pattern to variability of sea surface temperatures in the southern Atlantic and MJO which drive a SACZ.
Near the channels, the lack of correlation between EVI and TRMM suggests that positive [negative] anomalies in rainfall do not result in a corresponding increase [decrease] in vegetation density. Further, we suggest that vegetation responses along channels and in floodplains may lag climatic variability by significant periods of time due to storage within local catchments. This idea is supported by the pattern resulting from lagged correlations of the interannual EOF1 of TRMM and EVI, showing that maximum positive anomalies in vegetation occur as much as 5 years (60 months) following large positive anomalies in rainfall (figure 7). Thus instead, we suggest that seasonal greening is more directly related to flood pulse timing, and that interannual controls on the variability of the magnitude and duration of the flood pulse are likely the primary driver of floodplain vegetation.
This agrees with other studies which show that storage time in different regions of the basin vary based on geomorphology, soil type, and upland drainage. Clarke [47] demonstrated that carryover effects due to water storage resulted in a muting of the clear climatic relationship of rainfall variability and ENSO within the Pantanal. Penatti et al [17] who compared basin-scale time series of EVI, rainfall, and water storage, also noted the lagged relationship between rainfall and vegetation; however, they found a strong relationship between variability of rainfall and vegetation. We suggest that the scale of the analysis, which treated vegetation through time as a mean value for the whole basin rather than our point-to-point correlation approach, lacked the spatial resolution to capture the difference in vegetation responses on the floodplain. Further, another study evaluating EVI responses suggested that vegetation on sandy soils may be particularly drought prone, that responses to floods versus rains varies based on soil type [34]. This results in a yearly flood pulse whose magnitude varies not just on the magnitude of rainfall in the most recent rainy season, but also those preceding.
5. Conclusions
This work shows that within the Pantanal differences in position relative to flooded areas determines linkages to large-scale climatic or local geomorphic drivers of vegetation. We find that, although flooded vegetation varies greatly in structure and composition, adaptations which link those types of vegetation to waterways decouples the strong dry-season dependence which is common in rain-fed dry forests. Therefore, to understand vegetation dynamics, particularly of the marginal vegetation in a large wetland, understanding the timing and controls of the flood pulse and how it propagates through a system is integrally important.
We suggest that local conditions that control flood stage may be the best predictors of seasonal vegetation productivity in wetlands. As the world's floodplains are the most biologically productive ecosystem on Earth and provide important ecosystem services, wetland loss via climatic or anthropogenic alteration has important implications [48, 49]. If geomorphology is essential for controlling the size and timing of the flood pulse, changes due to human modification in the future will have immediate effects. For example, deforestation in the Pantanal itself has been steadily increasing but has been minimal in comparison to surrounding regions (12%) [15]. However, as many of the rivers which feed the Pantanal receive water from uplands whose rate of deforestation is much higher (59%), changes in overland flow and runoff could alter the hydrodynamics of the basin [9, 15]. Further, although damming along the Upper Paraguay and other rivers until now has been minimal, new constructions have the potential to alter nutrient cycling, sedimentation processes downstream, and the flood pulse. Although the effect of damming on flood timing and magnitude is complex, has been little studied in this region, and depends on dam design, the diversion of water by dams is already causing hydrological changes in other regions [50, 51]. Vegetation along channels is important for channel stabilization and providing freshwater resources for local populations[9]. Recent work also suggests that floating macrophyte expansion creates soil the eventually may support riparian woodland communities and thus feeds back on regional geomorphological processes [52]. As the lifecycles and growth rate of many of these plants depend implicitly on flood timing [11], changes to channels may alter landscape stability [46] and diminish the basin's freshwater carrying capacity [9].
Globally, wetlands are known for their importance as potential carbon sinks due to organic matter accumulations in anoxic, waterlogged soils [2, 4]. However, they are also particularly vulnerable to alteration. For example, degradation can lead to terrestrialization, which can turn into potential carbon emissions [4]. Recent work examining climate model projections within the Pantanal suggest a 5 °C–7 °C increase in temperature and a 30% reduction in rainfall under RCP8.5 [36]. We suggest differing environmental responses may occur to regional vegetation. For example, the strong relationship between rainfall and vegetation in much of the basin suggests that deciduous forests may be particularly rapidly impacted. In contrast, although riparian forests and swamp vegetation show a stronger relationship to flood pulse magnitude than rainfall, these communities are also likely to be severely impacted by future climate change. For example, as flood magnitude is an aggregate of multiple years of rainfall with carryover effects [32], decreased rainfall and increased evapotranspiration from higher temperatures may result in a slower decline in water storage and flood level through time. This could lead to terrestrialization and have dramatic effects on vegetation that is adapted to the presence of permanent water or flood timing.
Thoughtful management of wetlands, particularly one as expansive as the Pantanal, is required. Predicting carbon dynamics requires a good understanding of organic matter inputs in the waterlogged areas exclusively. If rainfall is not strongly related to vegetation in these areas, but rather streamflow, then models built to more strongly reflect local hydrogeomorphic drivers are essential.
Acknowledgments
Funding for this project came from the National Geographic Society (9797-15) and the US National Science Foundation (1541247), and partial funding by Embrapa grant number 03.17.00.047. Also, we thank the Fundação de Apoio ao Desenvolvimento do Ensino, Ciência e Tecnologia do Estado de Mato Grosso do Sul (FUNDECT − 083/2016), the Universidade Federal de Mato Grosso do Sul - Campus do Pantanal (UFMS/CPAN) for institutional support and the National Council of Technological and Scientific Development – CNPq (431253/2018-8).
Author contributions
Conceptual development – SI, MM, SS, AS, IB. Analysis – SI. Manuscript development – SI, MM, SS, AS, IB.
Data contribution–SS
None of the authors have any competing interests. The data that support the findings of this study are openly available.