

Abstract
Rapid climate change in Arctic regions is linked to the expansion of woody taxa (shrubification), and an increase in biomass as tundra becomes greener. Reindeer and caribou (Rangifer tarandus) are considered able to suppress vegetative greening through grazing and trampling. Quantifying reindeer use of different land cover types can help us understand their impact on the growth and recruitment of deciduous shrubs, many of which serve as fodder (e.g. Salix spp.), in favourable habitats, such as naturally denuded landslides in permafrost areas. Understanding the spatial distribution of reindeer pressure on vegetation is important to project future patterns of greening, albedo, snow capture, active layer development, and the overall resilience of tundra rangelands under ongoing climate change. Here we quantify reindeer habitat use within the low Arctic tundra zone of Yamal, West Siberia estimated from pellet-group counts, and also how active layer thickness (ALT) relates to reindeer use. Our results confirm intensive use by reindeer of terrain with high June-July time integrated normalised difference vegetation index, steeper slopes, ridges, upper slopes and valleys, and a preference for low erect shrub tundra. These sites also seem to have a shallower ALT compared to sites less used by reindeer, although we did not find any direct relationship between ALT and reindeer use. Low use of tall Salix habitats indicated that reindeer are unlikely to suppress the growth of already tall-erect woody taxa, while they exert maximum pressure in areas where shrubs are already low in stature, e.g. ridgetops. Reindeer ability to suppress the regrowth and expansion of woody taxa in landslide areas (i.e. concavities) seems limited, as these types were less used. Our results suggest that reindeer use of the landscape and hence their effects on the landscape correlates with the landscape structure. Future research is needed to evaluate the role and efficiency of reindeer as ecosystem engineers capable of mediating the effects of climate change.
Export citation and abstract BibTeX RIS

Original content from this work may be used under the terms of the Creative Commons Attribution 4.0 license. Any further distribution of this work must maintain attribution to the author(s) and the title of the work, journal citation and DOI.
1. Introduction
In the circumpolar North, temperatures have increased an average of 2 °C over the past 30 years (NASA-GISS n.d., Post et al 2019). Trees and shrubs are expanding (Harsch et al 2009) increasing their height and productivity (Forbes et al 2010, Macias-Fauria et al 2012, Bjorkman et al 2018). Within the low arctic, tundra has become greener in many, but not all regions (Xu et al 2013, Myers-Smith et al 2015, 2020). The ability of reindeer and caribou (Rangifer tarandus sp.) to regulate this shrubification process through foraging and trampling has been demonstrated in some tundra regions (den Herder et al 2004, Post and Pedersen 2008, Olofsson et al 2009, Kolari et al 2019, Sundqvist et al 2019). Rangifer tarandus as a species inhabiting the circumpolar North may suppress woody taxa in favour of grazing lawns (Normand et al 2017, Egelkraut et al 2018a). However, grazing pressure may differ significantly between continents, regions within continents (Horstkotte et al 2017, Forbes et al 2020), localities within the same region (Moen et al 2009), and temporally as forage greens-up (Aikens et al 2017, Rivrud et al 2018). While we have detailed knowledge of how reindeer may supress woody taxa in local experimental sites (den Herder et al 2004, Olofsson 2006, Kitti et al 2008, Kaarlejärvi 2014, Sundqvist et al 2019), there are few studies of animal use of different vegetation types at the landscape scale that can shed light on their potential to supress Arctic vegetative greening (Macias-Fauria et al 2012, Bernes et al 2015).
As a migratory species, reindeer are generalist feeders, being able to utilize the most nutritious and readily digestible fresh forage plants in summer, while lichens usually dominate the diet in winter (Iversen et al 2014, Åhman and White 2018). Reindeer choices when searching for forage plants at the small scale may be constrained by non-interactive factors or herder's decisions at the larger scale (Skarin and Åhman 2014). Thus, the ability to exploit the 'right' forage resources from a climate impacts mediating perspective, i.e. suppressing the growth of plants involved in the greening of the tundra, may be constrained or facilitated by both landscape topography (cf Nellemann and Cameron 1996) and herders' decisions (Istomin and Dwyer 2010). In addition, grazing alone might not be enough to supress growth of woody taxa, as trampling and intense use of the grazing ground are sometimes necessary for suppression (Forbes and Kumpula 2009). Knowledge of Rangifer habitat use during the snow-free season is well-established (e.g. Rettie and Messier 2000, Skarin et al 2010, Iversen et al 2014, Panzacchi et al 2015) and could potentially inform modelling of woody taxa growth in a climate change scenario (Yu et al 2011, 2017). Still, we lack quantification of habitat use among intensively herded reindeer. In the Yamal region, Nenets herders have a nomadic herding system with unfenced pastures, organizing their spatial and temporal use of the common grazing resources constantly watching the herd (Stammler 2005, Forbes 2013) and thus offer a good opportunity to supress shrub growth (Yu et al 2011). In the Yamal-Nenets social-ecological system, the number of private herded reindeer increased significantly after the Soviet Union's collapse in 1991 (Forbes et al 2009). At that time, the estimated population of privately-owned reindeer was 250 000, and in 2010 the number was at least 350 000, while the number of state-owned reindeer had decreased (Klokov 2013). There is now a critical need for knowledge about rangeland use in areas with increasing numbers of privately-owned reindeer. Smaller private herds are usually more stationary and migrate shorter distances, trying to find 'pockets' of free grazing areas not used by the brigades or large private herds migrating across long distances on the Yamal Peninsula (Stammler 2005). Although systems may differ, reindeer are expected to use areas with high productivity to cover their nutritional needs and build up their energy reserves for the winter (Åhman and White 2018), and to use wind-exposed sites to avoid insect harassment during summer (Downes et al 1986, Skarin et al 2010).
Climate change influences permafrost thermal regimes and dynamics (Loranty et al 2018), which in turn alters conditions for both vegetation and reindeer. Deeper permafrost thaw during the growing season due to Arctic warming may increase the risk of landslides (mainly active layer detachments and retrogressive thaw slumps), which expose bare soil and, on the Yamal Peninsula, nutrients held in the saline clay substrates (Ukraintseva et al 2003). In these concave landslide terrains, the snow accumulates in the winter keeping the soil temperatures warm (Stieglitz et al 2003). A shallower active layer is however expected in summer in this terrain if covered by an insulating vegetative layer (Loranty et al 2018). Soil temperatures are cooler on ridges and shoulders where the snow cover is shallow in winter. Moreover, on vegetated terrain, Beest et al( 2016) show that if reindeer are allowed to maintain low shrub stature, summer albedo increases, which in turn has a cooling effect on the ground surface and near sub-surface layer. Thawing of permafrost also facilitates the growth of taller shrubs (Myers-Smith et al 2015), which may be less palatable (Thompson and Barboza 2014, Christie et al 2015) and more difficult to reach for reindeer to forage on and therefore supress, limiting their ability to promote low shrub stature or vegetation cover change into graminoids (Egelkraut et al 2018a).
On the Central Yamal Peninsula, the landscape is characterised by a mosaic of landslides of different ages, with revegetated landslides that have been dated within a range of 300–2000 years old (Leibman et al 2003). In the late 1980's, a large number (ca. 400) of landslides occurred in the Bovanenkovo region (Leibman and Egorov 1996). Regrowth of willows in these landslides seems strong after a few years and is suspected to be little suppressed by reindeer foraging (Walker et al 2009, Verdonen et al 2020), despite the fact that the exposed mineral soil in the landslides could be attractive for reindeer (Åhman and White 2018). Intense use of denuded land could also favour deeper thawing of the permafrost, as land would stay denuded for a longer period of time compared to undisturbed regrowth. In this scenario, a local, landscape-scale understanding of reindeer habitat use and permafrost conditions is of importance.
Quantifying reindeer use of different land cover types and productivity in relation to landscape topography can help us understand reindeer impact on the growth of woody taxa (e.g. Salix spp.) and their recruitment in naturally denuded landslides. This is important in order to project future patterns of greening, albedo, snow capture, and the overall resilience of tundra rangelands under further predicted climate change (Post et al 2019, Meredith et al 2019). The primary aim of this study was to quantify reindeer habitat use at the landscape scale in relation to arctic tundra land cover types (including landslide-affected areas, and shrub-cover structure), productivity and topography in summer rangelands with intensively herded reindeer. The second aim was to evaluate how variability in active layer thickness (ALT; seasonally thawing and freezing layer above permafrost) relates to land cover type and productivity, solar radiation (albedo), topography and reindeer habitat use. To estimate reindeer general habitat selection, we related counts of reindeer pellet-groups (Skarin 2007, Skarin and Alam 2017) to topography, land cover class, productivity and deciduous shrub (Salix lanata and Betula nana) height in an area of the Yamal Peninsula where a massive landslide event occurred in 1989. We measured the thaw depth to evaluate the relationship between the ALT, land cover type, productivity and ground surface albedo, topography, and reindeer habitat use. We expected reindeer to select ridge-top habitats, graminoid rich vegetation, and dry low erect shrub tundra present at these ridges in preference to landslide concavities characterized by tall erect shrubs, as these areas provide less insect relief. We expected ALT to be negatively related to ground surface albedo and productivity, and to be deeper in denuded landslide areas relative to land cover types with closed vegetation.
2. Material and methods
2.1. Study area
The study was conducted in a 30 km2 area in the Yamal Peninsula (70°11'N, 68°33'E), 20 km south from Bovanenkovo gas field along the Mordy-Yakha river (figure 1). Situated at the centre of the Yamal Peninsula in bioclimatic subzone D (Walker et al 2009), the area consists of a tundra landscape with hillocks and ridges. These are characterized by low erect shrub-moss tundra interspersed with shallow concave valleys comprising of dense Salix spp. vegetation, and flat valley bottoms with mires or lakes (figure 2). In addition, the area contains numerous landslides, whereof 48 from a massive landslide event after a wet year, warm summer and heavy rains in August 1989. They typically originate at the edge of the ridges stretching down towards the valley-bottoms, 25–500 m in width and 200–1300 m in length. Smaller retrogressive thaw slumps (<0.5 ha) are also common in the study site (Verdonen et al 2020). The landslides have been reported to lead to a succession of vegetation types starting with the growth of halophytic graminoids and bryophytes on the bare, saline clay, succeeded by a dominance of willows after 15–20 years (Khitun et al 2015).

Figure 1. Map over the study area by the Mordy-Yakha River at Yamal Peninsula in Yamal Nenets Autonomous Okrug, including the pellet-group counts plots, known reindeer herding camp sites, used during the study years (2013–2017), and land cover classes according to Landsat 7 and with landslides types classified from WorldView-3 imagery.
Download figure:
Standard image High-resolution image
Figure 2. Above: Overview of one of the ridges in the Mordy-Yakha study area, picturing a landscape that is flat at the top and is surrounded by landslides in all directions. In a landslide event in 1989, tall Salix thickets next to the ridge partly remained undisturbed and partly were moved, scattered and packed along the slopes. Herders favour ridges as campsites as they are windier and have less insects. Below: Flat terrain with tall Salix at the foot of the slopes, mires, lakes and river systems dominate the lowlands. In the middle of the picture a reindeer herd is grazing on mires around a small lake. Further away at a ridge is the campsite of the herders. (Phantom 3 Drone images 17.7.2017, Pasi Korpelainen).
Download figure:
Standard image High-resolution imageAt our study site, Nenets reindeer herding families managing privately-owned reindeer herds migrate through the area in summer and pitch their campsites on the ridge-tops. Apart from utilising the area for reindeer grazing herders use woody taxa for fire wood, and fish from lakes and rivers for their own consumption. Seven to ten families and 1500–3000 reindeer use the area each summer, spending about 1–3 weeks in one of the camp locations. Length of stay depends on availability of reindeer forage, fish in the lakes and fire wood.
2.2. Pellet-group counts
To measure reindeer habitat selection, we counted reindeer pellet groups via a point transect survey design (Buckland et al 2001) using faecal accumulation rate techniques (Campbell et al 2004, Skarin 2007). In 2013 (4–8 July), 312 predefined plots were positioned and marked. Old and fresh pellets were counted and then the plots were cleaned. We revisited 269 and 238 of the established plots and counted and cleaned all new pellet-groups from the plots in 2014 (11–18 July) and 2017 (21–31 July), respectively. In 2014 and 2017, 44 and 34 new plots were established, respectively, when old plots were not found providing a total of 322 plots where pellets were counted at least one time (figure A1). Each plot had a size of 15 m2( radius = 2.18 m). The distance between each transect was 300 m, and the distance between each plot on each transect was 200 m. To be counted, the centre of the pellet group had to be inside the plot. As an animal might move as it defecates, the pellets may be spread over a range of 0–100 m. Therefore, a cluster of 20 or more pellets defined a pellet group. If the pellets were evenly spread over the plot, we counted the separate pellets. As reindeer pellet-groups have been estimated to contain 127 (±7) separate pellets (Skarin 2007), 20–146 pellets represented one pellet-group, and 147–273 pellets represented two pellet-groups, and so forth.
2.3. Habitat variables
Habitat variables known or suspected to be important predictors of reindeer habitat selection (Skarin 2007, Forbes and Stammler 2009) and ALT (Loranty et al 2018), respectively, were included in our assessment. At each plot, the prevailing land cover type was characterized according a predefined classification with 16 classes (whereof 13 were found), later merged into five classes: low erect shrub tundra, Carex-Salix-Betula, tall Salix, landslide (with graminoids and/or Salix) and mires (see appendix and table A1). In 2014 and 2017, when present, the maximum shrub height of Betula nana or Salix lanata was measured for the individual(s) closest to the centre of each plot. The ALT was measured using a 1 m long metal probe in the centre of 117 and 119 plots, respectively. To save time in the field, fewer mire plots where inventoried in 2017, as pellet-groups generally disappear within less than one year in wet habitats and the counts will therefore not be comparable with the counts in the dryer land cover types to the same extent (Skarin 2008).
Surface albedo for the two years and a time integrated normalised difference vegetation index (TI-NDVI) from 2017 were estimated from Landsat 8 OLI scenes. The TI-NDVI orthomosaic of the study area was derived from nine cloud-free Landsat 8 Surface Reflectance Tier 1 scenes spanning 05 June 2017 until 23 July 2017 by first calculating NDVI for each scene using ArcMap's image analysis toolkit and then by summing all positive NDVI for each 30 m-pixel across all scenes using the raster calculator (ArcMap 10.5, ESRI, Inc. USA). This high-frequency coverage of Landsat 8 was possible due to overlapping Landsat acquisition paths. The periods prior to and after this window had significant cloud contamination, but the analysed date range spans the snow-on to green-up period and is most representative of the time window when reindeer are present and interacting with the environment (up until the timing of when pellet counts were gathered). TI-NDVI integrates NDVI, a widely used proxy of vegetation productivity (Berner et al 2018), across a pre-defined season to capture collective measures of phenology and productivity (Bhatt et al 2017), in this case during the time-of year when reindeer use the site. This integrates measure of forage phenology and productivity on a similar time scale and spatial grain as our response variable. For surface albedo estimation, Landsat 8 scenes from 22 July 2014 and 21 July 2017 were used. Albedo is a measure of solar energy reflected back to the atmosphere, where an albedo of one is total reflectance back to the atmosphere, and zero equates to total absorption to the ground. Surface albedo (α) was calculated using equation (1), in accordance with Bastiaanssen (1998):
where αtoa is the reflectance at the top of the atmosphere i.e. albedo without any atmospheric correction, calculated using reflective bands 1–7 of Landsat OLI following Waters et al( 2002); αatm is the average fraction of the incoming solar radiation across all bands that is backscattered by the atmosphere to the satellite (a value 0.03 was used as recommended by Waters et al( 2002)); τsw2 is two-way atmospheric transmissivity, calculated according to Allen et al( 2007). A digital elevation model (DEM) was obtained from the Arctic DEM project with a resolution of 2 m (Porter et al 2018). A vector ruggedness measure (VRM), as described by Sappington et al( 2007) with a 7 × 7, 15 × 15, 31 × 31 and 61 × 61 neighbourhoods, was calculated. The most appropriate neighbourhood was evaluated in the model selection procedure, as this may differ depending on species and study system. Furthermore, a terrain positioning index (TPI) with five available classes (ridge, upper slope, lower slope, flat area and valley) was defined (De Reu et al 2013) using a 151 m radius where the elevation of each cell in the DEM was compared to the mean elevation of the neighbouring cells, capturing the approximate size of the main ridges and valleys in the area. Positive values represented locations higher than their surroundings (ridge), negative values represented locations lower than their surroundings (valley), and values near zero were flat areas. Slope (in radians) and aspect (divided into four classes: north, east, south and west, each class 90° wide) were also calculated from the DEM. All digital geographic layers were then resampled to 30 m resolution using nearest neighbourhood. The resolution of 30 m was used in the assessment of pellet-group counts and, when available, the 2 m resolution was used in the assessment of the ALT.
Daily temperature and precipitation data used in the analysis were obtained from the nearest weather station, Marre-Sale, located on the coast of the Kara Sea 80 km south-west from the study area. Data were downloaded from the National Climatic Data Center's Daily Summaries (https://www.ncdc.noaa.gov/cdo-web). We calculated the sum of precipitation (mm) from 1 June and the thaw degree days (TDD; sum of positive daily temperatures (°C)) until the measurement day of ALT in 2014 and 2017.
All variables were screened for collinearity using variance inflation factors (VIF; Zuur et al 2010), with VIF ≥ 3.0 as a threshold for removing a variable. Collinearity was also assessed using Pearson correlation, with r ≥ 0.7 as a threshold for removing a variable.
2.4. Statistical analysis
To asses reindeer habitat selection, pellet abundance from re-inventoried plots (i.e. 2013 and newer plots only counted once was excluded from analysis as age of pellet-group could differ among land cover classes, (Skarin 2008)) were related to land cover class, TI-NDVI, shrub height, elevation, VRM, TPI, slope, aspect, and year of inventory in a Poisson regression analysis treating the pellet-group counts as a count variable. Initial analyses showed that, within each year, >55% of the plots had zero counts. To handle excessive zero counts and possible spatial dependence in reindeer habitat use in the outcome variable (Lee et al 2016), we fitted a spatial Poisson hierarchical generalized linear model (HGLM; Lee and Nelder 1996) using the R-package hglm( Alam et al 2015), since high spatial correlation can explain excess zeros. We modelled spatial correlation using simultaneously autoregressive (SAR) random effects or conditional autoregressive (CAR) random effects and selected the most parsimonious model using the conditional Akaike-value (cAIC). We assessed ALT in a similar setting, but fitted a Gaussian family HGLM as these were continuous scale measurements and close to Gaussian distribution. Independent variables used in the assessment of ALT were TDD for the day of the year (DOY), sum of precipitation from 1 June for DOY, land cover, shrub height, TI-NDVI, albedo, VRM, elevation, slope, and pellet-group abundance. To allow the models to converge and avoid large estimates of the coefficients, we standardised elevation, VRM, slope, TI-NDVI, albedo and TDD (by shifting the centre to their means and scaling with the respective standard deviation).
3. Results
In the re-inventoried plots, the land cover types Carex-Salix-Betula and tall Salix dominated, while mires, landslides, and low erect shrub tundra occurred in lower proportions (table 1). However, the overall distribution of pellet-groups was almost reversed compared to the distribution of land cover types, with highest mean number of pellets/15 m2 in low erect shrub tundra and the fewest pellet-groups found in mires and tall Salix. Comparison of pellet-group counts and shrub type (independent of the land cover classification) present in the plot shows the highest abundance in plots with only Betula nana( mean no. of pellet-groups 2.5 ± 2.2 (±SD)) and lower abundance in plots with a mix of Betula nana and Salix lanata( 1.2 ± 1.7) and only Salix lanata( 0.69 ± 1.2). The maximum TI-NDVI value was found in low erect shrub tundra (2.60), while the minimum value (0.71) was found in mires. In mires we found the largest variation of TI-NDVI-values; mire parts that are very wet had lower TI-NDVI (0.71) and parts with dense sedge and grass coverage had rather high values (2.14).
Table 1. Distribution of habitat variables in percent or ranges with median values in parentheses within pellet-group inventory plots counted in July 2014 and 2017 in the Mordy-Yakha region. All remote sensing based habitat variables presented from the 30 m resolution.
| Variable | Percent or ranges (median) N = 505 | PG | Mean shrub height ± SD (cm) N = 505 | Mean ALT | Primary data source |
|---|---|---|---|---|---|
| Land cover type |
|||||
| Low erect shrub tundra | 11.2 | 2.7 ± 2.1 | 14 ± 9 | 41 ± 20 | Field note/ Landsat 2011 |
| Carex-Salix-Betula | 36.7 | 0.9 ± 1.5 | 27 ± 11 | 39 ± 23 | |
| Tall Salix | 30.0 | 0.6 ± 1.1 | 79 ± 27 | 40 ± 21 | |
| Mire |
12.2 | 0.4 ± 0.9 | 14 ± 19 | 27 ± 19 | |
| Landslide | 9.9 | 0.9 ± 1.4 | 27 ± 18 | 60 ± 21 | |
| Terrain positioning index | |||||
| Ridge | 14.3 | 2.0 ± 2.1 | 24 ± 22 | 42 ± 20 | ADEM |
| Upper slope | 10.5 | 1.4 ± 1.8 | 39 ± 29 | 29 ± 18 | |
| Lower slope | 12.5 | 0.59 ± 1.0 | 62 ± 41 | 52 ± 25 | |
| Flat area | 48.5 | 0.67 ± 1.3 | 40 ± 28 | 37 ± 21 | |
| Valley | 14.3 | 1.1 ± 1.4 | 37 ± 38 | 51 ± 24 | |
| Shrub height (cm) | 0–170 (30) | Field note | |||
| TI-NDVI |
0.71–2.60 (1.75) | Landsat 8 | |||
| Albedo | 0.17–0.24 (0.21) | Landsat 8 | |||
| Elevation (m) | 1–51 (21) | ADEM | |||
| VRM |
0.0012–0.013 (0.0024) | ADEM | |||
| VRM (15 × 15) | 0.0013–0.012 (0.0026) | ADEM | |||
| VRM (31 × 31) | 0.0015–0.0091 (0.0027) | ADEM | |||
| VRM (61 × 61) | 0.0017–0.0074 (0.0029) | ADEM |
aPG—Pellet group. bALT—Active layer thickness. cLand cover types reclassified from the 16 classes used when classifying the land cover type in the field see table A1 in appendix. dMire plots decreased from 15.6% in 2014 to 8.4% in 2017. eADEM—Arctic digital elevation model. fTI-NDVI—Time integrated normalised difference vegetation index. gVRM—Vector ruggedness measure.
The mean ALT was 25 ± 17 cm in 2014 and 49 ± 22 cm in 2017. The deepest active layer was found in denuded landslides, and the shallowest active layer was found in mires. On six occasions, the ALT was over 100 cm, however in our model estimations we allowed these to be 100 cm.
Among the habitat variables, the VIF indicated multicollinearity for land cover (VIF = 7.3) and shrub height (VIF = 3.2). However, including either land cover or shrub height in the VIF estimation decreased VIF (VIF = 2.7 and 1.2, respectively), otherwise VIF did not show any apparent multicollinearity. Slope and VRM (30 m resolution) were positively correlated (r = 0.76). Therefore, either land cover or shrub height and either slope or VRM, respectively, were included in the model selection procedure for predicting pellet abundance (table A2). Temperature and precipitation were negatively correlated (r = − 0.93), hence either land cover or shrub height and either temperature or precipitation was included in the model selection for predicting ALT (table A3). Two values from the pellet-group count data and one value from the ALT-data were removed due to extremely high VRM-values (>0.05).
Variables identified in the most parsimonious model of pellet-group abundance included land cover, elevation, slope, TPI and TI-NDVI, along with a Gaussian CAR distribution of the spatial random effects (table A2). The model output suggested non-linear relationships for the continuous variables (figure 3), however residual plots did not reveal any obvious non-linear trends. Assuming that the pellet-group counts represent reindeer habitat use, results showed that reindeer selected low erect shrub tundra type over all other land cover types (table 2). Mires and tall Salix habitats were the least selected habitats followed by Carex-Salix-Betula and landslides habitats, respectively. There was also an indication of increased reindeer use with TI-NDVI: an increase of TI-NDVI by one SD (0.033 units) was modelled to increase reindeer use by 27%. Topography was an important predictor of habitat selection, as valleys, upper slopes, and also ridges, were used more compared to flat areas and lower slopes. In addition, increasing slope with one SD (0.017 radians or one degree) implied an increase of 38% in reindeer use, if everything else were held constant.
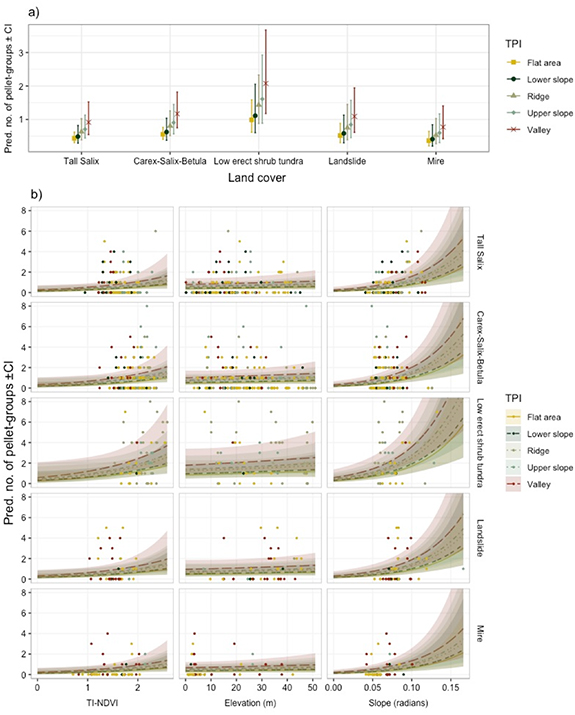
Figure 3. (a) Marginal probability plots of predicted counts of reindeer pellet-groups within each land cover type (tall Salix shrub tundra, low erect shrub tundra, mires, Carex-Salix-Betula tundra, landslide areas) in relation to terrain positioning index (TPI) classes (flat area, valley, lower slope, upper slope and ridge), and (b) predicted pellet-group counts (lines ± SE) and real data (dots) in relation to time integrated normalised difference vegetation index (TI-NDVI), elevation (m) and slope (radians) within each land cover and TPI class, respectively, within the Mordy-Yakha study area.
Download figure:
Standard image High-resolution imageTable 2. The regression estimates of the most parsimonious model of pellet-groups counts per plot fitted with a Poisson model with Gaussian CAR random effects.
| Parameter | Estimates | SE | P-value |
|---|---|---|---|
| (Intercept) |
−0.83 | 0.18 | <0.001 |
| TI-NDVI |
0.24 | 0.11 | 0.026 |
| Elevation (m) | 0.09 | 0.09 | 0.303 |
| Slope (radians) | 0.32 | 0.07 | <0.001 |
| Mire | −0.17 | 0.31 | 0.583 |
| Low erect shrub tundra | 0.82 | 0.28 | 0.004 |
| Carex-Salix-Betula | 0.25 | 0.22 | 0.256 |
| Landslide | 0.18 | 0.29 | 0.547 |
| TPI |
0.74 | 0.23 | 0.002 |
| TPI—lower slope | 0.12 | 0.26 | 0.652 |
| TPI—upper slope | 0.49 | 0.24 | 0.040 |
| TPI—ridge | 0.37 | 0.22 | 0.097 |
aAll continuous values were scaled. bTall Salix and flat areas was set as reference levels for the categorical variables. cTI-NDVI—Time integreated normalised difference vegetation index. dTPI—terrain positioning index.
The most parsimonious model predicting ALT included TDD, TI-NDVI, albedo, VRM (61 × 61) and land cover, we also allowed for an interaction between albedo and land cover to account for albedo variation between land cover types (table A3). A Gaussian SAR-distribution of the random effects was used to consider spatial correlation. Our results indicated that ALT increased with summer temperature, and terrain ruggedness, while it decreased with TI-NDVI (table 3). For example, increasing the TDD by one SD (96 °C) was modelled to increase ALT by ∼12 cm (approximately, hereafter indicated with '∼'); increasing VRM with one SD (0.001 units) implied an increase in ALT of ∼5 cm; and increasing TI-NDVI by one SD (0.035 units) decreased the ALT by ∼7 cm. In mires, the ALT was shallower compared to all other land cover types. It was also deepest in landslides. Within low erect tundra an increase of albedo by one SD (0.01 units) implied a modelled decrease of the ALT by ∼2 cm, while for the other land cover types the ALT was indifferent and increased with albedo (figure 4).
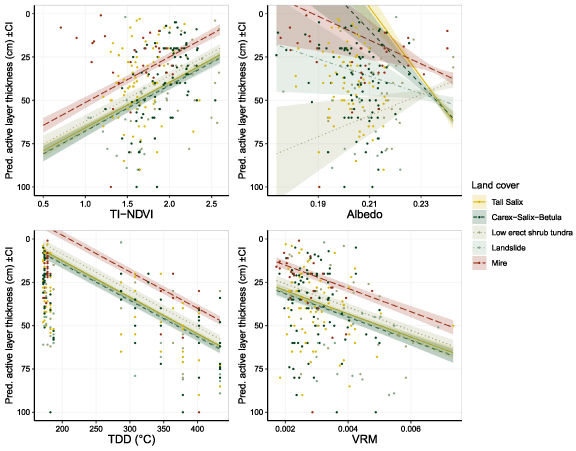
Figure 4. Marginal probability plots of predicted (lines ± SE) and real data (dots) active layer thickness (ALT) within each land cover type (tall Salix shrub tundra, low erect shrub tundra, mires, Carex-Salix-Betula tundra, landslide areas) in relation to (a) TI-NDVI, (b) albedo (in interaction with land cover type), (c) thaw degree days (TDD) for the day of inventory, and (d) vector ruggedness measure (VRM), within the Mordy-Yakha study area.
Download figure:
Standard image High-resolution imageTable 3. Regression estimates of active layer (cm) measurement fitted with a linear mixed model with Gaussian SAR random effects.
| Parameter | Estimate | SE | P-value |
|---|---|---|---|
| (Intercept) |
40.69 | 2.29 | <0.001 |
| TDD |
12.30 | 0.81 | <0.001 |
| TI-NDVI |
−7.24 | 1.34 | <0.001 |
| Albedo | 6.58 | 2.69 | 0.016 |
| VRM |
5.06 | 1.17 | <0.001 |
| Mire | −10.31 | 3.46 | 0.003 |
| Low erect shrub tundra | 4.72 | 4.48 | 0.293 |
| Carex-Salix-Betula | 3.34 | 2.79 | 0.233 |
| Landslide | 6.42 | 4.28 | 0.136 |
| Mire: Albedo | −4.33 | 3.16 | 0.172 |
| Low erect shrub tundra: Albedo | −8.57 | 4.05 | 0.036 |
| Carex-Betula-Salix: Albedo | −1.48 | 3.33 | 0.658 |
| Landslide: Albedo | −4.95 | 4.13 | 0.233 |
aAll continuous values were scaled. bTall Salix and flat areas was set as reference levels for the categorical variables. cTDD—Thaw degree days. dTI-NDVI—Time integreated normalised difference vegetation index. eVRM—Vector ruggedness measure.
4. Discussion
The prevailing low topographic relief of Yamal Peninsula supports tundra vegetation types for which reindeer—at least during the snow-free season—have access to nutrient-rich forage along both ridge-tops and in the low-lying flood plains (Walker et al 2009). Our analysis indicated that the reindeer selected habitats with higher productivity across the green-up period (high TI-NDVI), presumably while integrating quality and quantity trade-offs during foraging (Aikens et al 2017, Van Moorter et al 2013). Reindeer use of habitats was also found to be negatively correlated with the height of woody taxa, and positively correlated with elevation, as the animals preferred low erect shrub tundra typically present along the ridge-tops and upper-slopes relative, for example, to lower-lying tall Salix and Carex-Salix-Betula tundra. The high use of upper slopes and ridges is most likely explained by the reindeer need for wind-exposed sites at the ridge-tops during summer, providing insect relief to the reindeer (Downes et al 1986, Stammler 2005, Skarin et al 2010). These ridges are most often used as campsites (figure 1) and migration routes by the Nenets herders (Stammler 2005, Kumpula et al 2010), as they provide an elevated view of the surrounding landscape and provide insect relief also to reindeer herds and herders alike. Thus, the high abundance of reindeer pellets on upper slopes and ridge tops was most likely a combination of use for both insect-relief and rest and rumination in close proximity to the campsites, as the reindeer regularly come back with the herder when the herders exchange shifts while watching the reindeer (Stammler 2005). The Yamal tundra offers a landscape where reindeer can easily move from reduced insect ridges (at 50 m above sea level) down to low-lying and nutrient-rich vegetation types (Walker et al 2009). This maximizes time and energy efficiency for both the reindeer and the herder, and they can quickly adapt to weather changes, compared with the longer movement reindeer need to do in more mountainous regions in order to find insect relief during periods of severe harassment (Skarin et al 2010). This might be one of the key issues why reindeer herding is so successful in the Yamal Peninsula and allowed the number of reindeer to increase during the last decades (Klokov 2013).
Tall Salix was the least preferred land cover type. During a herder's shift, reindeer are moved away from the campsite walking around the campsites in successive counter clockwise circles up to a couple of kilometres away from the camp (Stammler 2005). Then lower terrain with tall Salix may well be used, especially during cooler (<6°) and/or windier weather when insects are less severe (Mörschel and Klein 1997, Mörschel 1999). Herders have observed that tall shrubs are not used as forage, instead reindeer graze the graminoids and herbs underneath (pers comm private herder #1, 2015-07). Apart from being out of reach for the reindeer, tannins and phenols in late season Salix shrubs probably make them less palatable (Thompson and Barboza 2014, Christie et al 2015). Nonetheless, the low preference for tall shrub thickets confirms earlier qualitative observations that reindeer do not use, or the reindeer herders keep the reindeer away from dense patches of copse to avoid losing reindeer in the tall shrubs during a time when they are moving camp daily (Forbes and Stammler 2009). Reindeer density in both Fennoscandia and Yamal is high compared to other regions in the world (Forbes and Kumpula 2009). Comparing the habitat use in Mordy-Yakha region with similar records from two Sami reindeer herding ranges in Sweden where reindeer are more freely moving in summer the use seems higher, as amounts of pellets per plot is higher (∼8 pellets m−2 in Mordy-Yakha region to compare with ∼4–6 pellets m−2 in Sweden (Skarin 2007)). In their 24 h shift, Nenets herders have good opportunity to control the reindeers' movements on a very fine scale. Nonetheless, herders spend limited time in each camp site and their decision to move on is linked to avoid over-exploitation of the natural resources, such as fresh fodder for the reindeer, fire wood, and fish and fresh-water for their own consumption. Overall this indicates that, in Yamal and at least in this region, the reindeer potential of supressing tall shrubs seems to be at the upper limit of what is possible, if we refer to the fairly high reindeer density in the region.
Graminoid meadows are often created in large herbivore rangelands as a consequence of the high use of the areas when fertilisation by animals' faeces is easily extracted and utilised by grasses, sedges and herbs (Coughenour 1985, Bråthen et al 2007, Ringmark et al 2019). The high-use of ridge-tops might have stimulated the creation of, or at least maintained, the nutrient-rich graminoid-dominated patches of low erect shrub tundra by attracting the reindeer (Van Der Wal and Brooker 2004, Egelkraut et al 2018b). This phenomenon has frequently been observed in reindeer rangelands and may serve as a tool to preserve the upper layers of permafrost from thawing, as forbs and graminoids dry the soils and capture carbon to deeper depths through their long roots and have a high albedo which protects the active layer from heating in summer (Beest et al 2016). At ridge-tops with low erect shrubs snow is also shallower in winter, thereby enhancing refreezing of the active layer. Thus, the relatively high-density reindeer rangeland use in this region has perhaps stimulated the creation and maintenance of these nutritious-rich foodscapes needed to build up the energy reserves of reindeer for the coming winter.
The typical tundra landscape in the Mordy-Yakha region, with clay-dominated soil overlain with sand in many places, may change rapidly due to (occasionally massive) landslide events in the concave fluvial valleys. Landslides remove the top layers of vegetation, organic matter and sand, exposing the underlying saline clay and provide suitable substrates on which new willows can establish and grow (Ukraintseva et al 2003, Walker et al 2009, Khitun et al 2015, Verdonen et al 2020). The question still remains whether or not reindeer actually supress regrowth of otherwise erect woody taxa. We did not find any dominance of pellet abundance in landslides, yet they were more used than tall Salix habitats, even though TI-NDVI was lower in the landslides compared to tall Salix. Nenets herders also describe these landslides as important during hot weather with little or no wind, resulting in severe insect harassment (pers comm private reindeer herder #2 2017-07) and they have also observed reindeer licking the soil and puddles in these habitats to obtain salt (pers comm private reindeer herder #1 2015-07). Although reindeer seemed to use the landslides regularly, this did not seem to strongly affect the shrub growth. The mean shrub height was still higher in landslides compared to low erect shrub tundra (table 1).
The ALT increased significantly between the two measurement years, most likely explained by the cool summer temperatures in 2014 and the heat wave in 2017 and also by a slightly later start of the measurements in 2017. In landslide areas we would expect a deeper active layer compared to vegetated habitats (Schuur et al 2015). In the Mordy-Yakha region, the active layer was deepest in landslides and shallowest in mires, followed by low erect shrub tundra, Carex-Salix-Betula, and tall Salix. The vegetative layer isolated the ground and kept a lower soil temperature in summer, but with taller shrub height ALT seemed to increase, probably as an effect of a thicker isolating snow-layer in winter (Loranty et al 2018, Frost et al 2018). We found no direct relationship between ALT and reindeer pellet abundance. Reindeer preferred steeper terrain, i.e. more rugged habitats, which was also positively correlated with ALT. However, there was also a clear negative relationship between TI-NDVI and ALT. Indicating that preferred habitats of reindeer (low erect shrub tundra and high TI-NDVI) correlated with shallow ALT. Reindeer use of mires (shallow ALT) was also most likely underestimated (Skarin 2008), showing a lower use of mires than expected.
Vegetation canopy shades the ground in summer and thereby isolates the permafrost from thawing, we thus expect shallower ALT to be associated with a high surface albedo as this would reduce heating of the ground (Loranty et al 2018). However, apart from a negative relationship between ALT and albedo in low erect shrub tundra, ALT surprisingly increased with surface albedo. The landslides (where ALT was deepest) had similar mean albedo as both Carex-Salix-Betula and tall Salix. This high albedo might depend on the light colour of the dry sandy and clay top soil in the landslides (Khitun et al 2015), but the cooling effect of high albedo is counteracted by lack of insulating organic layer.
5. Conclusion
In conclusion, reindeer use of the undulating but generally low-lying tundra landscape seems mainly related to forage quantity and quality tradeoffs with a clear preference for specific landforms, such as ridge-tops, which also provide the most insect relief. The use of tall Salix areas is generally lower than that of other habitats. Nenets' use of these summer rangelands provides little opportunity for reindeer to suppress erect woody taxa as they grow taller under a warming climate. Although, these are not unused habitats, raised habitats with low erect shrubs are more attractive and may therefore continue to be supressed by reindeer through trampling and grazing. The ability of reindeer to supress the regrowth of woody taxa in landslides also seems limited as these were less used. It is important to consider that our measurement of reindeer use was relative. Thus, the intensity of rangeland use within the different land cover types was most likely relatively high also within our classifications 'low-use' land cover types, if compared to use in other arctic tundra regions. Our results agree with the view that reindeer may counteract the effect of albedo feedbacks relevant to climate (cf Meredith et al 2019) through their continuous exploitation of habitats with high integrated seasonal productivity. These sites also seem to have a shallower active layer compared to sites less used by reindeer. However, their spatial pattern of intra- and inter-seasonal rangeland use results in that sizable concave areas—such as those created by cryogenic landslides—experience a lower grazing and trampling pressure, which appears inadequate to supress the growth and expansion of tall shrubs. Future research needs to disentangle the effect of grazing and trampling from the effect of landscape structure on the growth and regrowth of shrubs in the tundra by directly measuring the impact of reindeer use on vegetation.
Acknowledgments
We thank Victor Slodkevich, Marina Khrisanova, Yann Buhot, Pasi Korpelainen, Anton Kuzmin and Hannes Skarin for assistance in the field. This study was funded by Academy of Finland Decisions no. 256991, no. 330319, JPI Climate no. 291581, European Commission RIA #869471 and National Aeronautics and Space Administration (NASA Grant Nos. NNG6GE00A, NNX09AK56G and NNX14AD90G). MM-F acknowledges support from the United Kingdom National Environmental Research Council (grant NE/L011859/1). JK was also supported by the European Union's Horizon 2020 research and innovation programme under the Marie Skłodowska-Curie grant agreement No 754513, The Aarhus University Research Foundation, and by a grant from the National Geographic Society (CP-061R-17). Support from the Department of Animal Nutrition and Management at Swedish University of Agricultural Sciences is gratefully acknowledged.
Data availability statement
The data that support the findings of this study are available upon reasonable request from the authors.
: Appendix
Appendix. Land cover type classification
Land cover type within the 322 pellet-group count plots was first classified into 16 classes (whereof 13 were found) in each year of inventory (table A1). In 2017, each plot was photographed to allow for a posterior comparison of classifications between plots, as they might differ depending on person doing the classification. Reclassification was based on the 13 field classes, photos, shrub height measurement in 2014 and 2017, and landcover classification using maximum likelihood classifier from Landsat 7 TM satellite imagery from 2011 with 30 m resolution, updated with information of landslides from Very High-Resolution WorldView-3 image from 21 July 2017. The plots were reclassified into five classes. The field class 3 (Betula nana and/or Salix sp. dwarf shrub-moss hillock or spotty-hillock tundra) was classified into low erect shrub tundra if the shrub height in the plot was <50 cm in both 2014 and 2017, otherwise it was classified into Carex-Salix-Betula.

Figure A1. Plots inventoried in 2014 and 2017 including the pellet-group counts plot showing (a) and (b) the magnitude of pellet-groups found, and (c) and (d) active layer thickness at each plot.
Download figure:
Standard image High-resolution image
Table A1. Land cover type classes in the field and merged classes used in analysis.
| New class | Old class from field classification | No. of plots in each class |
|---|---|---|
| Low erect shrub tundra (<45 cm shrub height) | 1. Low erect shrub tundra moss dominated (Grasses sedges, Vacccc vitis, Ledum) | 15 |
| 2. Low erect tundra lichen dominated with moss dry habitat (Empetrum, Vacc vitis, Ledum, Betula nana) | 5 | |
| 3. Betula nana and/or Salix sp. dwarf shrub-moss hillock or spotty-hillock tundras | 17 | |
| Carex-Salix-Betula( 10–60 cm shrub height) | 3. Betula nana and/or Salix sp. low erect shrub-moss hillock or spotty-hillock tundras | 46 |
| 4. Salix-grass-moss tundra | 41 | |
| 5. Grass moss swamp with sphagnum hillock, Salix and Betula | 23 | |
| 16. Reindeer herder's migration route | 2 | |
| Tall Salix | 6. Tall Salix with grass-moss ground vegetation | 83 |
| (33–170 cm shrub height)a | 7. Tall Salix( flood plain) sedge-moss | 10 |
| Landslide | 14 a. Landslide with >50% bare soil | 3 |
| 14 b. Landslide with <50% bare soil | 25 | |
| Mire | 8. Grass and hypnum moss homogenous fens | 5 |
| 9. Sedge-Sphagnum moss dominated—peatland with or without hillock | 7 | |
| 10. Cotton grass-sedge-sphagnum bogs, sometimes with willow | 40 |
aShrub height was >50 cm during at least one of the two years (2014 and 2017) when measurements were performed.
Table A2. Candidate models in model selection process for the pellets.
| Candidate model | Conditional AIC-value | cAIC | SAR or CAR | |
|---|---|---|---|---|
| M01 | Null model | 1257.542 | 43.85 | SAR |
| M02 | Null model | 1256.338 | 42.65 | CAR |
| M1 | Year | 1258.239 | 44.55 | CAR |
| M2 | Land cover | 1239.052 | 25.36 | CAR |
| M3 | Shrub height | 1252.816 | 39.12 | CAR |
| M4 | Land cover + ADEMa | 1238.412 | 24.72 | CAR |
| M5 | Land cover + ADEM + TI-NDVIb | 1238.101 | 24.41 | CAR |
| M6 | Land cover + ADEM + TI-NDVI + TPIc | 1227.781 | 14.09 | CAR |
| M7 | Land cover + ADEM + TI-NDVI + TPI + VRM7d | 1220.579 | 6.89 | CAR |
| M8 | Land cover + ADEM + TI-NDVI + TPI + VRM15 | 1220.145 | 6.45 | CAR |
| M9 | Land cover + ADEM + TI-NDVI + TPI + VRM31 | 1220.617 | 6.92 | CAR |
| M10 | Land cover + ADEM + TI-NDVI + TPI + VRM61 | 1225.486 | 11.79 | CAR |
| M11 | Land cover + ADEM + TI-NDVI + TPI + VRM15 + Aspect | 1221.887 | 8.19 | CAR |
| M12 | Land cover + ADEM + TI-NDVI + TPI + Slope | 1213.693 | 0.00 | CAR |
aADEM—Arctic digital elevation model. bTI-NDVI—Time integrated normalised difference vegetation index. cTPI—terrain positioning index. dVRM7—vector ruggedness measure with the number representing the given neighbourhood in the calculation of the measure.
Table A3. Candidate models in model selection for active layer thickness.
| Candidate model | Conditional AIC-value | cAIC | SAR or CAR | |
|---|---|---|---|---|
| M01 | Null model | 2070.558 | 228.05 | SAR |
| M02 | Null model | 2068.768 | 226.26 | CAR |
| M1 | TDDa | 1867.431 | 24.93 | SAR |
| M2 | Precipitation | 1902.723 | 60.22 | SAR |
| M3 | DOYb | 1907.832 | 65.33 | SAR |
| M4 | TDD + Land cover | 1856.168 | 13.66 | SAR |
| M5 | TDD + Shrub height | 1865.34 | 22.83 | SAR |
| M6 | TDD + Land cover + TI-NDVIc | 1849.721 | 7.22 | SAR |
| M7 | TDD + Land cover + TI-NDVI + Albedo | 1845.383 | 2.88 | SAR |
| M8 | TDD + Land cover*Albedo + TI-NDVI | 1846.641 | 4.14 | SAR |
| M9 | TDD + Land cover*Albedo + TI-NDVI + VRM7d | 1846.497 | 3.99 | SAR |
| M10 | TDD + Land cover*Albedo + TI-NDVI + VRM15 | 1846.311 | 3.81 | SAR |
| M11 | TDD + Land cover*Albedo + TI-NDVI + VRM31 | 1844.53 | 2.02 | SAR |
| M12 | TDD + Land cover*Albedo + TI-NDVI + VRM61 | 1842.687 | 0.18 | SAR |
| M13 | TDD + Land cover*Albedo + TI-NDVI + VRM61 + Slope | 1843.795 | 1.29 | SAR |
| M14 | TDD + Land cover*Albedo + TI-NDVI + VRM61 + ADEMe | 1843.477 | 0.97 | SAR |
| M15 | TDD + Land cover*Albedo + TI-NDVI + VRM61 + PGf | 1842.505 | 0.00 | SAR |
| M16 | TDD + Land cover*Albedo + TI-NDVI + VRM61 + TPI | 1842.955 | 0.45 | SAR |
aTDD—(°C) sum of positive temperatures for DOY. bDOY—day of year. cTI-NDVI—Time integrated normalised difference vegetation index. dVRM7—vector ruggedness measure. eADEM—Arctic digital elevation model. fPG- pellet-group count.