

Abstract
Assessing vulnerability to climate change and extremes is the first step towards guiding climate change adaptation. It provides the basis to decide 'what' adaptation measures are needed 'where'. Vulnerability which is defined as a function of exposure, sensitivity, and adaptive capacity, differs spatially and evolves temporally. Therefore, it is imperative to understand the dynamics of vulnerability at sub-national scales to be prepared for and respond to current and future climatic risks. This paper focuses on Ethiopia where a sub-national understanding of vulnerability dynamics in smallholder agriculture systems is missing to date. The paper assesses the vulnerability of crop-based smallholder systems in Ethiopia for the past (1996–2005), current (2006–2015), and two future (2036–2045 and 2066–2075) climate scenarios using an indicator-based approach. The future scenarios are based on two Representative Concentration Pathways (RCPs) RCP 2.6 and RCP 6.0 from four general circulation models. Results show the emergence of highly vulnerable zones that were missing in the past scenario. With Paris agreement pathway, keeping global warming under 2 °C (RCP 2.6), reduction in vulnerability of 10% of the zones is noted in far future (2066–75) as compared to RCP 6.0 where the exposure increases, making 30% of the zones highly vulnerable. The projected increase in exposure to climatic hazards will worsen the vulnerability of smallholder agricultural systems in future unless the current adaptation deficit is sufficiently addressed. This study maps the temporal dynamics of vulnerability unlike the prevailing snapshot assessments at subnational-level for Ethiopia. The study seeks to assist the decision-making process to build resilience to climate change in Ethiopia and other low-income countries with similar geophysical and socio-economic conditions.
Export citation and abstract BibTeX RIS

Original content from this work may be used under the terms of the Creative Commons Attribution 4.0 license. Any further distribution of this work must maintain attribution to the author(s) and the title of the work, journal citation and DOI.
1. Introduction
Studies have illustrated the severe impacts of climate change and extremes in Sub-Saharan Africa (SSA) and heightened concerns for food security (Boyd et al 2013, Pironon et al 2019). Among the SSA countries, Ethiopia is subject to high climate variability and climatological hazards that have negatively influenced the agricultural sector in the past decades (Sietz et al 2017, Kamali et al 2018, Conway et al 2019). Projected changes indicate further increase in frequency and intensity of climate extremes, such as droughts, floods, and hot days and nights (McSweeney et al 2008, Nikulin et al 2018, Liou and Mulualem 2019). Ethiopia's agriculture and economy has been vulnerable to observed climate change (Diao and Pratt 2007, Yalew et al 2018), and this susceptibility of the Ethiopian agricultural system roots in the country's dependence on smallholder rain-fed agriculture (cultivation on landholdings less than 1 ha) with limited use of modern farm management practices.
Agriculture forms the main source of livelihood for about 80% of the Ethiopian population, merchandise export earnings (80%–85%), and national income contribution (35%–40%) (NLFS 2013, NBE 2020). As a low-income country, there are noted incidences of entrenched poverty, undernourishment, and recurrent food shortage (Dercon 2006, Dercon and Christiaensen 2011). Despite increasing trends of crop production at the national level (Cochrane and Bekele 2018), substantial sub-national discrepancies still exist due to localized climate conditions. It is certain that increasing climate variability and its impacts coupled with the prevailing socio-economic pressures, will exacerbate the existing risks to food insecurity, particularly for cereal food crops (Evangelista et al 2013). Scientific discourse on disproportional vulnerability of smallholder farmers provides an urgency to systematically analyze the range of relevant factors that contribute to vulnerability and identify high-risk regions to assist in adaptation planning. Such a systematic sub-national vulnerability assessment for crop-based smallholder agricultural systems, which accounts not only for the changes in climate (Evangelista et al 2013) but also the capacity of the population to adapt, is currently unavailable for Ethiopia (Williams et al 2018). Moreover, how vulnerability evolves within the range of climate change projections with different emission pathways is not known. In Ethiopia, as the risks driven by climate change increase, information about vulnerability of a region at different global warming levels can help policy makers.
Vulnerability to climate change and extremes is commonly defined as the degree to which a system is susceptible to and unable to cope with adverse impacts (Adger 2006, Füssel 2007). The susceptibility to impacts is determined by a complex interaction among a multitude of climatic, environmental, socio-economic, and institutional factors. As vulnerability is context-specific, its determinants vary across agro-ecological systems, scales and the studied attributes (such as livelihoods, crop types) (O'Brien et al 2004, Eriksen and Kelly 2007). Intergovernmental Panel on Climate Change (IPCC) provides a practical framework to conceptualize and operationalize vulnerability under three components: exposure, sensitivity, and adaptive capacity (AC) (Krishnamurthy et al 2014). Exposure reflects the magnitude and degree to which a climatic variation stresses a system. Sensitivity refers to the inherent susceptibility of a system to be affected by climate-related exposure, and AC refers to the capacity of a system to adapt to shocks and stressors (Adger 2006).
As vulnerability is not directly measurable, indicators are often used to quantify the underlying processes. Consequently, assessments are often indicator-based approaches (Tate 2012), also within smallholder agricultural systems (Williams et al 2018). Usually, the practice of characterization of vulnerability within indicator-based studies is limited to one-time snapshot (mostly of current) and, so far, studies insufficiently address the dynamics of the vulnerability over time (Vincent 2007, Bennett et al 2015). With the need for anticipatory adaptation increasingly becomes necessary to address the climate change impacts, it is therefore, crucial to explore which region is vulnerable, and at what timescale (Tschakert and Dietrich 2010, Saddique et al 2020).
In the present study, we aim to understand the vulnerability dynamics of crop-based smallholder systems to climate change and extremes at sub-national (zone) level for Ethiopia. Our study builds on an indicator-based approach integrating both biophysical and socio-economic dimensions of vulnerability. The analysis on vulnerability dynamics focuses on relative changes over four time-periods: 1996–2005 (past), 2006–2015 (current), 2036–2045 (near future), 2066–75 (far future), and space (zones in Ethiopia). Given projected climate risks vary across warming pathways, we used two contrasting emission pathways. We selected Representative Concentration Pathway (RCP) 2.6 (the Paris Agreement scenario characterized by drastic mitigation policy with steep decrease in emissions), RCP 6.0 (the likely 'business-as-usual' scenario with emission trends that stabilize by the end of the century). There are three specific research objectives that help bridge the existing literature gap: (a) to analyze the spatio-temporal dynamics of vulnerability and its three components—exposure, sensitivity, and AC for smallholder crop (maize, teff, sorghum, and wheat) systems; (b) to map the differences in vulnerability across RCP 2.6 and RCP 6.0, and (c) to identify regions of high vulnerability and understand the contributing factors. The study is relevant for adaptation planners at central (federal or national) and zonal level by identifying highly vulnerable regions and understanding the transitions of such vulnerability in each of the zones.
2. Data and methods
2.1. Study area
About 85% of the Ethiopian rely heavily on subsistence farming and account for 95% of Ethiopia's agriculture production (Evangelista et al 2013). Spatially, agriculture is distributed across the various heterogeneous agro-climatic regions (Murken et al 2020). Favourable agro-ecological conditions for crop production are mainly concentrated in the highlands, where the population density is also highest. Topography is an important determinant of agriculture potential in Ethiopia, with arable land mainly clustered in the highland of four regional states, namely Amhara, Oromia, Tigray and Southern Nations, Nationalities, and Peoples (SNNP hereafter) (figure 1(a) and also see SI 1(a) which is available online at stacks.iop.org/ERL/16/044007/mmedia). However highland topography requires farmers to diversify crop types and production periods to fit the highly variable agro-ecological conditions and spread production risks (Cholo et al 2019). In the other parts of Ethiopia, pastoralism is the predominant livelihood in the peripheral Arid and Semi-Arid Lowlands (ASAL) regions (Taffesse et al 2014).

Figure 1. (a) Administrative boundaries of 11 regions and corresponding zones; two enlarged views of selected areas are presented in the bottom. Their full names are provided in supplementary information (SI-1). (b) Annual mean temperature anomaly in °C (mean 1981–2019 is zero) from 1981 to 2019 (data source: ERA 5 product of ECMWF, downloaded from Google Earth Engine, (C3S 2017)); (c) Annual mean precipitation anomaly in mm (mean is zero) from 1981 to 2019 (data source: CHIRPS, downloaded from Google Earth Engine (Funk et al 2015); (d) number of climatological and hydrological disasters (droughts and floods) for entire Ethiopia (based on EM-DAT (Guha-Sapir 2020). Map 1(a) was prepared in ArcGIS 10.1 and the basemap used was provided by Esri, GEBCO, NOAA, National Geographic, DeLorme, HERE, Geonames.org, and other contributors.
Download figure:
Standard image High-resolution imageAnnual mean temperature and precipitation in Ethiopia show positive anomalies in recent times compared to the 1980s; for temperature the trend is more pronounced (figure 1(b)) than that of precipitation (figure 1(c)). Both mean temperature and mean precipitation trends are significant (p-value < 0.1). A detailed analysis of changes in climatic parameters and extremes provided in Gebrechorkos et al (2019) shows also similar findings. A slightly increasing trend for the number of climatological and hydrological disasters is also noted (figure 1(d)). However, these aforementioned changes in climatic parameters and disasters are not evenly distributed across the country and vulnerability to these impacts differs spatially—due to the immense diversity in the social, economic and ecological landscape of Ethiopia (Husmann 2016, Simane et al 2016, Gebreyes and Theodory 2018).
The country's agro-ecological conditions are characterized by differences in soil type, climate, water availability and terrain that influence agricultural production and productivity (Eggen et al 2019) and food security (Cholo et al 2019). In addition, there is enormous inequality in the level of socio-economic development. Husmann (2016) showcased spatial heterogeneity in marginality hotspots, often located in areas with low agricultural potential in Afar and Somali region. Besides, the utilization of modern agricultural inputs and practices varies across regions. Sheahan and Barrett (2014) illuminate the tremendous heterogeneity in input use across regions and report that Tigray, SNNP, Harari are much above the national averages of fertilizer application, while Afar, Somali, Benshagul-Gumaz, Gambela, Dire Dawa are even below 10 kg ha−1. Given such variations in agriculture potential, modern agriculture input usage, and development within the country, a spatially disaggregated vulnerability-assessment of the agricultural system helps capture the complexity and diversity of factors, and inform adaptation planning process at appropriate administrative levels (Fekete et al 2010, Frazier et al 2014, Mekonnen et al 2019).
2.2. Indicators
We focus our analysis on cereal-based (teff, sorghum, maize, and wheat) farming smallholder in 64 zones (out of the 75) where agricultural data was available (CSA 2016). Indicators are selected to capture characteristics of agricultural systems, farmers, management practices, and inherent marginality that potentially determine the vulnerability to climate change impacts. Literature around the concept of vulnerability, marginality and poverty was additionally reviewed to select robust indicators. Finally, 15 vulnerability indicators (refer to SI 2) were selected based on their relevance to agricultural systems in Ethiopia, availability of data. Highly correlated indicators were ignored. For instance, annual mean days with precipitation above 5 mm was found to be positively correlated with yearly mean precipitation (r = 0.93). Further, same boundaries were for 2005 using the zonal divisions in 2015 as the baseline to maintain consistency and minimize data loss. In cases where one administrative zone was split into two in 2015, data for the 'new' zones was duplicated.
As the majority of the crop farmers practice rain-fed agriculture (CSA 2006, 2016), changes in precipitation and temperature directly affect water availability and thus crop production (Liben et al 2018). Therefore we include changes in temperature and precipitation variability, extreme temperature, and dry spells in this study. We define precipitation variability by the coefficient of variation (CV) of the annual precipitation and dry spells as more than 5 d with less than 1 mm daily precipitation (consecutive dry days—CDD), and their annual number is averaged over the selected time period. With regard to temperature, we considered the average annual number of the days above 35 °C (Fischer and Schär 2010, Murken et al 2020) to capture the temperature extremes, and CV of annual mean temperature to estimate mean temperature variability.
To estimate the exposure, climate data was retrieved from reanalysis data to describe past and current conditions; and from four Coupled Model Intercomparison Project generation GCMs to project future conditions. The past and present climate indicators are calculated from the gridded WATCH-ERAinterim (WFDEI) dataset (Weedon et al 2014). This dataset is available at daily temporal and 0.5° spatial resolution (~50 km). WFDEI combines the comprehensive character of reanalysis data and accuracy of observations, as it is ERA-interim reanalysis bias-adjusted to observations, in particular to CRU TS3.1/3.21 temperature data (Harris et al 2014) and GPCCv5 precipitation data (Becker et al 2013). For future conditions, we chose the climate data from the ISIMIP2b project (Frieler et al 2017). Simulations of four GCM models (GFDL-ESM2M, HadGEM2-ES, IPSL-CM5A-LR, MICROC5) have been bias-adjusted using EWEMBI climate data (Lange 2018). As EWEMBI is based on the WFDEI methodology, the observational and GCM data provide a consistent dataset of past and future. The future emission scenario RCP 2.6 (van Vuuren et al 2011) and RCP 6.0 (Moss et al 2010) was selected as low and moderate warming scenario, respectively. We choose RCP 6.0 in contrast to RCP 8.5 as it is the more likely under current policies in contrast to RCP 8.5 (Hausfather and Peters 2020; Rohat et al 2020). Median values of the four GCMs were taken as an input for estimating the exposure indicator for the future scenario.
To estimate sensitivity and AC, we focused on capturing the smallholder producers' biophysical, social, and economic factors. For sensitivity, we included indicators related to cropland (percentage of four main cereals cropped area), dependence on crop agriculture (percentage of crop holders and holders with landholding less than 1 ha), and gender differences (percentage of women crop holders) (see also SI 2). Call and Sellers (2019) also highlighted in their recent review that women are more susceptible to climate change impacts highlighting the strong gender-based asymmetries that exist in SSA. Based on these indicators, we argue that zones characterized by greater dependence on smallholder agriculture, and higher proportion of women crop-holders will face enhanced sensitivity to climate change risks. We used the Ethiopian agriculture census in 2005, and 2015 to create these four sensitivity indicators for past and current periods respectively. With an aim to capture broader biophysical and socio-economic attributes of AC, we selected indicators that contribute to farm management, biophysical (natural) capacity, resource access, and human capacity. Studies have demonstrated casual pathways through which greater access and entitlement to the chosen AC indicators have shaped smallholders' capacities to respond and reduce vulnerability (Wood et al 2014, Williams et al 2018). We used annual mean of vegetation indices as a proxy for crop health based on Normalized Difference vegetation Index (NDVI) from MODIS satellite data, sub-surface soil moisture (annual mean soil moisture from ESA CCI Microwave Soil data), along with socio-economic data from agriculture census on the proportion of irrigated area, fertilized area, agricultural extension services, farmers' literacy, and access to credits (CSA 2006, 2016).
2.3. Calculation and mapping of the vulnerability index
A comprehensive methodological framework is presented in figure 2. Normalisation of indicators across space and time was done using linear (minimum-maximum) scaling, which scales the data in the range of 0–1 (Tate 2012). Data for all 64 zones for the four time-periods and two RCPs were pooled together, and outliers were removed using winsorizing method (Barnett and Lewis 1994). Normalised values of indicators within each vulnerability component were averaged with equal weighting to obtain a composite value of each component. In order to obtain the final vulnerability index we aggregated the values of the three vulnerability components as expressed below:
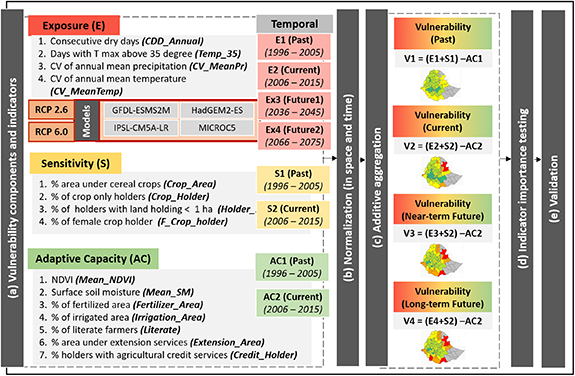
Figure 2. Overview of the methodology of the study. The methodology involves five ((a)–(e)) main steps: (a) selection and calculation of raw indicators for each vulnerability component; (b) normalization of indicators (0–1); (c) additive aggregation to compute vulnerability index across four time-periods and two RCPs in future; (d) indicator importance analysis; (e) validation of results. Refer to SI 2 for the details of indicators.
Download figure:
Standard image High-resolution imageThe expression implies that the overall vulnerability (V) of a given area (zone in our case) is positively related to the extent of exposure (E) and the degree of sensitivity (S), but inversely to AC. We, then, normalized the values to range from 0 (least vulnerable) to 1 (most vulnerable) for being realized practically. Finally, indices for each component and vulnerability were divided into five (relative) categories: very low (0–0.2), low (above 0.2–0.4), middle (above 0.4–0.6), high (above 0.6–0.8), and very high (above 0.8–1). We examined the importance of all indicators for vulnerability ranks of zones individually by consecutively excluding each of the indicators. Changes in the vulnerability ranks for all zones under exclusion of each indicator were plotted to identify the most influencing indicators. Finally, we validated our vulnerability index using two variables: (a) share of crop area damaged by extreme events such as hailstorms, excess rain, and shortage of rainfall as an outcome-based approach to validation (Sietz et al 2012, Vidal Merino et al 2019) and (b) annual maize production in the year 2005, and 2015. Vulnerability and crop damage or maize yields, respectively, were subjected to Spearman's rank correlation test.
3. Results
3.1. Temporal changes in vulnerability indicators and components
Figure 3 presents the temporal changes in the normalized indicator values and vulnerability components (exposure, sensitivity, and AC). For the two future scenarios (near-term and far-term), only values for the exposure index, derived from the climate projections, were used with values of sensitivity and AC index constant as of current time-period. The results show strong changes in the distribution of the exposure index for RCP 2.6, and RCP 6.0 across the four time periods (figure 3(a)). Overall, as we move from past to future, the narrow unimodal distribution of exposure changes to broad bi-modal distribution with higher frequency of large exposure values. However the magnitude varies across future time-periods. In the near-term future an increase in CV of mean temperature (+3.8 in RCP 2.6, +2.7 in RCP 6.0) and precipitation (+0.4 in RCP 2.6, +1.5 in RCP 6.0) is observed, whereas CDD remains nearly stable between periods. In the far-future, a higher warming magnitude is correlated with a strong increase in temperature above 35° (+1.3 in RCP 6.0), and greater variability in precipitation is observed (+1.2 in RCP 6.0). A decrease in exposure for RCP 2.6 in far-future is due to offset in variability in mean temperature (CV_meanTemp), which could be a result of low stabilized radiative forcing after 2050. We present the spatial distribution of each exposure indicator in SI-3.
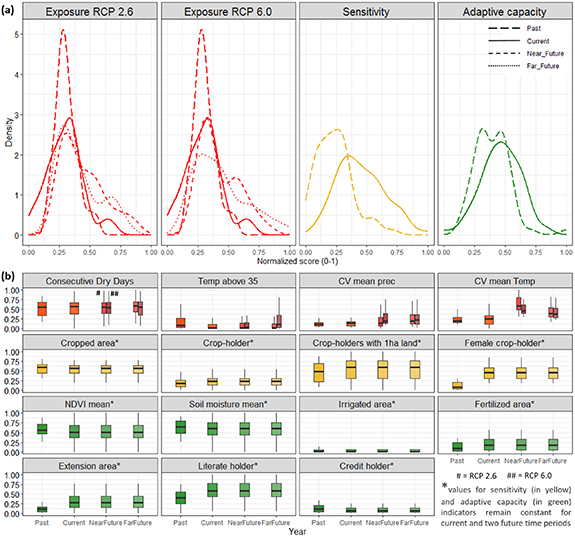
Figure 3. (a) Distribution of exposure (under RCP 2.6 and 6.0), sensitivity, and AC components of vulnerability. (b) Temporal variation and distribution of the 15 selected indicators under each vulnerability component for past (1996–2005), current (2006–2015), near-term future (2036–2045), and far-term future (2066–2075). (Refer to figure 2 or SI 2 for the variable codes, and SI-5 for statistical significance of differences for AC and sensitivity indicators).
Download figure:
Standard image High-resolution imageThe distribution of the overall sensitivity index (figure 3(a)) depicts a shift from a positively skewed distribution in the past to near-normal distribution in the current period. Some indicators of sensitivity show an increasing trend in mean values from past to current. An increase in the proportion of women crop farmers (+0.36), greater reliance on cereal crop farming (crop-holder +0.09), and marginal landholding (crop-holder with 1 ha land +0.06) is observed in 10 years, making the agriculture less economic viable and more risk-prone. In sum, a greater proportion of zones in Ethiopia are more susceptible to climate impacts in current as compared to past times (figure 3(b)).
The density curve of the AC index shown in figure 3(a) illustrates its near-normal distribution in the past across the zones of Ethiopia. This indicates the presence of some zones with better biophysical and socio-economic conditions to adapt to changes in climate. In contrast, other zones show a relatively inadequate AC. A marginal increase in the AC is noted from the past to current that can be attributed to increase in literacy of crop holders, area under agriculture extension services, and fertilized area. In contrast, biophysical indicators namely, NDVI (−0.02) and soil moisture (−0.06) show a marginal declining trend, while the percentage of irrigated area and farmers with access to credits remained nearly constant (figure 3(b)).
3.2. Spatial changes of the vulnerability components
Figure 4 presents the spatial distribution of components of vulnerability across four time-periods. Highest increase in exposure values is observed in the peripheral areas of North-East regions. A decrease in a few South-west regions from past to current conditions is observed. Both the exposure scenarios (RCP 2.6, 6.0) indicated higher values in all the peripheral areas, particularly in southern and eastern parts, but not in the western parts in both near and long-term. These include the Afar zone-1 (Afar region), Afar zone-3 (Afar region) Siti zone (Somali region), and South Omo (SNNP). We performed a spatial correlation of exposure values across the two time-steps across RCPs and found high correlation values (refer to SI-4), indicating that a zone experiences similar exposure across the two RCPs. A noticeable increase in sensitivity index values was observed in the extreme East, West and North with a slight increase is seen in all other areas. Highest increase was observed in the Siti zone (Somali region), Central zone (Tigray region) and Agnuak zone (Gambella region). Increase in sensitivity index is mainly due to an increased share of crop holders, holders with less than 1 ha of farm land, and higher number of women crop holders. Although the higher share of women crop holders could indicate greater participation of women, however, literature affirms the contrary that gender productivity gap is still very high in Ethiopia. Women face greater challenges with limited access to farm resources and benefit less from agricultural policies, leading to enhanced susceptibility to climatic risks (Solomon et al 2015). AC has only increased in a few areas in western and central regions, while it has decreased in Agnuak zone (Gambella region) while an increase in the zones of Oromia region was observed due to increase in zone-specific factors such as literacy, agriculture area under extension services. For instance in Gedeo zone (SNPP) an increase in soil moisture and literacy rate of farmers was noted in 2015 as compared to 2005.

Figure 4. The zone level distribution of vulnerability (exposure, sensitivity, AC) components for four time periods, i.e. past (1996–2005), current (2006–2015) and near-future (2036–2045), and far-future (2066–2075) scenario. For the future scenarios across two RCPs, values of sensitivity and AC index are equated to values of 2015. Classification into five colors is done using equal intervals (0—less than 0.2, 0.2—less than 0.4, 0.4—less than 0.6, 0.6—less than 0.8, above 0.8).
Download figure:
Standard image High-resolution image3.3. Spatio-temporal dynamics of vulnerability
Figure 5 shows the spatial and temporal variance of vulnerability across Ethiopia categorized in five classes, based on relative vulnerability index values for RCP 6.0. We present the same vulnerability transitions under RCP 2.6 in supplementary information (SI-6). None of the zones is categorized in high or very high vulnerability class in the past scenario as compared to current and future, highlighting a trend towards increasing vulnerability. The proportion of zones categorized as highly (including both high and very high class) vulnerable shows an increase from past to current scenario (0%–10%) and another three-fold (two-fold) increase from current to far-future in RCP 6.0 (RCP 2.6). In near-term the observed transitions in vulnerability are comparable across RCP 2.6 and 6.0, with similar proportion of zones classified in very high category (3% of total zones) with a slightly higher percentage of zones classified as high vulnerable in RCP 2.6 (23%) as compared to RCP 6.0 (19%). This difference in near-term between the two RCPs is due to high variation in mean temperature in RCP 2.6 as can be seen from figure 3(b). However, for the far future (2066–2075), vulnerability across the RCPs shows disparity and we find that vulnerability is much higher for RCP 6.0 owing to high values of temperature extremes (figure 3(b)). Zones with very high vulnerability include Afar region, Siti and Liben (Somali region), and South Omo (SNNP region). In contrast, very low and low vulnerability zones are mainly located towards the center. Although the zones with very low vulnerability have reduced from the past to near future scenario, an increase in their number is noted in far-future under RCP 2.6. We also notice a few positive shifts (grey lines of transitions in figure 5 and SI 5 from a higher to lower vulnerable class) from past (1996–2005) to the current (2006–2015) partly due to the compensating effects of the AC. Such an effect of AC is not noted as we move from current to near or far future, as the values of AC remain constant with dynamic exposure only. Compared to RCP 6.0 (figure 5) by achieving RCP 2.6 (figure SI-6) leads to a reduction in exposure in far-term future with a systematic shift to lower vulnerability classes, whereas under RCP 6.0 exposure in far-future scenario is intensified. Details on values of each of the 15 indicators for each of the five vulnerability classes and mean values for each of the ten regions are provided in the supplementary information SI-7 and SI-8, respectively.
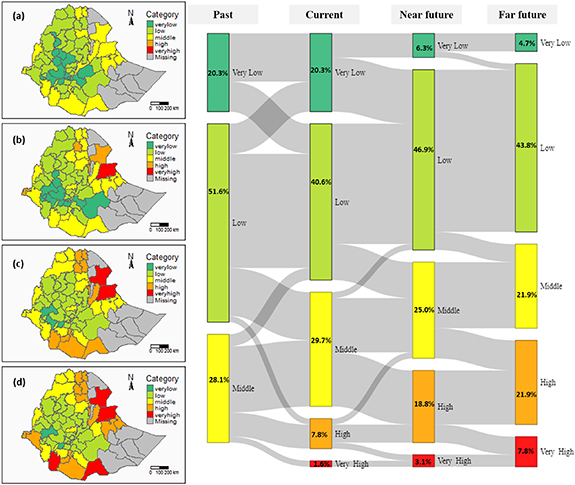
Figure 5. Vulnerability class transition visualization as a Sankey diagram for RCP 6.0. The vulnerability index was categorized into five equal classes: very low (0–0.2), low (0.2–0.4), middle (0.4–0.6), high (0.6–0.8), and very high (0.8–1). (a)–(d) Show the maps of past, current and near-term future, and far-term future vulnerability, respectively. Refer to figure 1 and SI-1 for the names of regions and zones.
Download figure:
Standard image High-resolution image3.4. Indicator importance and validation analysis
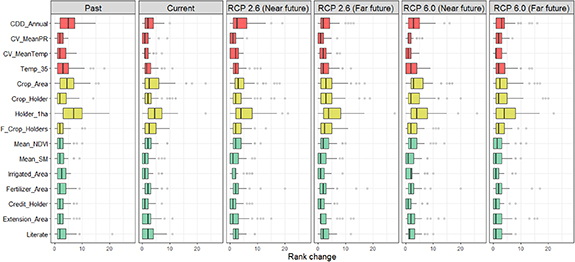
Indicator importance ranking was done using local sensitivity analysis, as detailed by (Tate 2012). Local sensitivity analysis estimates how the final rank of vulnerability changes, if the choice of vulnerability contributing factor is changed. The results of indicator exclusion (figure 6) depict that the elimination of single sensitivity or exposure indicators leads to higher deviations in vulnerability ranks as compared to indicators from the AC group. This observation is consistent across the three time periods. The exclusion of crop holders with less than 1 ha of arable land (Holder_1 ha) leads to the highest mean shift of 10% in vulnerability classes, followed by the percentage of the four main cereal cropped areas (crop_area) with a 6% shift in ranks (figure 6). Out of the four exposure indicators, the highest shifts in vulnerability ranks were induced by an exclusion of consecutive dry days (CDD_Annual) and extreme temperatures (Temp_35). In the case of the exposure indices, we can deduct that the spatial variability of the indicators with higher impact is larger. Yet, as apparent in figure 3(b), the proportion of irrigated area or crop holders with access to agricultural credits is missing in about 50% of the zones in Ethiopia, which may induce a relatively low importance. The indicator importance of the sensitivity and AC groups changes slightly between current and future times, despite equal input values, due to an implicitly increased relative weight of the exposure component—which is the only component with different data in the future.
Figure 6. Rank-based estimate of indicator importance across four time periods. The boxplots show changes in the vulnerability rank across all 64 zones when the respective indicator is excluded. Higher values indicate greater importance of an indicator in determining the vulnerability rank. For codes refer to supplementary information (SI-2).
Download figure:
Standard image High-resolution image
For validating the final vulnerability index, we first spatially correlated its values for past and current times with the percentage of crop area damaged due to extreme weather events. Our final vulnerability index correlates with crop damage area moderately (r =0.47) for the past, and more robustly (r =0.63) for the current time (refer to SI-9). Second, we correlated the ranks of vulnerability with the ranks of actual maize yields and found a negative Spearman's correlation coefficient for past (r = −0.47) and current (r = −0.62). The relatively weaker correlations for the past conditions may be attributed to missing values for this time period. Overall, this validation demonstrates the ability of our vulnerability index to explain observed vulnerability-related outcomes sufficiently well.
4. Discussion
4.1. Dynamics in vulnerability in two contrasting emission scenarios
Our results illustrate the spatial dynamics of vulnerability in a stabilizing climate scenario (RCP 2.6) with strong abatement in greenhouse gas emissions scenario, is compared with a near business-as-usual scenario (RCP 6.0) indicating feeble abatement actions. Major differences between the two RCP trajectories emerge in the far future (2066–2075), revealing an enhanced exposure in RCP 6.0, and thereby aggravating the vulnerability of rainfall-dependent subsistence agricultural activities. In contrast, relatively small differences in vulnerability between two RCPs in near-term (2036–2045) could be due to large differences in RCPs becoming evident only after 2050 (Nikulin et al 2018, Osima et al 2018). Afar and Somali regions of Ethiopia are at greater risks in the near future and even in far-future (figure 5). These regions in Ethiopia have faced consistently higher vulnerability across all time periods (current, near and far future). Combination of increasing exposure in an already fragile environment with increasing sensitivity and low AC entails high vulnerability of these regions (figure SI 7). This is consistent with critical vulnerability conditions in the extremely dry, resource-constrained and weakly governed northern Afar region where crippling livelihood and food insecurity prevails (Sietz et al 2017, Choularton and Krishnamurthy 2019). Adaptation planning in Ethiopia should address these historically rooted and currently intensifying social and biophysical disparity. For instance one as can be noted form figure 3(b) that there is an increase in women crop holders, therefore one approach could be to strengthen the inclusion and involvement of women in decision making and adaptation planning. Figure 5 presents the map of the future vulnerability, and likely transitions in vulnerability in RCP 6.0, if decisions with opportunity space to adapt to the ongoing climate crisis are missed. The opportunity space is distinct from adaptation (IPCC AR5), and represents the window in which decision makers can plan and implement actions to facilitate adaptive responses (refer to Lipper et al 2014 for deeper understanding on the concept of opportunity space). Unless adaptation measures are prioritized across the identified vulnerable zones to lower risks to food and livelihood security, the opportunity space may be missed.
4.2. Scale and context asymmetries among AC indicators
The importance of individual components of vulnerability (figure 6) may provide hints for such early adaptation. Yet local studies in different parts of Ethiopia have reported a paradoxical role of some of the AC indicators as compared to the expected relationship with vulnerability (SI 2) assumed in our study. For instance, the study by Simane et al (2016) reports that the increased use of fertilizer in absence of irrigation can be risky. In most cases, increasing the fertilizer supply has a positive effect on crop production, but, in rainfall dependent regions, enhanced application has led to drying of crop at flowering stage, and decrease in soil productivity (Gebreyes and Theodory 2018). With regards to credit uptake, in contrast to the general agreement in the scientific literature that credits have a positive development effect, few studies report that in regions intersecting with failed rains, marginality, and glaring institutional failures credit uptake has led farmers in a perpetual poverty trap (Dercon and Christiaensen 2011, Husmann 2016). Learnings from local-level studies reveal a complex interconnected nature of AC indicators, highlighting the fundamental importance of scale and context in understanding the paradoxes (Wilbanks and Kates 1999, Vincent and Cull 2014). Dercon and Christiaensen (2011) identified that synergistically planned interventions of insurance and credit are needed to suit Ethiopia's drought-prone conditions and address the food security concerns. Accounting for these local asymmetries and the synergistic role of adaptive indicators are encouraged in further research.
4.3. Methodological strengths and limitations
Our study shares the general limitations with indicator-based assessments owing to the selection, weighing, and aggregation of indicators (Tonmoy et al 2014, Williges et al 2016). We tried to overcome these challenges through indicator importance estimation based on their relative contributions (figure 6), integration of remote sensing data, and a validation of the composite vulnerability index with independent data. We verified the vulnerability index using an advanced outcome-based approach (Sietz et al 2012, Rød et al 2015). Other studies used household surveys to validate vulnerability patterns and rank these according to the severity of vulnerability (Vidal Merino et al 2019) and to triangulate vulnerability findings (O'Brien et al 2004). These participatory approaches are valuable to test the validity of vulnerability metrics, although the geographic coverage of these approaches is restricted to smaller regions due to high efforts of conducting the surveys. Further, we used equal weights for all of the indicators, thereby avoiding a second level case study data of subjective bias. In future assessments expert and stakeholder opinion could provide useful insights to assign weights through usage of multi-criteria weighing methods (Eakin and Bojórquez-Tapia 2008). Our study projects changes in future vulnerability (figures 4 and 5) based on changes in exposure alone. We did not extrapolate sensitivity and AC indicators for future scenarios due to substantial uncertainty of such forecasts. Future studies could provide more conclusive estimates by also projecting future socio-economic indicators to overcome this limitation. The vulnerability index we calculated is a relative measure, implying regions with minimum and maximum vulnerability. In contrast with absolute measures of vulnerability, this highlights intra-country and temporal differences. Moreover, the identified hot-spots of vulnerability—in particular for the future—should not serve as a single basis for allocating adaptation funds, as this would rather require a thorough follow-up analysis reflecting idiosyncrasies of the adaptation measures under scrutiny.
5. Conclusions and policy implications
Identifying locations of high vulnerability within the agriculture sector has become necessary given the inherent uncertainty in future climate projections. Scientific studies that map the spatial pattern of vulnerability can underpin evidence-based adaptation planning. Our study concentrates on mapping dynamics in vulnerability (and its components) with focus on smallholder agricultural systems. We show the dynamics in relative ranks of vulnerability not only for the current but also for the past, near and far future climate conditions across two contrasting RCPs. Three main conclusions can be drawn from the results. First, as a strong increase in vulnerability is noted over time in zones located in the eastern and southern parts of Ethiopia, these zones warrant prioritized planning for adaptation. For example changing farm structures or fertilizer use with local controlled experiments. Second, the adaptation deficit is increasing as enhanced exposure has a multiplicative impact on an already fragile climate-sensitive region. Thus, beyond strengthening AC, strategies for reducing exposure and sensitivity components should be devised. Third, the influence of vulnerability components varies across zones, requiring adaptation planning to be tailored to geographic needs and tested in randomized control trials for rigorous evaluation. Further, the already pronounced vulnerability and projected future increase in Afar and Somali regions demands much greater attention and integration of these regional concerns in decision-making at the national level. Our results can feed into spatially explicit adaptation planning that will inform decision-making to minimize the negative impacts of climate change in smallholder agricultural systems.
Acknowledgments
We acknowledge the support of our funders of our research. This work has been carried out within the AGRICA project. AGRICA is funded by the Deutsche Gesellschaft für Internationale Zusammenarbeit (GIZ) GmbH on behalf of the German Federal Ministry for Economic Cooperation and Development (BMZ).The research was also supported by the ClimSec project, funded by German Foreign Office. We would like to thank the three anonymous reviewers for constructive feedback, which greatly improved the manuscript.
Data availability statement
The data that support the findings of this study are available upon reasonable request from the authors.
Supplementary data Experimental details including full setup information and measurements of the dimensions of the double slit.