

Abstract
Globally, there are millions of kilometres of drainage ditches which have the potential to emit the powerful greenhouse gas methane (CH4), but these emissions are not reported in budgets of inland waters or drained lands. Here, we synthesise data to show that ditches spanning a global latitudinal gradient and across different land uses emit large quantities of CH4 to the atmosphere. Area-specific emissions are comparable to those from lakes, streams, reservoirs, and wetlands. While it is generally assumed that drainage negates terrestrial CH4 emissions, we find that CH4 emissions from ditches can, on average, offset ∼10% of this reduction. Using global areas of drained land we show that ditches contribute 3.5 Tg CH4 yr−1 (0.6–10.5 Tg CH4 yr−1); equivalent to 0.2%–3% of global anthropogenic CH4 emissions. A positive relationship between CH4 emissions and temperature was found, and emissions were highest from eutrophic ditches. We advocate the inclusion of ditch emissions in national GHG inventories, as neglecting them can lead to incorrect conclusions concerning the impact of drainage-based land management on CH4 budgets.
Export citation and abstract BibTeX RIS

Original content from this work may be used under the terms of the Creative Commons Attribution 4.0 license. Any further distribution of this work must maintain attribution to the author(s) and the title of the work, journal citation and DOI.
1. Introduction
Inland waters including lakes, rivers, wetlands and ponds play an important role in the global carbon cycle and climate system because they emit large amounts of greenhouse gases (GHGs) including methane (CH4), carbon dioxide (CO2), and nitrous oxide (N2O) to the atmosphere [1–5]. CH4 is an important GHG emitted from inland waters; this is because many waterbodies have high fluxes and because CH4 has a 100 year global warming potential (GWP) of 28 [6] resulting in a substantial radiative forcing effect [4, 7–9].
Total inland water CH4 emissions have been estimated as 100–200 Tg CH4 yr−1 [10, 11], equivalent to ∼30% of global CH4 emissions [11]. Globally and regionally important emissions of CH4 have been documented from reservoirs [4], lakes [12], streams and rivers [13], small natural ponds [8], and artificial ponds [14]. It would therefore appear that CH4 emissions from the major categories of inland waters have been quantified. However, emissions from another, potentially important category of inland waters have yet to be quantified at a global scale: ditches. Here, we present a synthesis of new and existing flux data from ditches showing that ditches release large amounts of CH4 and that these emissions are significant on national and global scales.
The Ramsar Convention includes ditches as human-made wetlands under the category 'canals and drainage channels or ditches' [15]. Artificial irrigation channels are also classified as 'irrigated land'. However, there are no strict Ramsar definitions for these categories, which are a 'broad framework to aid rapid identification of the main wetland habitats' [15]. Ditches, canals and channels are created to: (a) improve the productivity of wet soils through drainage; (b) reclaim land from flooded areas; (c) move water through a landscape for agricultural or industrial use; (d) reduce agricultural soil erosion, or (e) remove stormwater in urban areas. For our purposes, we define ditches as constructed linear waterways, whilst acknowledging that their physical characteristics and function may vary widely (figure 1). Thus, irrigation channels and water supply canals in arid regions fall within our definition. We recognise that not all linear waterways included in our definition can strictly be described as drainage ditches in the traditional sense (i.e. they do not all drain land/lower the water table), however we use this term for simplicity, and because drainage ditches comprise the large majority of our dataset, as well as the majority of mapped linear water features globally (e.g. global ditch length is several orders of magnitude larger than global canal length; see SI text 9 (available online at stacks.iop.org/ERL/16/044010/mmedia)). Finally, it is worth noting that terminology is inconsistent and the words 'ditch' and 'canal' may even be used interchangeably; for example, larger drainage channels in SE Asian peatlands are navigable and often referred to locally as 'canals'.
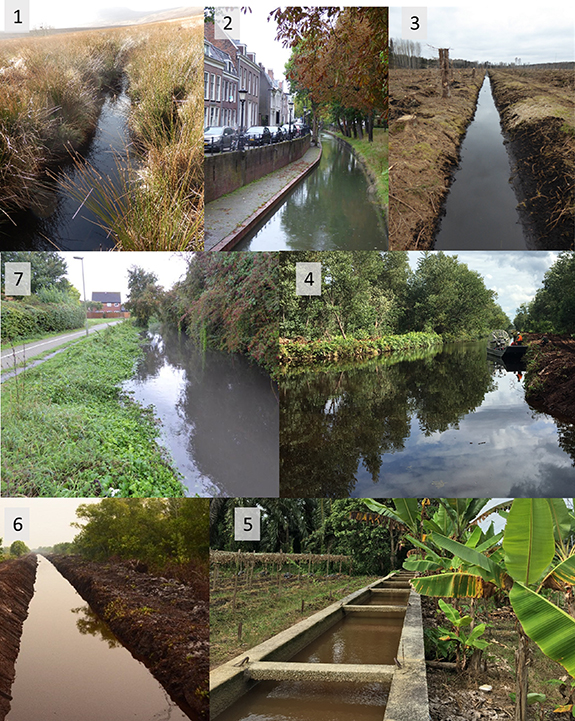
Figure 1. Photographs of ditches differing in design and function. Clockwise from top left: (1) ditch in a UK upland blanket bog; (2) an urban canal in the Netherlands; (3) a ditch in a felled peatland forest in Sweden; (4) a water management channel in an Indonesian Acacia plantation; (5) a rice paddy irrigation channel in Malaysia; (6) a freshly dug ditch on ex-Mega Rice Project land in Central Kalimantan; (7) a UK urban ditch under flood conditions.
Download figure:
Standard image High-resolution imageThe spatial extent of ditches has been recognised on both small and large landscape scales. For instance, in a boreal catchment ditches doubled the length of the stream network [16], whilst in Great Britain the total length of ditches is estimated at ≈604 000 km which is more than twice that of streams and rivers combined (≈267 000 km) [17]. Data are scarce, but other estimates of drainage networks exist, and show that ditches can occupy a significant proportion of the waterscape in some countries and regions across the world [18–22].
Ditches possess particular characteristics which means that they cannot be assumed to function identically to most streams and rivers (although similarities may exist with streams in low-relief agricultural landscapes). Firstly, ditches do not in general follow natural topographic gradients and do not have natural catchments. They are often, but not always, situated in low-lying, low-relief landscapes which result in low flow rates. This creates a set of conditions favourable to CH4 production and emission, namely: (a) the accumulation of sediment; (b) the development of anoxia; and (c) the growth of emergent plants. Ditches within agricultural and urban landscapes may also receive high inputs of labile organic matter and nutrients, providing a substrate for methanogenesis [21]. In such environments, CH4 is produced autochthonously in anaerobic bottom waters or sediments by methanogenesis at rates dependent on an array of factors including temperature and labile carbon content [23]. In addition, ditches may act as conduits for the emission of CH4 which is produced under anaerobic conditions in adjacent terrestrial environments [24]. This process could be particularly important because, unlike other inland waters, ditches are specifically created to drain (i.e. to receive lateral transfers of water from adjacent land), and at an extremely high drainage density [20, 25] when compared to natural streams. In summary, ditches have a particular set of hydrological, chemical and morphological characteristics that differentiate them from natural streams in ways that favour CH4 production and emission. It has been suggested that ditches may have higher CH4:CO2 ratios than streams, albeit based on a small dataset (see SI text 1) [13].
Given that CH4 emissions from streams have been recognized for over 100 years [26, 27], there have been surprisingly few quantitative assessments of CH4 fluxes from ditches until the last two decades. Roulet and Moore [24] performed one of the first studies, in which they suggested that peatland ditches 'depending on the flow rate, depth, and morphology, could provide an ideal environment for the transport and in situ production of CH4'. They found that drainage resulted in CH4 uptake by the terrestrial peat surface, but that the ditches themselves emitted large amounts of CH4. Thus, when scaled across the entire peatland they suggested that, depending on the spacing between ditches, drainage could result in a net increase in landscape CH4 emissions. The potential of peatland ditches to emit CH4 was confirmed by other studies [28, 29]. Ditches were subsequently incorporated into IPCC guidance for assessment of GHG fluxes from drained organic soils as part of the 2013 Wetlands Supplement [30]. This assessment identified a limited dataset of 19 publications reporting ditch CH4 emissions from drained peat soils [31]. Because of the growing appreciation of the important role of CH4 in regulating the global climate, the number of relevant studies has increased since 2013. However, to date no comprehensive, global-scale analysis of CH4 emissions from ditches has been undertaken. Furthermore, whereas stream (and lake) emissions are a natural component of the global CH4 budget (albeit subject to potential anthropogenic influences) ditches are constructed, therefore all associated CH4 emissions must be considered anthropogenic. Our aim here is to draw attention to the potential importance of ditch fluxes in the global CH4 cycle, and to highlight the lack of data from ditches which are a near ubiquitous landscape feature across climate zones and land use classes.
Here, we update and extend estimates of CH4 emissions from ditches by including new literature and previously unpublished data. In total, we were able to calculate annual emissions for 64 unique ditch sites encompassing a wide range of ditch morphologies, latitudes and land uses. The majority of studies used the floating chamber method, and so we focused on these, and excluded a small number of flux estimates based on dissolved CH4 concentrations. For all studies we extracted data on land-use, eutrophication status, and climate.
2. CH4 emissions from ditches: a synthesis
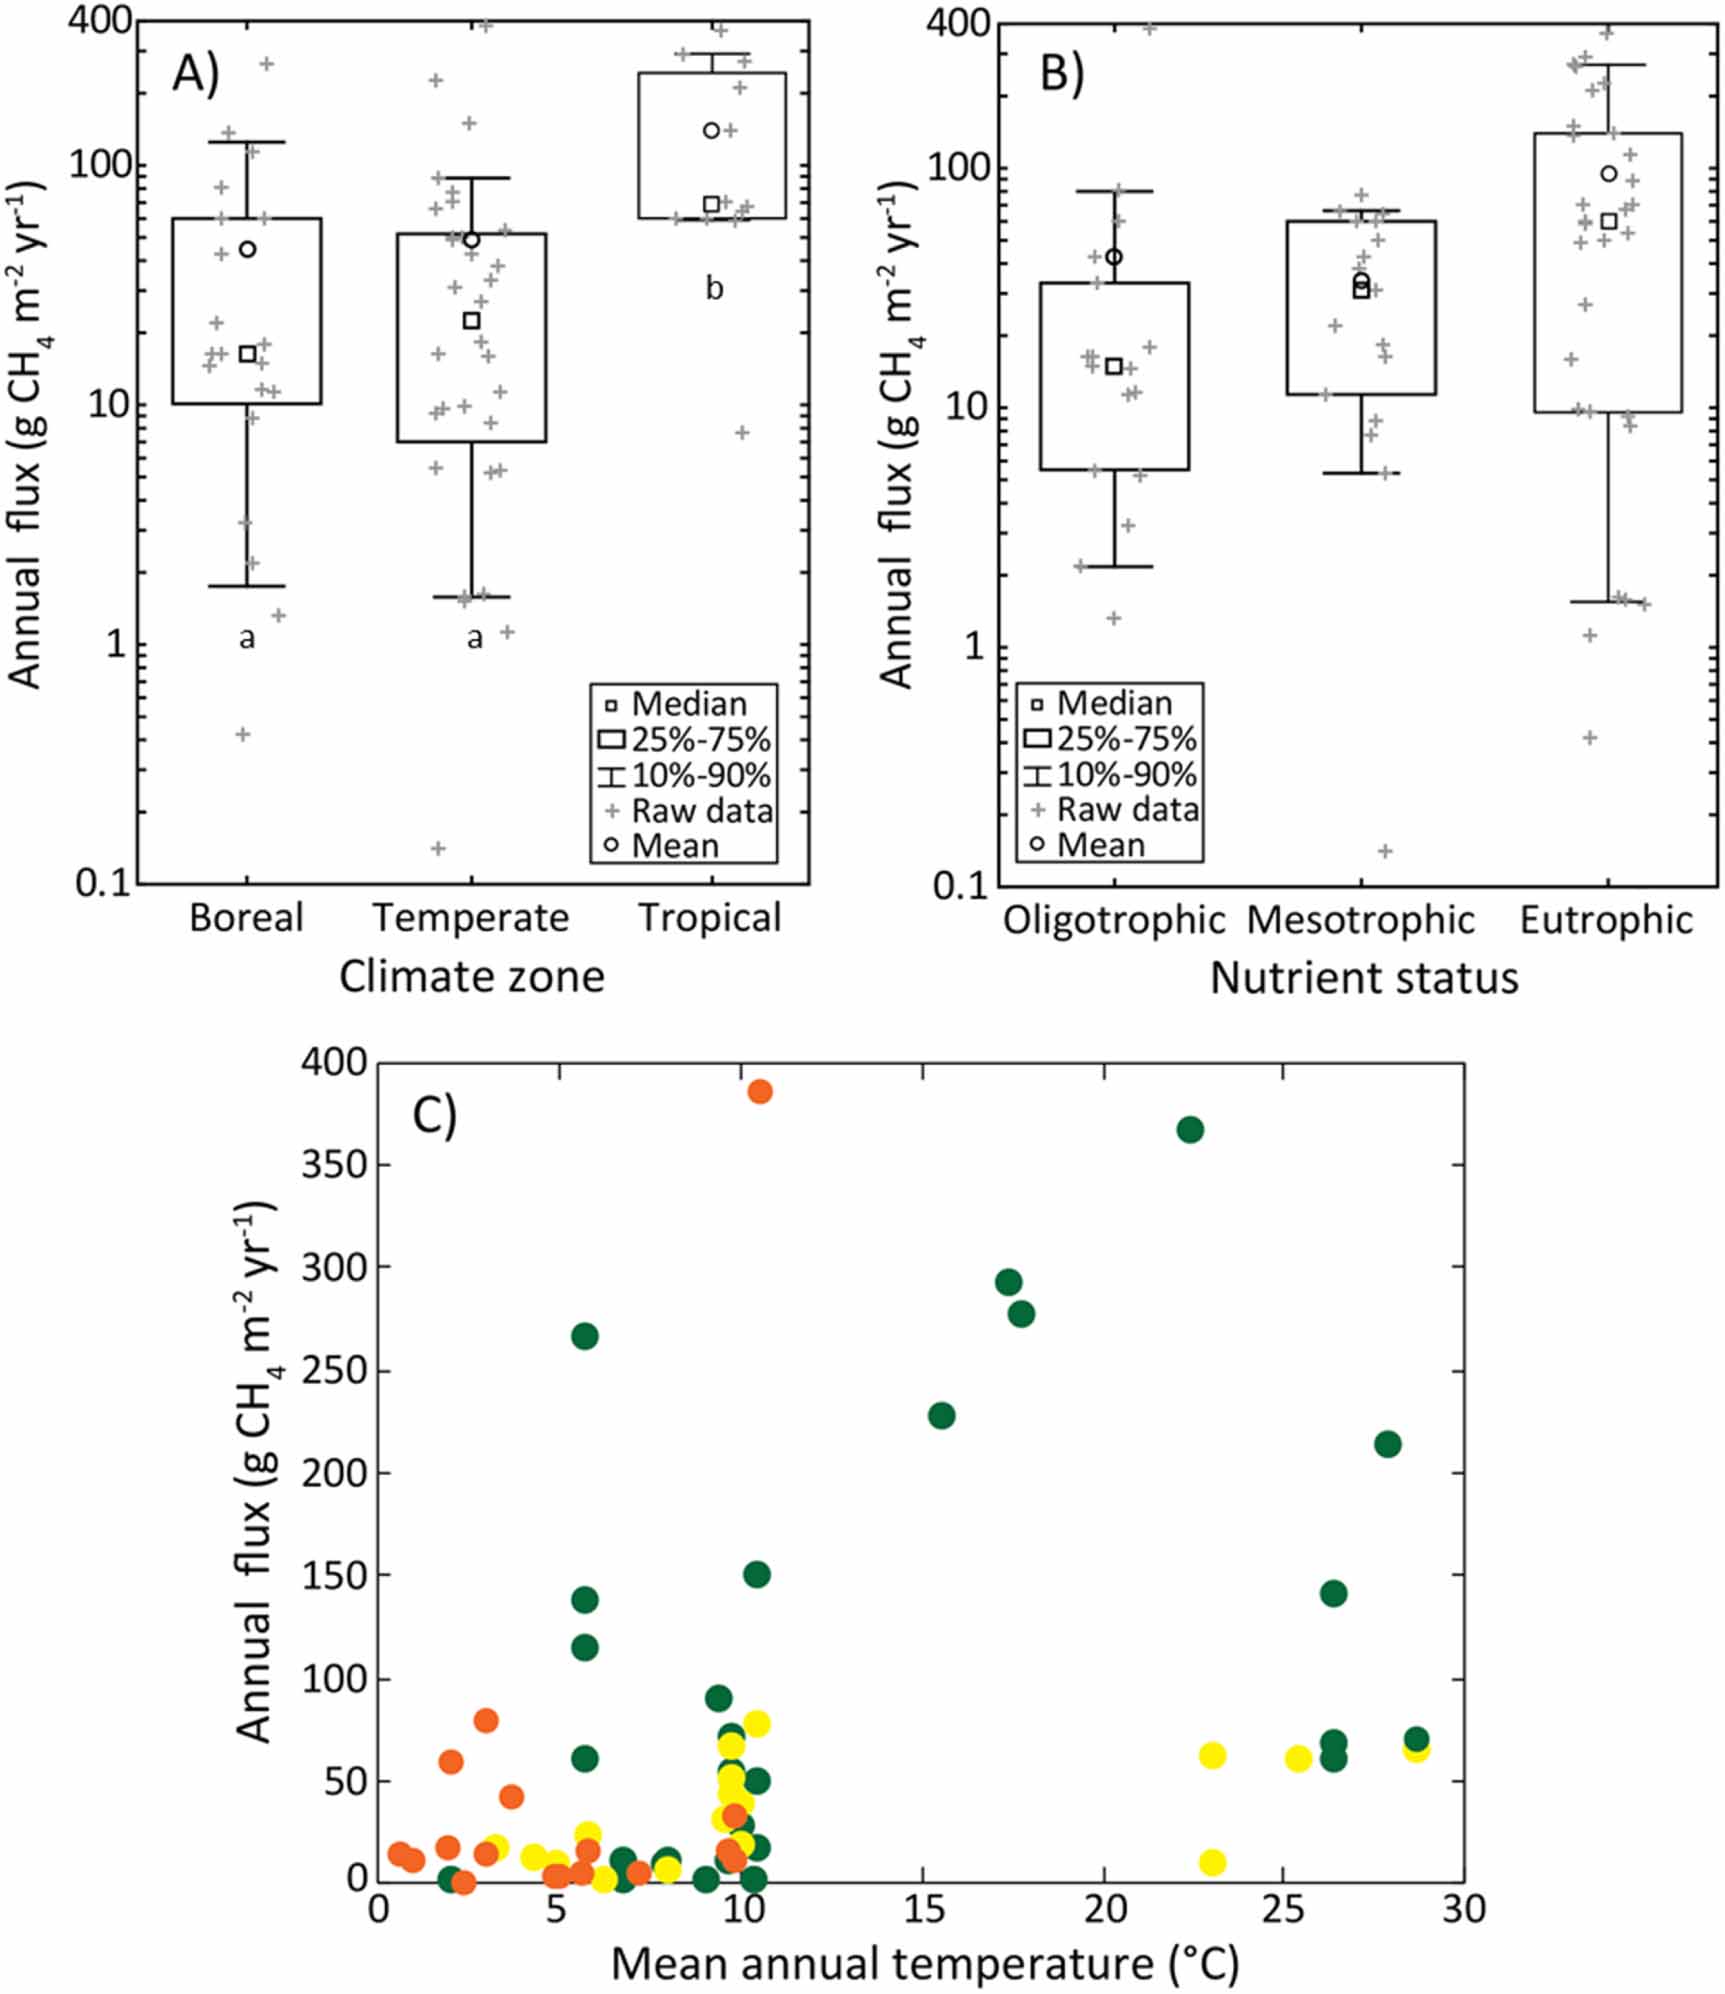
Reported CH4 fluxes ranged from 0.1 to 386 g CH4 m−2 yr−1 with a mean (±standard error) of 64.6 ± 11.1 g CH4 m−2 yr−1. Emissions from ditches in tropical and sub-tropical zones are significantly higher than those from temperate and boreal zones (figure 2(A)) and higher fluxes are associated with higher temperatures, as shown by a significant correlation between CH4 flux and temperature (figure 2(C)). Fluxes were significantly higher from continuously inundated ditches compared to intermittently dry ditches which can sometimes show negative fluxes (SI figure 1, SI text 8). There was no significant (p = 0.09) effect of nutrient status, but at sites where mean annual temperature (MAT) was above 15 °C eutrophic fluxes were noticeably higher (figure 2). Fluxes from eutrophic ditches also spanned the greatest range, with some eutrophic ditches exhibiting very low fluxes.
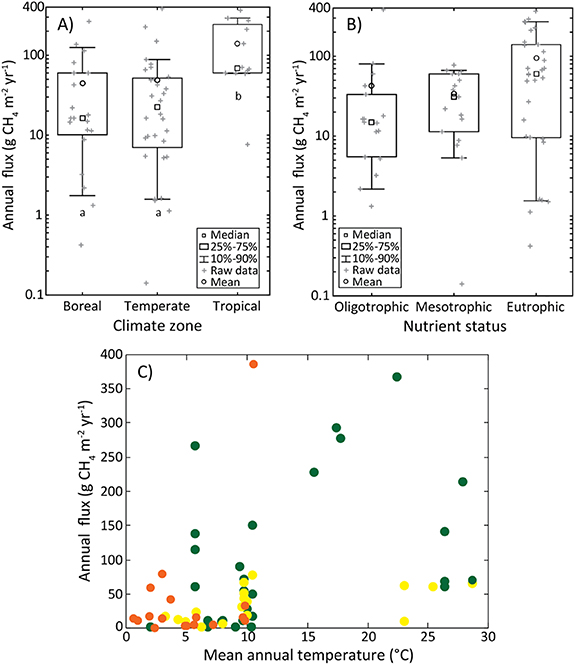
Figure 2. Mean annual CH4 emissions from ditches (table SI1) grouped according to climate zone (panel A), eutrophication status (panel B) and in relation to mean annual temperature and nutrient status (panel C). For panel A, lowercase letters show significant differences: between boreal and sub/tropical (test statistic = −19.8, p = 0.004) and temperate and sub/tropical (test statistic = −20.0, p = 0.001). For panel B, Kruskal–Wallis shows no significance (p = 0.089). For panel C, Spearman correlation coefficient = 0.48 (p < 0.001). Orange circles = oligotrophic, yellow = mesotrophic, green = eutrophic. Note that CH4 flux is presented on a log scale for panels A and B, but not C, and all statistical tests were performed on non-transformed data.
Download figure:
Standard image High-resolution imageDespite variation within each land-use category, mean fluxes tended to increase with increasing land use intensity in the order: natural land and forest ≈ peat extraction < low-intensity grassland < urban land < cropland ≈ high-intensity grassland (figure 3). Differences were significant between natural land and forest, and both cropland and high-intensity grassland.
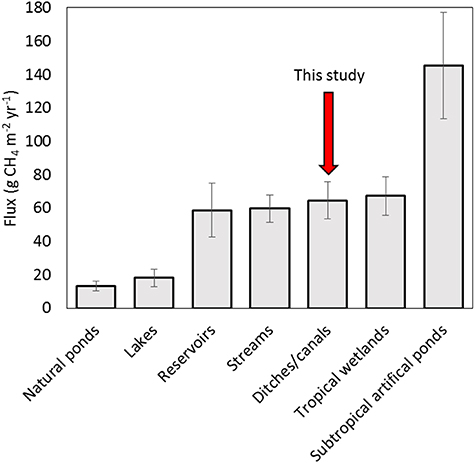
Figure 3. Comparison of mean annual fluxes from different freshwater systems. Data: natural ponds (n = 50)8, lakes (n = 96)10, reservoirs (n = 75)4, streams (n = 411)13, ditches/canals (n = 64) tropical wetlands (n = 54) [63] and subtropical artificial ponds (n = 33)9,14. Error bars show standard error of the mean. See SI text 6 for further detail.
Download figure:
Standard image High-resolution imageMore flux estimates were obtained from ditches draining peat soils (n = 50) compared to mineral soils (n = 14). There was no significant difference between the two groups, with means of 58 ± 11 g CH4 m−2 yr−1 and 87 ± 33 g CH4 m−2 yr−1 for ditches draining peat and mineral soils, respectively (Mann–Whitney U test, p = 0.91). We compared these ditch emissions against the reduction in terrestrial emissions following drainage, assuming that ditch surface areas occupy, on average, 3% of the landscape (so called Fracditch = 0.03), and find that, on average, ditch emissions equate to 4% (error = 2%–8%) and 18% (15%–22%) of the terrestrial CH4 reduction in mineral and peat soils respectively. The discrepancy in percentages between soil types arises primarily due to the large IPCC emission factors given for wetlands on mineral soils, which are substantially larger than fluxes from undrained peatlands.
3. Ditch emissions and upscaling
A comparison shows that, on an areal basis, ditches emit similar amounts of CH4 to reservoirs, streams and tropical wetlands (figure 4).

Figure 4. Mean annual log-transformed CH4 emissions from ditches across a range of land-use categories. Kruskal–Wallis test shows significant (test statistic = 13.6, p = 0.018) differences between land uses, and lowercase letters mark where significant pairwise comparisons were detected: p = 0.004 (test statistic = 21.3) for natural land and forest vs high intensity grassland, and p = 0.011 (test statistic = 17.7) for natural land and forest vs cropland. Note that statistical tests were performed on non-transformed data and that not all comparisons were performed (see section 5).
Download figure:
Standard image High-resolution image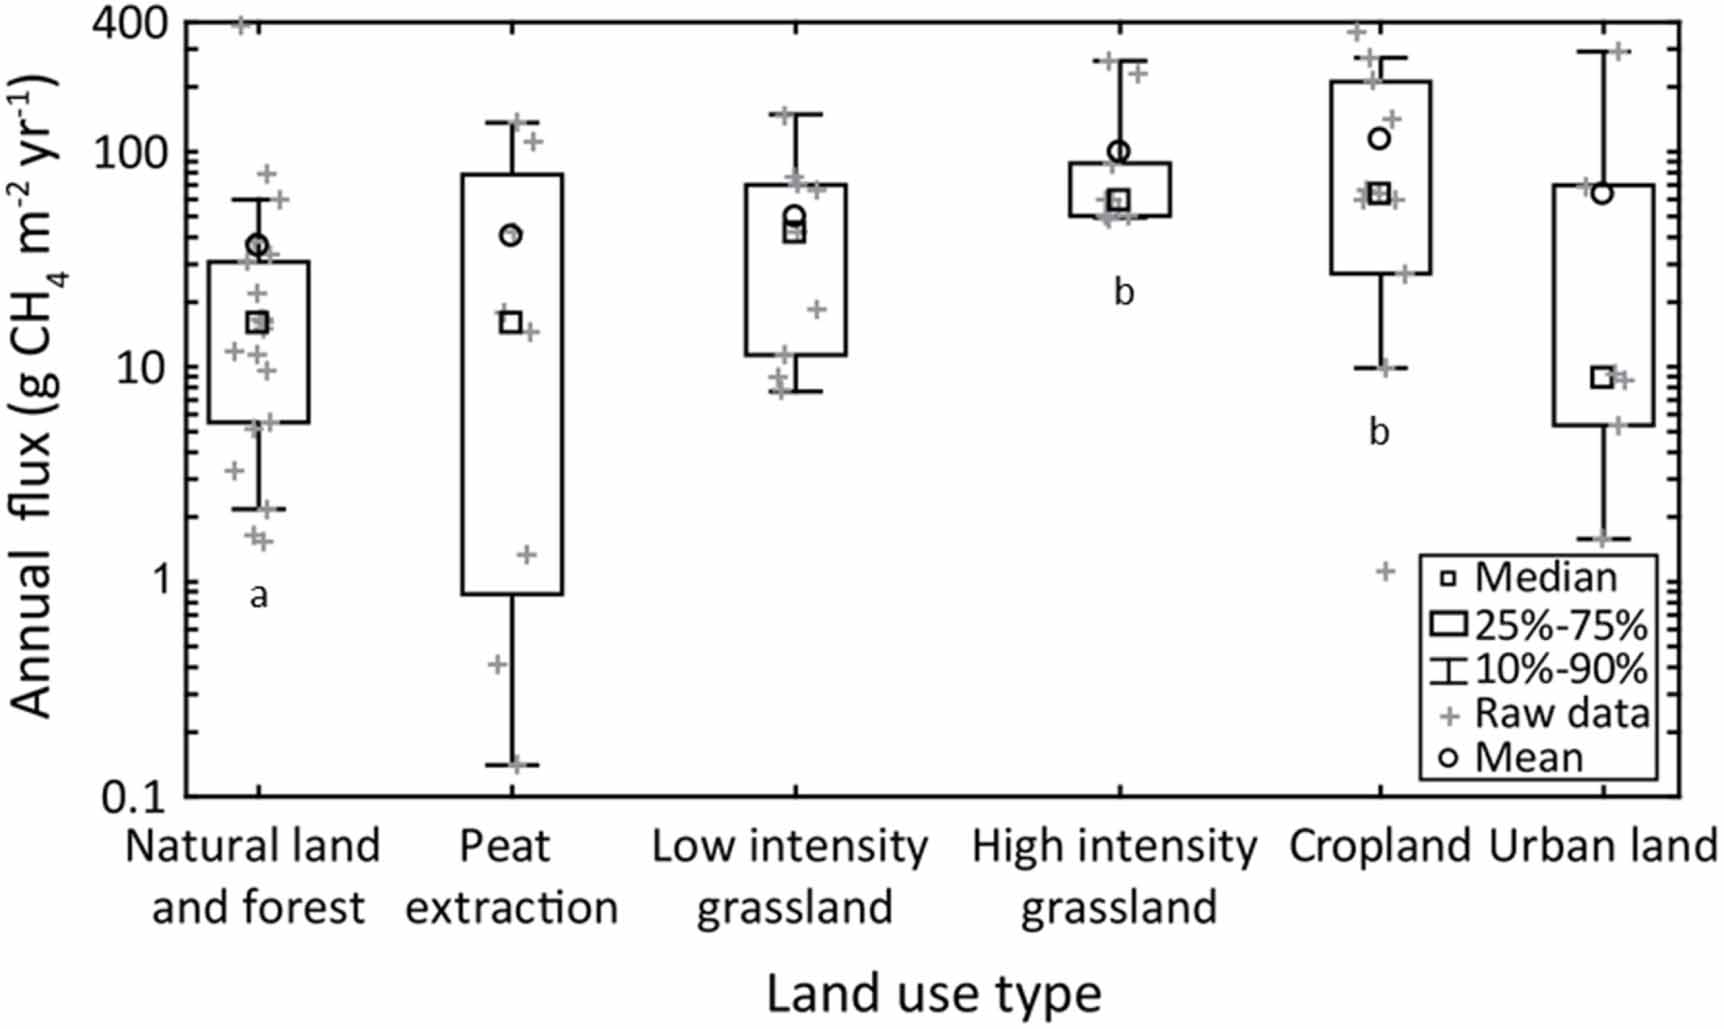
Ditches have been mapped and total lengths calculated for some countries [18, 22], but for many regions of the world there is a lack of data on ditch densities. Additionally, although our synthesised CH4 data covers a reasonable geographic spread, it is biased towards European and North American locations. Considering this, a detailed upscaling of global CH4 emissions (i.e. aggregating by land use, soil type, climate zone, etc) from ditches would be flawed. Instead, and with the aim of calling attention to the possible global magnitude of these emissions, we present a rough 'back of the envelope' upscaling. For this, we took the average annual flux from our dataset and a global estimate of drained land area, and calculated total ditch surface areas using values of drainage ditch areas from the IPCC [30] and literature searches. This gives a mean flux of 3.46 Tg yr−1 (0.61–10.5 Tg yr−1) (table 1).
Table 1. Estimated lower, middle and upper global CH4 emissions from drainage ditches. Lower and upper CH4 bounds are based on 95% CIs for flux. Fracditch is a measure of the proportion of the landscape area occupied by ditches, effectively a function of ditch spacing, configuration and width [31]. Fracditch estimates and areas of drained land are taken from the literature. See section 5 for further detail, including references.
| Lower | Middle | Upper | |
|---|---|---|---|
| Ditch flux (g CH4 m−2 y−1) | 42.7 | 64.6 | 97.7 |
| Total drained land (ha) | 142 102 750 | 178 447 500 | 214 792 250 |
| Fracditch | 0.01 | 0.03 | 0.05 |
| Total ditch area (ha) | 1 421 028 | 5 353 425 | 10 739 613 |
| Total ditch CH4 emission (Tg yr−1) | 0.6 | 3.5 | 10.5 |
| Global CH4 emission (Tg yr−1) | 572 | 572 | 572 |
| % global flux from ditches | 0.1 | 0.6 | 1.8 |
4. Discussion
Our analysis shows that mean areal ditch CH4 emissions are as large as those from other well characterised systems (inland waters and wetlands) that are considered to be important at national or global scales. Our global estimate is 3.5 Tg yr−1 (0.6–10.5 Tg yr−1) which is 0.1%–1.8% of global CH4 emissions or 1.0% (0.2%–2.9%) of global anthropogenic CH4 [11]. For comparison, our estimate is greater than emissions from permafrost soils (1 Tg yr−1) [11] which receive considerably more attention compared to 'dull as ditchwater' drainage channels. On a 20 year and 100 year time frame using a sustained-flux GWP [32], global emissions respectively equate to 332 and 156 Tg CO2 eq yr−1. Thus, ditch emissions shift the balance and reduce the expected CH4 sink from drained soils, which is estimated globally as 38 Tg CH4 yr−1 for all unsaturated oxic soils [11]. Ditch emissions could be even more important on a national scale. For example, in densely drained countries such as the Netherlands and Finland ditches could emit the equivalent of 7% and 9% of national anthropogenic CH4 emissions (see SI text 10).
Multiple studies now show that ditch emissions can dominate the CH4 budget of drained landscapes and, in some situations (e.g. if ditch density is high, or within-field water table is low) can outweigh any terrestrial CH4 uptake [33–35]. Evidence of high emissions from ditches within drained landscapes counters the commonly held view, previously embedded in IPCC land-use emissions reporting guidance [36], that drained landscapes have zero CH4 emissions (see SI text 11). Furthermore, a recent review of cropland drainage ignored the emissions from ditches and concluded that drainage could lead to a net reduction in CO2 equivalents, and thus have a beneficial impact on climatic warming [37] (although wetland drainage can enhance terrestrial CO2 and N2O emissions [30]). We acknowledge that ditch emissions can be implicitly included in landscape budgets measured by eddy covariance towers, assuming that the ditch network within the tower footprint is representative of that in the wider landscape, but assume this is an uncommon occurrence (see SI text 11). Instead, we have shown that omission of ditch CH4 emissions from landscape-scale GHG budgets will lead to underestimation of the overall global warming impact of drainage-based land management.
We found that ditch emissions increased with rising MAT, and that emissions were significantly higher in sub-tropical/tropical climate zones, reflecting the temperature-dependence of CH4 production [38]. Higher fluxes were also associated with more intensive land uses, such as cropland. Annual fluxes were lower from ditches that periodically dried out, and this is likely due to sediments become aerobic and inhibiting methanogenesis [23]. For sites with MAT above 15 °C, eutrophic ditches had higher fluxes but, surprisingly, no significant difference (p = 0.09) was found between mean fluxes from different nutrient statuses (although this may be due to a relatively small sample size resulting in an underpowered test). Taken together, we infer that CH4 emissions will tend to increase with temperature, in the absence of other biogeochemical constraints such as intermittent drying, low substrate supply, or a low nutrient status.
We consider our upscaled estimate to be conservative for the following reasons. Firstly, we did not quantify channel area in irrigated land or ditches in urban land. Secondly, our estimate is based on chamber measurements which typically do not include plant mediated fluxes, and may not capture ebullitive fluxes (see SI text 2) which are temporally and spatially highly variable [39]. We also note that ditches can emit CO2 and N2O [40] which further increase GHG forcing associated with drained landscapes [41]. N2O emissions may be particularly large from ditches in drained wetlands that have been converted to croplands and subjected to extensive nitrogen fertilization. However, at this stage, there are insufficient data to enable these emissions of CO2 and N2O to be upscaled [42].
Our work also carries limitations. Firstly, our synthesised data is biased towards ditches draining peat soils (n = 50) compared to mineral soils (n = 14). Thus, if there is a difference in ditch fluxes between the two soil groups our upscaling could also be biased. There was no significant difference in mean fluxes between the two groups and we also found studies where, although annual fluxes could not be calculated, there was evidence for large CH4 emissions from ditches in mineral soils. For example, an extremely high flux of 250 g CH4 m−2 d−1 was reported from a ditch on a dairy farm in the Netherlands [43] and a UK survey detected a biogenic CH4 hotspot near an urban canal [44]. There is therefore no reason to assume that emissions from mineral soils are smaller than those from peat soils, but future measurements of ditch fluxes on mineral soils should be a key priority to robustly test this assumption. It is feasible, however, that CH4 production pathways may vary: in situ production may dominate in well-drained mineral soils, whilst lateral inputs of CH4 into ditches are likely to also contribute in poorly-drained soils. A second limitation is the lack of information on ditch lengths and maps of drained land, which leads to a large uncertainty when upscaling. Note that the largest uncertainty in our calculations comes from ditch area: our upper estimate is ≈7.5 times larger than the lower, whilst for ditch CH4 flux the upper estimate is ≈2.3 times larger than the lower. Drained agricultural land, the majority of which is on mineral soils, occupies the largest cumulative area of drained land, but few measurements of Fracditch exist for this land (see SI text 7). Mapping ditch networks within this land should therefore by another key priority for future work. Thirdly, there is an absence of nighttime ditch CH4 measurements. It has been shown that CH4 concentrations in channelized eutrophic streams [45] and ditches [46] can be approximately double those of daytime concentrations, due to diel fluctuations in oxygen concentrations. If this is a widespread phenomenon in ditches then our calculated annual fluxes may be low. Fourthly, ditch CH4 measurements in boreal regions are often restricted to the growing season (SI table 1). Non-growing season emissions from shallow aquatic systems, marshes and peatlands in the boreal comprise, on average, 16% of annual emissions [47], and thus annual CH4 emissions from ditches may be underestimated in our synthesis. Finally, the effect of aquatic plants is uncertain. Emergent vegetation in streams can act as a pathway for CH4 emission and enhance sediment CH4 concentrations, whilst floating plant species can act to increase or decrease net aquatic CH4 emission depending on local conditions [48].
Increasing global populations and associated food and fibre demands are likely to lead to increased land drainage, ditch density and nutrient loadings [37]. Our results suggest that this will lead to significant increases in global ditch CH4 emissions. Ditch emissions may also increase under a warmer climate. However, there are opportunities to mitigate these emissions. Nutrient enrichment increases CH4 fluxes in other aquatic ecosystems such as lakes and reservoirs [4, 7], and there is no reason to assume that this effect does not occur in ditches. Reducing nutrient runoff into ditches may offer a pathway to mitigate CH4 emissions to the atmosphere, whilst also improving water quality, thereby enhancing human and aquatic ecosystem health. Adaptive design and maintenance of ditch networks might also be an option to limit emissions. For example, clearing vegetation would prevent plant-mediated emissions and additionally remove a source of labile carbon for methanogens, although we acknowledge a conflict here with the biodiversity value provided by ditch vegetation. Maintaining deep, stable water levels may also limit emissions by minimising the warming of sediments and thereby reducing CH4 production.
In some regions rewetting of drained wetlands is being pursued as a climate change mitigation measure. Rewetted sites often possess ditch networks that may be partially blocked or infilled, or that are still used for active hydrological management, and high CH4 fluxes have been measured from such ditches [49, 50]. If CH4 emissions from relict ditches are of a similar magnitude to emissions from the adjacent wetland area, as assumed by the IPCC [30], then this is not a cause for concern. However, for intermediately rewetted systems such as wet meadows and paludiculture, it is feasible that ditch emissions may make a significant contribution to the overall GHG balance of the restored landscape. At present, a lack of data means that no conclusions can be drawn on this topic, but it is a highly relevant area of scientific and policy uncertainty.
5. Materials and methods
5.1. Experimental design
Data on emissions of CH4 from ditches were collected by searching the published literature (including grey literature) and by collating unpublished data. Some studies did not use the term 'ditches' but maps or written descriptions suggested that this term was appropriate. For example, some studies measured 'streams' [51] or 'rivers' [52]. Contact with the authors confirmed which of their waterbodies could be regarded as ditches. In total, we gathered 52 studies and from these we extracted 75 flux estimates disaggregated by site. Different studies took different approaches in the number and type of sites measured. For instance, if one study reported data from two sites under different land-uses then these were assigned to their two respective categories. However, other studies sometimes measured more than one site under the same land-use category, but reported a single annual flux. For these studies, only one annual flux could be extracted and used in the analysis. For our synthesis, we adopted and expanded the categories of land-use from Evans [31]: natural land and forest (n = 21), peat extraction (n = 8), low-intensity grassland (n = 9), high-intensity grassland (n = 9), cropland (n = 11), and urban (n = 6). In many cases studies reported an annual flux, or an average flux that was representative for the annual period, which we then extracted, but for some sites we had to calculate annual fluxes using other methods (see SI text 3 and 5). Routine sampling can miss periods of high discharge which have been shown to be important hot moments for CH4 emissions from streams, and more so the greater the stream channel slope [53], but we assume that ditches generally have lower slopes than streams, due to the fact that waterlogged land (the typical target area for drainage ditches) occupies flatter landscapes. We categorized sites by trophic status using a published method [54] (see SI text 4) and obtained MAT from each study. If MAT was not given, we located the field site in Google Earth, and searched for the nearest town/city where we could find proxy MAT data online.
5.2. Comparison of terrestrial CH4 reduction and ditch CH4 emissions
We took the mean ditch emissions from our synthesis of 58 ± 11 g CH4 m−2 yr−1 and 87 ± 33 g CH4 m−2 yr−1 for ditches draining peat and mineral soils. We then calculated the mean drainage-induced decrease in terrestrial CH4 emissions. For undrained peat soils we assumed mean terrestrial emissions of 16 g CH4 m−2 yr−1 and 5.5 g CH4 m−2 yr−1 for northern [55] and tropical peatlands [30], respectively, giving an overall undrained peat mean of 10.7 g CH4 m−2 yr−1. From this we subtracted the mean emission from drained organic soils (excluding rice), given by the IPCC as 0.8 g CH4 m−2 yr−1, resulting in a drainage-induced mean terrestrial decrease of 9.9 g CH4 m−2 yr−1. For mineral soils we used the IPCC [30] data for rewetted inland mineral soils across all climate zones as a proxy for mean emission from undrained wetlands on mineral soils (note that the majority, n = 32, of these data are actually from natural wetlands, with n = 7 from created/restored wetlands), but we split the data into continuously inundated wetlands (mean = 96.5 g CH4 m−2 yr−1) and intermittently flooded wetlands (mean = 48.7 g CH4 m−2 yr−1). The IPCC [30] assumption is that these soils no longer emit CH4 when drained, therefore we assume that drainage leads to a complete cessation of terrestrial CH4 emissions. We then applied an average Fracditch value of 0.03 (see 'Global and National Ditch Emissions' discussion on Fracditch), with corresponding terrestrial land fraction as 0.97. The reduction in terrestrial flux, and ditch emission, are then weighted according to their respective fractions. This gives weighted ditch emissions of 1.4–2.1 g CH4 m−2 yr−1 and 1.6–3.6 g CH4 m−2 yr−1 for peat and mineral soils, respectively. When expressed as percentages offsetting the drainage-induced terrestrial reduction, the means and errors are: peat soil = 18% (15%–22%); drained intermittently flooded wetland on mineral soil = 5.5% (3.4%–7.6%); drained continuously inundated wetland on mineral soil = 2.8% (1.7%–3.8%).
5.3. Global and national ditch emissions
We used Finland and the Netherlands as case studies to estimate the importance of ditch emissions in densely drained countries. These countries were chosen as information is available on ditch lengths/drainage densities and CH4 fluxes. We upscaled by multiplying total ditch surface area, calculated using literature values [22, 56], by the mean ditch flux measured in each respective country (see SI text 10). Upscaled emissions were compared against national anthropogenic CH4 emissions [57].
For our global upscaling we combined estimates of CH4 emission, drained land area, and ditch surface area. We calculated total drained land as the sum of drained high-latitude peatland forestry (13 447 500 ha [58, 59]) and drained agricultural land (165 000 000 ha [37, 60]; smaller than other estimates, e.g. 190 000 000 ha [61]). Drained tropical peatland covers a moderately large area (7750 000 ha [62]) but the majority of this is used for oil palm (3055 000 ha) and smallholder farmland (3321 000 ha) [62]. To avoid double-counting we thus assume drained tropical peatland area is captured under total drained agricultural land. We used a 10% error margin on the area of drained high-latitude peatland forest land for upper and lower errors. For drained agricultural land we took lower and upper values of 130 000 000 ha and 200 000 000 from a recent study [37].
The fraction of ditches (Fracditch) is a measure of the proportion of the landscape area occupied by ditches/canals, effectively a function of ditch spacing, configuration and width [31]. Values of Fracditch were collated for peatland soils by the IPCC [30] in 2014. We searched the literature for more peatland values of Fracditch published since then, or that had been overlooked, and found 14 more values which we combined with the IPCC dataset, giving a total of 37 Fracditch values (SI table 4). Data for mineral soils are scarce and depend on studies reporting both drainage densities and ditch widths. We searched the literature and managed to collate 11 Fracditch values for mineral soils from nine studies (SI text 7, SI table 2). Fracditch ranged from 0.004 to 0.1, with most values being 0.01–0.03. For our upscaling we took 0.03 as an average Fracditch, and used 0.01 and 0.05 as lower and upper bounds.
For our emission estimate we took the mean ditch CH4 flux from the studies we collated (SI table 1). For our upper and lower ditch flux estimates, we used 95% confidence intervals calculated on the log-transformed CH4 flux data. We compared the global ditch emission against a global CH4 emission of 572 Tg yr−1 and a global anthropogenic emission of 357 Tg yr−1 [11].
5.4. Statistical analysis
Statistical analysis was performed using SPSS. We used the nonparametric Kruskal–Wallis test (2 sided), with inbuilt post hoc test, to test for differences in ditch flux between climate zone, land use, and nutrient status. For the land use test (figure 3) there were many potential pair wise comparisons. If all these were performed then any post-hoc correction would be overly conservative. We therefore used figure 3 to guide which comparisons to make, by looking at categories where visual differences (i.e. no/minimal overlap between fluxes) were apparent. Following this, we performed post-hoc tests for forest/semi natural vs cropland, and forest vs high intensity, with no correction. For the correlation between MAT and flux (figure 2(C)) we used Spearman correlation coefficients to test for monotonic relationships between variables.
Data availability statement
All data that support the findings of this study are included within the article (and any supplementary files).
Acknowledgments
No specific grant funded this work. MP acknowledges funding from Formas (Grant 2020-00950). DB contributions were supported by European Research Council (ERC) under the European Union's Horizon 2020 research and innovation programme (Grant Agreement No. 725546). JA acknowledges funding from Carl Tryggers Stiftelse. VG is grateful for support from the AXA Research Fund. We thank Marcus Klaus and Dongqi Wang for providing information on the sampling sites in their respective papers, and Frances Manning for providing data ahead of publication. We thank Jesper Rydén and Gareth Harvey for their advice on different approaches to statistically analysing the data. We thank Andy Baird and Sophie Green for providing ebullition data that were used in an earlier draft of this paper. We thank one anonymous reviewer and Tim Moore for their constructive review comments that helped to improve the manuscript.
Author contributions
The initial collation of ditch emission data was undertaken by CE as part of his contribution to the 2013 IPCC Wetland Supplement (Inland drained organic soils chapter), which was expanded by CM and MP for the Flooded Lands chapter of the Intergovernmental Panel on Climate Change 2019 Refinement to the 2006 Guidelines for National Greenhouse Gas Inventories (43), for which CL, CE, JH and DB were Lead Authors, and MP, SK and AG were Contributing Authors. MP, JA, AG, MK, SK, AJV contributed data. AG and MP created the figures. All authors searched for literature data and provided ideas. MP wrote the paper with input from all co-authors. The authors declare no competing interests.