

Abstract
Globally, approximately 3 billion primarily cook using inefficient and poorly vented combustion devices, leading to unsafe levels of household air pollution (HAP) in and around the home. Such exposures contribute to nearly 4 million deaths annually (WHO 2018a, 2018b ). Characterizing the effectiveness of interventions for reducing HAP concentration and exposure is critical for informing policy and programmatic decision-making on which cooking solutions yield the greatest health benefits. This review synthesizes evidence of in-field measurements from four cleaner cooking technologies and three clean fuels, using field studies aimed at reducing HAP concentration and personal exposure to health damaging pollutants (particulate matter (PM2.5) and carbon monoxide (CO)). Fifty studies from Africa, Asia, South and Latin America, provided 168 estimates synthesized through meta-analysis. For PM2.5 kitchen concentrations, burning biomass more cleanly through improved combustion stoves (ICS) with (n = 29; 63% reduction) or without (n = 12; 52%) venting (through flue or chimney) and through forced-draft combustion (n = 9; 50%) was less effective than cooking with clean fuels including ethanol (n = 4; 83%), liquefied petroleum gas (LPG) (n = 11; 83%) and electricity (n = 6; 86%). Only studies of clean fuels consistently achieved post-intervention kitchen PM2.5 levels at or below the health-based WHO interim target level 1 (WHO-IT1) of 35 μg m−3. None of the advanced combustion stoves (gasifiers) achieved WHO-IT1, although no evidence was available for pellet fuelled stoves. For personal exposure to PM2.5, none of the ICS (n = 11) were close to WHO-IT1 whereas 75% (n = 6 of 8) of LPG interventions were at or below WHO-IT1. Similar patterns were observed for CO, although most post-intervention levels achieved the WHO 24 h guideline level. While clean cooking fuel interventions (LPG, electric) significantly reduce kitchen concentrations and personal exposure to PM2.5 in household settings, stove stacking and background levels of ambient air pollution, have likely prevented most clean fuel interventions from approaching WHO-IT1. In order to maximize health gains, a wholistic approach jointly targeting ambient and HAP should be followed in lower-and-middle income countries.
Export citation and abstract BibTeX RIS

Original content from this work may be used under the terms of the Creative Commons Attribution 4.0 license. Any further distribution of this work must maintain attribution to the author(s) and the title of the work, journal citation and DOI.
1. Background
Globally, some 3 billion people burn solid fuels (e.g. wood, dung, charcoal) in inefficient and poorly vented combustion devices such as three-stone-fires or rudimentary stoves as their primary means of cooking (Bonjour et al 2013, IEA et al 2020). The resulting household air pollution (HAP) contributes to over 3.8 million premature deaths per year and almost 127 million disability-adjusted life-years from heart disease, stroke, chronic obstructive pulmonary disease and lung cancer, making it a leading risk factor for global morbidity and mortality (WHO 2018a, 2018b), as well as contributing to global climate warming (Lacey et al 2017).
In recognition of the need to support countries tackle the high disease burden attributed to polluting household energy use, the World Health Organization (WHO) issued the WHO guidelines for indoor air quality: household fuel combustion (WHO 2014) (hereafter the WHO guidelines). These WHO guidelines provide normative recommendations in the form of particulate matter (PM2.5) and carbon monoxide (CO) emission-rate performance targets for household energy devices (e.g. cookstoves) to achieve the WHO air quality annual and interim-1 PM2.5 guideline levels of 10 μg m−3 (0.01 mg m−3) and 35 μg m−3 (0.035 mg m−3) respectively, and the 24 h average air quality CO guideline of 7 mg m−3 (WHO 2006, 2010).
HAP concentrations of fine particulate matter are often several times higher than WHO guidelines, with global estimates for 24 h mean kitchen concentrations in wood-using homes ranging from ∼500 to 1000 μg m−3 (Balakrishnan et al 2014, Pope et al 2017). The interim PM2.5 air quality target was developed to provide an incremental step for air quality improvements in settings where it may be unrealistic to achieve guideline levels quickly. Considering the very high-levels of PM2.5 associated with inefficient cooking, the WHO interim target-1 (WHO IT-1) is referenced throughout this analysis.
Policies and programs supporting the promotion, sales and dissemination of lower emissions stoves and fuels have sought to mitigate this health burden. The policies and interventions range from large national efforts such as India's Pradhan Mantri Ujjwala Yojana program to increase access and use of liquefied petroleum gas (LPG) (Dabadge 2019, Tripathi and Sagar 2019), to artisan stove-makers building and selling relatively simple stoves to local populations (Hyman 1987, Orr et al 2015). Characterizing the effectiveness of these interventions on reducing HAP and associated exposures is critical for understanding which solutions are likely to result in the greatest health benefits. With increasing international focus on the importance of meeting Sustainable Development Goals 3 (ensure healthy lives and promote wellbeing for all at all ages) and 7 (universal access to affordable, reliable, modern energy by 2030) to address the substantial global health burden from reliance on polluting cooking, this review provides timely and crucial evidence.
Importantly, the path to clean household energy will include transitional steps as the cleanest options may not be feasible in many contexts due to infrastructure, resource, or other access constraints. In these cases, the cleanest possible solutions should be prioritized (WHO 2014). The impact of multiple stove use, or stove 'stacking', can have dramatic impacts as even nominal traditional stove use can substantially elevate HAP concentrations, and thus displacement of high emission stoves is as critical as the performance of the 'cleaner' technology or fuel (Johnson and Chiang 2015). Synthesizing the HAP and exposure evidence associated with household energy transitions is needed to inform smart policy, investment, and programmatic decisions and, in turn, expedite attainment of public health benefits from clean cooking.
While there have been efforts to systematically review and synthesize the effectiveness of household energy interventions (Balakrishnan et al 2014, Pope et al 2017, Quansah et al 2017), more evidence of different and promising interventions has recently become available. Newer technologies which aid combustion with forced-draft and/or pellet fuels, for example, have been introduced as interventions in sub-Saharan Africa, Asia, and elsewhere (e.g. Champion and Grieshop 2019, Hill et al 2019, Nightingale et al 2019). Additionally, interventions with gas and liquid fuels such as ethanol and LPG have also been evaluated (e.g. Alexander et al 2018, Bruce et al 2018, Delapena et al 2018, Clasen et al 2020), in addition to emerging studies of cooking with electricity providing more evidence of what exposure reductions can be achieved with these clean burning options (Pokhrel et al 2015, Ubuoh and Nwajiobi 2018, Tagle et al 2019).
This paper explicitly builds on the systematic review of household energy interventions presented in Pope et al (2017), augmenting the dataset to include these new studies. The Pope et al (2017) review concentrated on available evidence for solid fuels stoves with very limited information on clean fuels technologies, and performed a meta-analysis of the PM2.5 and carbon monoxide (CO) kitchen concentrations and personal exposures associated with those interventions. Here we add new research to summarize the evidence of the impact of various categories of stove and fuel combinations on kitchen concentrations and personal exposures of PM2.5 and CO. This review further establishes evidence for the interventions which have a longer history of evaluation (e.g. chimney and natural draft wood stoves (Kirby et al 2019, Young et al 2019)), and updates the synthesis to provide valuable new information on current and potentially more promising intervention scenarios such as LPG, alcohol and electric stoves.
2. Methods
This systematic review and meta-analysis adheres to the PRISMA guidelines for reporting and provides a comprehensive assimilation and synthesis of the current evidence base for field-based studies of HAP (PM2.5 and CO) from cleaner cooking technologies and fuels in lower-and-middle-income-country (LMIC) settings. The focus of the review is on the 'real-life' effectiveness of interventions, as distinct from studies conducted in artificial contexts such as laboratory-based studies based on emissions, field-based controlled cooking tests, or trials instructing exclusive use of an intervention. The review focussed on published and unpublished literature from 1998 to 2019, representing 30 years of intense activity in the field of HAP and prevention strategies.
A comprehensive search strategy was employed with searches across (a) the main bibliographic databases (PubMed, Ovid (Medline) and Scopus), (b) the grey literature (including environmental databases (Environment Complete, GreenFILE) and Google Scholar) and specialist relevant websites, (c) personal communication with stakeholders and research leads and (d) reference tracking of all included studies. All searches were conducted on 16 July 2020.
Search terms were refined for each bibliographic database and included a combination of index terms and free-text words. For Google Scholar, search terms included a combination of each stove/fuel type with 'indoor air' or 'household air' and the 1st 100 'hits' were reviewed. See supplementary information for the search terms used (available online at stacks.iop.org/ERL/16/083002/mmedia).
2.1. Study eligibility
2.1.1. Population
Populations from LMICs who predominantly rely on biomass, coal or kerosene as the primary baseline household energy source. All geographical contexts (urban, peri-urban or rural) were eligible. For personal exposure to HAP, measurements from both adults and children were included.
2.1.2. Interventions
The review broadly grouped interventions into cleaner cooking technologies and clean fuels, classified into seven categories. Cleaner cooking technologies included (a) 'improved' solid fuel stoves without venting (e.g. chimneys), (b) 'improved' solid fuel stoves with venting, (c) 'complex' interventions including multiple components (e.g. stove modifications, smoke hoods), and (d) advanced combustion solid fuel stoves (e.g. stoves with a fan to aid combustion or that use a modified biomass fuel (e.g. pellets)). Clean fuels included (a) alcohol fuels, (b) gas (LPG, biogas, natural gas) and (c) electricity.
2.1.3. Comparison
Solid fuels, biomass or kerosene used for cooking in open fires or traditional stoves.
2.1.4. Outcome
Quantitative measurements of HAP containing respirable particulate matter (PM < 10 µms) and/or CO. Measurements needed to represent at least one full day of cooking (sampling HAP for at least 24 h (±2 h)); studies with less than 22 h duration were excluded as not representing daily time-weighted averages. For both pollutants, measurement of concentrations (levels in kitchens) and personal exposure (measured in adults and/or children) were included. For each study/intervention it was therefore possible to have up to four estimates of HAP: kitchen PM, kitchen CO, personal PM and personal CO.
Eligible study designs included randomized controlled trials (RCTs), before-and-after studies with or without a control group and cross-sectional study designs. For before-and-after studies, only intervention group data were used due to the majority not having a control comparison group.
2.2. Study selection
Titles and abstracts and literature identified from unpublished sources (grey literature and websites) were checked for relevance by two of the review team (N F and R L). The full texts of those potentially meeting the inclusion criteria were screened by four of the review team (N F, R L, K J, and M J) and independently assessed by an additional reviewer (D P). Those clearly not meeting the inclusion criteria were excluded. At each stage of filtering 20% verification was undertaken independently by two reviewers with any discordant decisions being reconciled amongst the review team.
Data extraction was conducted using bespoke pre-piloted forms recording author, year, country, season (where applicable), baseline stove and fuel, intervention stove and fuel, study design, duration of follow up, number of homes assessed, analytical or sampling approach, sampling period, baseline and post-intervention data on kitchen concentrations of and personal exposure to PM and CO (mean and standard deviation, where available). One reviewer (one of N F, R L, K J and M J) completed each data extraction form with 20% verification through double extraction with another reviewer-discrepancies being resolved through discussion.
Quality appraisal was assessed using tools developed by the Department of Public Health and Policy, University of Liverpool (Liverpool Quality Assessment Tools (LQATs)) (Pope et al 2016). The tools have been used extensively across a wide range of health outcomes (Rehfuess et al 2013, Bruce et al 2015, Garn et al 2017, Ronzi et al 2018) and were the quality assessment instrument selected for systematic review chapters informing the WHO guidelines (Bruce et al 2014, Diekman et al 2014, WHO 2014). The LQATs allow appraisal of multiple study designs and assign a star rating for methodological quality relating to reduced risk of bias (selection, response, follow-up and measurement), risk of confounding (balance of randomization and adjustment) and increased accuracy of measurements of exposure and outcome. The star rating can then be used to assess a quality percentage based on the number of awarded stars out of the total available for a specific design. Quality appraisal was undertaken independently by two reviewers (N F and R L) for each included study.
2.3. Statistical analysis
Meta-analyses were conducted for the four distinct HAP outcomes: kitchen PM concentrations (in mg m−3), kitchen CO concentrations (in ppm), personal PM exposure (mg m−3) and personal CO exposure (ppm). Pooling of data required both estimates (means and standard deviations) of baseline concentrations/exposure and intervention concentrations/exposure. Standard deviations were calculated from confidence intervals or p-values if they were not readily available. Medians and geometric means were infrequently reported by the studies and were not included in the synthesis, despite often skewed distributions. Generic inverse variance meta-analyses using the Cochrane Collaboration's RevMan software version 5 (www.cc-ims.net/RevMan) were used to obtain pooled absolute mean differences (e.g. intervention levels minus baseline levels) and confidence intervals for each outcome. Statistical heterogeneity for each meta-analysis was assessed through the I-squared test with random-effects meta-analyses (Der Simonian and Laird 1986) being used for a test value greater than 20%.
In total seven meta-analyses were possible for each of the four HAP outcomes based on cleaner technology (n = 4) and clean fuel (n = 3) intervention categories, where data was sufficient for pooling. Each meta-analysis was presented in the form of a Forest Plot and was assessed for potential publication bias through measurement of funnel plot asymmetry (this was done graphically and statistically with Begg's (Begg and Mazumdar 1994) and Egger's (Egger et al 1997) hypothesis testing).
Additional quantitative syntheses of intervention impacts were conducted including (a) calculations of percentage reductions in HAP (based on weighted mean reductions of the four HAP outcomes) for each of the seven intervention groups and (b) plots of baseline (no intervention) and intervention levels of the four HAP outcomes against a reference for the WHO iar quality guideline (AQG) level for PM2.5 (IT1 35 μg m−3) and for CO (24 h target of 7 mg m−3 converted to a value of 6.11 ppm using the formula ppm= (mg m−3 value) × (24.45)/(molecular weight = 28.01), and assuming a temperature of 25 °C and a pressure of 1 atmosphere) for each of the seven intervention groups.
2.4. Review results
The systematic review process yielded a total of 50 studies (168 estimates) to be included in the evidence synthesis (figure 1). The number of studies included in this review (19 additional studies (59 estimates)) increased by 60% from the previous review by Pope et al (2017) (31 studies (109 estimates)).
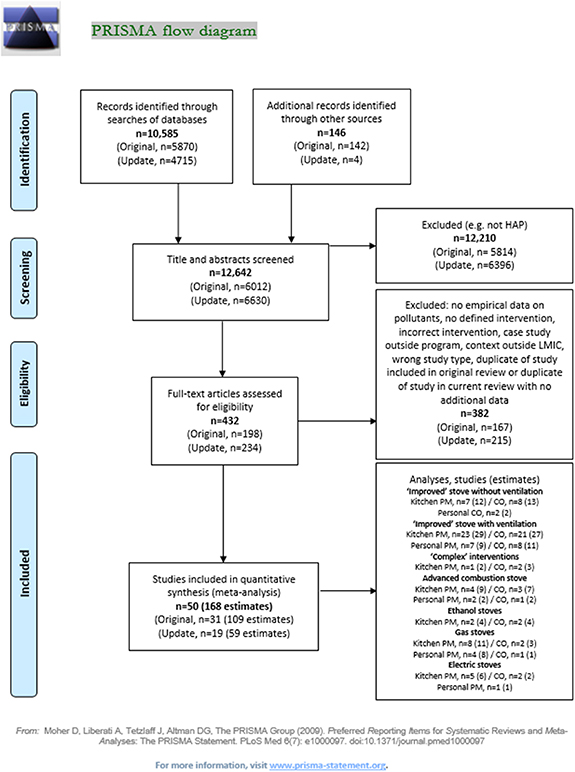
Figure 1. PRISMA flow chart. Adapted from BMJ (2021). CC BY 4.0. Note: Original = studies from Pope et al (2017) (up to 31/12/2015). Update = additional studies from 1/1/2016.
Download figure:
Standard image High-resolution imageIn terms of the four HAP outcomes, for kitchen concentrations there were 39 studies (73 estimates) with PM2.5 and 32 studies (59 estimates) with CO; and for personal exposure there were 13 studies (20 estimates) for PM2.5 and 12 studies (16 estimates) with CO. The study characteristics for each intervention type with information relating to the context of HAP measurement including country, study season, design, duration, parameters measured and quality assessment are presented in tables 1–7.
Table 1. Summary of included studies: improved cookstoves without venting (ICS—no vent).
| ICS (without venting) | |||||||||
|---|---|---|---|---|---|---|---|---|---|
| Kitchen concentration | Personal exposure | ||||||||
| Author; year | Country (season) | Baseline: intervention | Study design | Duration of follow-up | PM2.5 | CO | PM2.5 | CO | Quality assessment |
| Hankey (2015) | Uganda (June–August, dry season) | Traditional/three-stone fire: rocket wood (Ugastove) | Before and after | 1 month | ✓ 48 h | ✓ 48 h | ✗ | ✗ | 5/10 stars (50.0%) |
| Ochieng (2017) | Kenya | Traditional/wood: rocket mud stove | Before and after | 10 months | ✗ | ✓ 48 h | ✗ | ✓ 48 h | 7/12 stars (58.3%) |
| Rosa (2014) | Rwanda | Traditional/: wood burning rocket stove | RCT | 5 months | ✓ 24 h | ✗ | ✗ | ✗ | 6/10 stars (60.0%) |
| Sambandam et al (2015) | India | Traditional/biomass (mainly wood or dung): Envirofit-B1200 biomass natural-draft rocket stove | Before and after | 1–6 months | ✓ 24 h | ✓ 24 h | ✗ | ✗ | 5/10 stars (50.0%) |
| Traditional/biomass (mainly wood or dung): Envirofit-G3300 biomass natural-draft rocket stove | Before and after | 1–6 months | ✓ 24 h | ✓ 24 h | ✗ | ✗ | |||
| Traditional/biomass (mainly wood or dung): Prakti–Leo biomass natural-draft rocket stove | Before and after | 1–6 months | ✓ 24 h | ✓ 24 h | ✗ | ✗ | |||
| Brant (2012) | India | Traditional/wood, dung: B1100-rocket | Before and after | 5 and 6 months | ✓ 24 h | ✓ 24 h | ✗ | ✗ | 9/12 stars (75.0%) |
| Traditional/wood, dung: Mangala one-pot | ✓ 24 h | ✓ 24 h | ✗ | ✗ | |||||
| Traditional/wood, dung: Mangala two-pot | ✓ 24 h | ✓ 24 h | ✗ | ✗ | |||||
| Traditional/wood, dung: S2100-rocket | ✓ 24 h | ✓ 24 h | ✗ | ✗ | |||||
| CEIHD (2006) | Ghana | Traditional/biomass: enterprise works/ VITA Gyapa Rocket | Before and after | <6 months | ✓ 24 h | ✓ 24 h | ✗ | ✗ | 8/12 stars (66.7%) |
| Dutta et al (2007) | India | Traditional/wood, dung: Bhagyalaxmi | Before and after | 12 months | ✓ 48 h | ✓ 24 h | ✗ | ✗ | 8/12 stars (66.7%) |
| Ochieng (2013) | Kenya | Traditional/biomass: GIZ mud rocket | Cross-sectional | 10 months | ✓ 48 h | ✓ 48 h | ✗ | ✗ | 7/9 stars (77.8%) |
| Pennise (2007) | Uganda | Traditional/wood, dung: UCEODA rocket | Before and after | 1 month to 1 year | ✓ 24 h | ✓ 24 h | ✗ | ✗ | 6/12 stars (50.0%) |
Table 2. Summary of studies included in the systematic review: ICS with venting (ICS—vent).
| ICS (with venting) | |||||||||
|---|---|---|---|---|---|---|---|---|---|
| Kitchen concentration | Personal exposure | ||||||||
| Author; year (reference) | Country (season) | Baseline: intervention | Study design | Duration of follow-up | PM2.5 | CO | PM2.5 | CO | Quality assessment |
| Alexander (2015) | Bolivia | Traditional/biomass: Yanayo stove | Before and after | 12 months | ✓ 24 h | ✗ | ✗ | ✗ | 8/10 stars (80.0%) |
| Binaya (2017) | Nepal | Traditional/biomass: two-pot mud ICS | Cross-sectional | Not described | ✓ 24 h | ✓ 24 h | ✓ 24 h | ✓ 24 h | 7/11 starts (63.6%) |
| Young et al (2019) | Honduras | Traditional/biomass: rocket with chimney | Cross-sectional | Not described | ✓ 24 h | ✗ | ✓ 24 h | ✗ | 8/11 stars (72.7%) |
| Zaman et al (2017) | Bangladesh | Traditional/biomass: Earthen stove | Quasi RCT | 6 months | ✗ | ✗ | ✓ 24 h | ✗ | 4/10 stars (40.0%) |
| Albalak et al (2001) | Guatemala | Traditional/biomass: Plancha | Cross-sectional | Several years | ✓ PM3.5 24 h | ✗ | ✗ | ✗ | 5/7 stars (71.4%) |
| Alexander et al (2013) | Bolivia | Traditional biomass: Yanayo stove | Before and after | 12 months | ✗ | ✓ 48 h | ✗ | ✗ | 8/12 stars (66.7%) |
| Brant et al (2012) | India | Traditional/wood, dung: Mangala two-pot chimney | Before and after | 5 and 6 months | ✓ 24 h | ✓ 24 h | ✗ | ✗ | 9/12 stars (75.0%) |
| Bruce et al (2004) | Guatemala | Traditional/biomass: Plancha | Cross-sectional | Several years | ✗ | ✓ 24 h | ✗ | ✓ 24 h | 8/11 stars (72.7%) |
| Chengappa (2007) | India (winter) | Traditional/wood, dung: DA two-pot with chimney | Before and after | 12 months | ✗ | ✓ 48 h | ✗ | ✗ | 7/12 stars (58.3%) |
| India (summer) | Traditional/wood, dung: DA two-pot with chimney | Before and after | 12 months | ✓ 48 h | ✓ 48 h | ✗ | ✗ | 7/12 stars (58.3%) | |
| Chowdhury (2012) | Bangladesh | Traditional/biomass: BCSIR stove | Cross-sectional | Not described | ✓ 24 h | ✓ 24 h | ✗ | ✗ | 7/9 stars (77.8%) |
| Clark et al (2013) | Nicaragua | Traditional/biomass: Prolena eco-stove | Before and after | 9–12 months | ✓ 48 h | ✓ 48 h | ✗ | ✓ 48 h | 9/12 stars (75.0%) |
| Cowlin ( 2005 a) | Mongolia | Traditional/coal: G2-2000 | Cross-sectional | 6+ months | ✓ 24 h | ✓ 24 h | ✗ | ✗ | 8/9 stars (88.9%) |
| Traditional/coal: TT03 | ✓ 24 h | ✓ 24 h | ✗ | ✗ | |||||
| Cynthia (2008) | Mexico | Traditional/biomass: Patsari | Before and after | 1 month | ✓ 48 h | ✓ 24 h | ✓ 24 h | ✓ 24 h | 11/16 stars (68.8%) |
| Dutta et al (2007) | India | Traditional/wood, dung: ARTI Laxmi | Before and after | 12 months | ✓ 48 h | ✓ 48 h | ✗ | ✗ | 8/12 stars (66.7%) |
| Edwards (2007) | China | Traditional/biomass: NISP | Cross-sectional | Several years | ✓ PM4 22 ± 1 h (⩾20) | ✓ 24 h | ✗ | ✗ | 6/9 stars (66.7%) |
| ENPHO (2008) | Dolakha Nepal | Traditional/biomass: Mudbrick ICS | Before and after | <3 months | ✓ 24 h | ✓ 24 h | ✗ | ✗ | 7/12 stars (58.3%) |
| ENPHO (2008) | Dang Nepal | Traditional/biomass: Mudbrick ICS | Before and after | <3 months | ✓ 24 h | ✓ 24 h | ✗ | ✗ | 7/12 stars (58.3%) |
| ENPHO (2008) | Ilan Nepal | Traditional/biomass: Mudbrick ICS | Before and after | <3 months | ✓ 24 h | ✓ 24 h | ✗ | ✗ | 7/12 stars (58.3%) |
| Hartinger et al (2013) | Peru | Traditional/biomass: optima | Cross-sectional | 6–8 months | ✓ 48 h | ✓ 48 h | ✓ 48 h | ✓ 48 h | 8/11 stars (72.7%) |
| ITDG (2005) | Nepal (winter) | Traditional/biomass: smoke hood | Before and after | 12 months | ✓ 24 h | ✓ 24 h | ✗ | ✗ | 10/14 stars (71.4%) |
| Nepal (summer) | Traditional/biomass: smoke hood | Before and after | 12 months | ✓ 24 h | ✓ 24 h | ✗ | ✗ | 10/14 stars (71.4%) | |
| ITDG (2007) | Nepal | Traditional/biomass: smoke hood | Before and after | 6–9 months | ✗ | ✓ 24 h | ✗ | ✗ | 10/14 stars (71.4%) |
| Lam et al (2012) | Honduras | Traditional/biomass: ECO biomass stove | Before and after | 3 weeks | ✓ 24 h | ✗ | ✗ | ✗ | 8/12 stars (66.7%) |
| Li (2011) | Peru (winter) | Traditional/biomass: HNP three-pot metal stove | Before and after | 3 weeks | ✓ 48 h | ✓ 24 h | ✓ 24 h | ✓ 24 h | 8/12 stars (66.7%) |
| Traditional/biomass: BGC three-pot metal stove | ✓ 48 h | ✓ 24 h | ✓ 24 h | ✓ 24 h | |||||
| Matsumura (2011) | Peru | Traditional/biomass: GIZ two-pot design | Cross-sectional | 1 and 2 months | ✓ 24 h | ✓ 24 h | ✗ | ✗ | 3/9 stars (33.3%) |
| Naeher (2001) | Guatemala | Traditional/biomass: Plancha | Cross-sectional | Several years | ✓ 24 h | ✓ 24 h | ✗ | ✓ 24 h (mothers and children) | 5/9 stars (55.6%) |
| PAC (2011) | Madagascar | Traditional/biomass: Fatana pipa one-pot | Before and after | 5 months | ✓ 24 h | ✓ 24 h | ✗ | ✗ | 13/14 stars (92.9%) |
| Singh (2012) | Nepal | Traditional/biomass: two-pot mud ICS | Before and after | 12 months | ✓ 24 h | ✓ 24 h | ✗ | ✗ | 7/12 stars (58.3%) |
| Smith et al (2010) | Guatemala | Traditional/biomass: Plancha | RCT | 18 months | ✗ | ✓ 24 h | ✗ | ✓ 48 h (mothers and childen) | 12/12 stars (100%) |
| Terrado et al (2005) | Nicaragua | Traditional/biomass: ecostove (closed) | Before and after | 1 and 2 months | ✓ 24 h | ✗ | ✓ 24 h | ✗ | 9/12 stars (75.0%) |
| — | — | Traditional/biomass: ecostove (semi-closed) | — | — | ✓ 24 h | ✗ | ✓ 24 h | ✗ | |
| Winrock (2008) | Peru | Traditional/biomass: rocket with chimney | Before and after | 12 months | ✓ 24 h | ✗ | ✗ | ✗ | 6/12 stars (50.0%) |
Table 3. Summary of studies included in the systematic review: complex interventions.
| Complex interventions | |||||||||
|---|---|---|---|---|---|---|---|---|---|
| Kitchen concentration | Personal exposure | ||||||||
| Author; year (reference) | Country (season) | Baseline: intervention | Study design | Duration of follow-up | PM2.5 | CO | PM2.5 | CO | Quality assessment |
| ITDG (2005) | Kenya (wet season) | Traditional/biomass: hood, LPG, improved, vent, fireless cookstove | Before and after | 12 months | ✓ PM4 24 h | ✓ 24 h | ✗ | ✗ | 10/14 stars (71.4%) |
| Kenya (dry season) | Traditional/biomass: hood, LPG, improved, vent, fireless cookstove | Before and after | 12 months | ✓ PM4 24 h | ✓ 24 h | ✗ | ✗ | 10/14 stars (71.4%) | |
Table 4. Summary of studies included in the systematic review: advanced combustion stoves.
| Advanced combustion solid fuel stoves | |||||||||
|---|---|---|---|---|---|---|---|---|---|
| Kitchen concentration | Personal exposure | ||||||||
| Author; year (reference) | Country (season) | Baseline: intervention | Study design | Duration of follow-up | PM2.5 | CO | PM2.5 | CO | Quality assessment |
| Balakrishnan (2015) | India (summer) | Traditional/wood, dung: Phillips-HD4012-forced draft biomass micro gasifier stove | Before and after | 9–12 months | ✓ 24 h | ✓ 24 h | ✓ 24 h | ✓ 24 h | 5/12 stars (41.7%) |
| India (winter) | Traditional/wood, dung: Phillips-HD4012-forced draft biomass micro gasifier stove | 1–3 months | ✓ 24 h | ✓ 24 h | ✓ 24 h | ✓ 24 h | |||
| Hill et al (2015) | Lao People's Democratic Republic | Traditional/biomass: ACE 1 ultra-clean biomass cookstove | Before and after | 2 weeks | ✓ 48 h | ✗ | ✓ 48 h | ✗ | 7/12 stars (58.3%) |
| Sambandam et al (2015) | India | Traditional/biomass (mainly wood or dung): Phillips-natural draft biomass micro gasifier stove | Before and after | 1–6 months | ✓ 24 h | ✓ 24 h | ✗ | ✗ | 5/10 stars (50.0%) |
| Traditional/biomass (mainly wood or dung): Phillips-HD4012-forced draft biomass micro gasifier stove | Before and after | 1–6 months | ✓ 24 h | ✓ 24 h | ✗ | ✗ | |||
| Traditional/biomass (mainly wood or dung): Oorja biomass forced-draft micro gasifier stove | Before and after | 1–6 months | ✓ 24 h | ✓ 24 h | ✗ | ✗ | |||
| Balakrishnan (2012) | India | Traditional/biomass: free convection | Before and after | Not available | ✓ ns | ✓ ns | ✗ | ✗ | 8/12 stars (66.7%) |
| Traditional/biomass: forced convection/optimised fuel | ✓ ns | ✓ ns | ✗ | ✗ | |||||
| Traditional/biomass: forced convection | ✓ ns | ✓ ns | ✗ | ✗ | |||||
Table 5. Summary of studies included in the systematic review: ethanol stoves.
| Ethanol stoves | |||||||||
|---|---|---|---|---|---|---|---|---|---|
| Author; year (reference) | Country (season) | Baseline: intervention | Study design | Duration of follow-up | Kitchen concentration | Personal exposure | Quality assessment | ||
| PM2.5 | CO | PM2.5 | CO | ||||||
| CEIHD (2007a) | Ethiopia, Kebribeyah | Traditional/biomass: ethanol stove | Before and after | Not specified | ✓ 24 h | ✓ 24 h | ✗ | ✗ | 7/12 stars (58.3%) |
| CEIHD (2007b) | Ethiopia, Bonga | Traditional/biomass: ethanol stove | Before and after | Not specified | ✓ 24 h | ✓ 24 h | ✗ | ✗ | 7/12 stars (58.3%) |
| PAC (2011) | Madagascar, Vatomandry | Traditional/biomass: cleancook ethanol stove | Before and after | 5 months | ✓ 24 h | ✓ 24 h | ✗ | ✗ | 13/14 stars (92.9%) |
| PAC (2011) | Madagascar, Ambositra | Traditional/biomass: cleancook ethanol stove | Before and after | 7 months | ✓ 24 h | ✓ 24 h | ✗ | ✗ | 13/14 stars (92.9%) |
Table 6. Summary of studies included in the systematic review: LPG stoves.
| LPG interventions | |||||||||
|---|---|---|---|---|---|---|---|---|---|
| Kitchen concentration | Personal exposure | ||||||||
| Author; year | Country (season) | Baseline: intervention | Study design | Duration of follow-up | PM2.5 | CO | PM2.5 | CO | Quality assessment |
| Delapena (2018) | Ghana | Traditional/wood: LPG | Cross-sectional | Not specified | ✓ 48 h | ✗ | ✗ | ✗ | 4/9 stars (44.4%) |
| Gautam et al (2018) | India | Traditional/biomass: LPG | Cross-sectional | Not specified | ✗ | ✗ | ✗ | ✓ 24 h | 6/9 stars (66.7%) |
| HAPIN (2020a) | Guatemala | Traditional/biomass: LPG | RCT | 2 months | ✓ 24 h | ✗ | ✓ 24 h | ✗ | 8/12 stars (66.7%) |
| HAPIN (2020b) | India | Traditional/biomass: LPG | RCT | 2 months | ✓ 24 h | ✗ | ✓ 24 h | ✗ | 8/12 stars (66.7%) |
| HAPIN (2020c) | Rwanda | Traditional/biomass: LPG | RCT | 2 months | ✗ | ✗ | ✓ 24 h | ✗ | 8/12 stars (66.7%) |
| Lewis (2017) | India | Traditional/biomass: LPG | Cross-sectional | Not-specified | ✓ 24 h | ✗ | ✗ | ✗ | 6/9 stars (66.7%) |
| Lewis et al (2019) | India | Traditional/biomass: LPG | Cross-sectional | Not specified | ✓ 24 h | ✗ | ✓ 24 h | ✗ | 9/11 stars (81.8%) |
| Pokhrel et al (2015) | Nepal | Traditional/biomass: LPG | Cross-sectional | Not specified | ✓ 24 h | ✗ | ✗ | ✗ | 5/9 stars (55.6%) |
| Pope (2018) | Cameroon | Traditional/ ood: LPG | Cross-sectional | Not specified | ✓ 48 h | ✗ | ✓ 48 h | ✗ | 9/11 stars (81.8%) |
| Tagle et al (2019) | Paraguay | Traditional/wood: LPG | Cross-sectional | Not specified | ✓ 24 h | ✓ 24 h | ✗ | ✗ | 7/9 stars (77.8%) |
| Ubuoh and Nwajiobi (2018) | Nigeria | Traditional/wood: LPG | Cross-sectional | Not specified | ✓ 24 h | ✗ a | ✗ | ✗ | 5/11 stars (45.5%) |
| ITDG (2005) | Sudan (wet) | Traditional/biomass: LPG | Before and after | 12 months | ✓ 24 h | ✓ 24 h | ✗ | ✗ | 10/14 stars (71.4%) |
| Sudan (dry) | Traditional/biomass: LPG | Before and after | 12 months | ✓ 24 h | ✓ 24 h | ✗ | ✗ | 10/14 stars (71.4%) | |
a Estimates for CO could not be used as expressed as mg m3 in the paper.
Table 7. Summary of studies included in the systematic review: electric stoves.
| Electric stoves | |||||||||
|---|---|---|---|---|---|---|---|---|---|
| Author, year (reference) | Country (season) | Baseline: intervention | Study design | Duration of follow-up | Kitchen concentration | Personal exposure | Quality assessment | ||
| PM2.5 | CO | PM2.5 | CO | ||||||
| Lewis (2019) | India | Traditional/biomass: electric stove | Cross-sectional | Not specified | ✓ 24 h | ✗ | ✓ 24 h | ✗ | 9/11 stars (81.8%) |
| Pokhrel (2015) | Nepal | Traditional/wood: electric stove | Cross-sectional | Not specified | ✓ 24 h | ✗ | ✗ | ✗ | 5/9 stars (55.6%) |
| Tagle (2019) | Paraguay | Traditional/wood: electric stove | Cross-sectional | Not specified | ✓ 24 h | ✓ 24 h | ✗ | ✗ | 7/9 stars (77.8%) |
| Ubuoh (2018) | Nigeria | Traditional/wood: electric stove | Cross-sectional | Not specified | ✓ 24 h | ✓ 24 h | ✗ | ✗ | 6/11 stars (54.5%) |
| Rollin (2004) | South Africa summer (dry) | Traditional/kerosene/solid fuel: electrification | Cross-sectional | — | ✓ 24 h | ✓ 24 h | ✗ | ✗ | 6/9 stars (66.7%) |
Results from the meta-analyses are displayed according to the four primary HAP outcomes, stratified by intervention category, in figures 2–5. The impacts on the four HAP outcomes of the cleaner cooking technologies and fuels are described below for each intervention category.

Figure 2. Forest plot summarizing intervention impacts on levels of kitchen PM2.5 (mg m−3). New study estimates from updated review indicated with prefix (-).
Download figure:
Standard image High-resolution image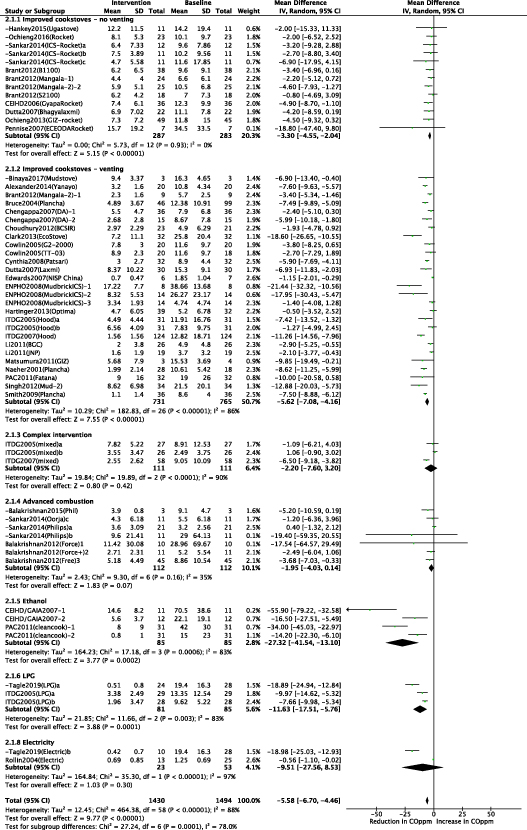
Figure 3. Forest plot summarizing intervention impacts on levels of kitchen CO (ppm). New study estimates from updated review indicated with prefix (-).
Download figure:
Standard image High-resolution image
Figure 4. Forest plot summarizing intervention impacts on levels of personal PM2.5 (mg m−3). New study estimates from updated review indicated with prefix (-).
Download figure:
Standard image High-resolution image
Figure 5. Forest plot summarizing intervention impacts on levels of personal CO (ppm). New study estimates from updated review indicated with prefix (-).
Download figure:
Standard image High-resolution image2.5. Cleaner cooking technologies
2.5.1. 'Improved cookstoves' without venting (ICS—no vent)
Nine studies (six in Africa and three in Asia) measured impacts of ICS using standard combustion (i.e. not enhanced by forced draught or gasification), and without venting. These mainly used rocket-type combustion chambers, although some used these designs with a grate, table S1.
2.5.1.1. Kitchen concentrations: particulate matter
Seven studies (12 estimates) measured kitchen PM, six before-and-after designs and one RCT. The weighted mean levels were 0.750 mg m−3 at baseline and 0.361 mg m−3 post-intervention, with a weighted mean reduction of 51.9%, figure 6. Moderate heterogeneity (I2 = 47%) was observed and random effects meta-analysis yielded a pooled effect estimate of −0.23 mg m−3 (95% CI: −0.34, −0.12), figure S1(a). Possible publication bias was indicated by both the Begg test (p = 0.099) and the Egger's test (0.005), figure S1(b).
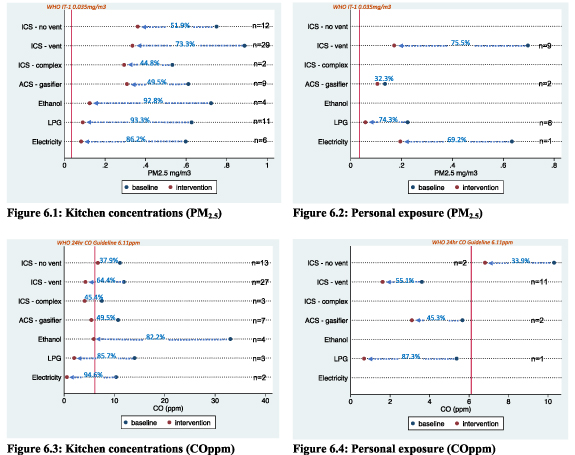
Figure 6. Pooled weighted mean reductions in household air pollution (PM2.5 and CO) by intervention.
Download figure:
Standard image High-resolution image2.5.1.2. Kitchen concentrations: carbon monoxide
Eight studies (13 estimates) measured kitchen CO, seven before-and-after designs and one cross-sectional design. Weighted means were 11.1 ppm at baseline and 7.0 ppm post-intervention; weighted mean reduction of 36.1%, figure 6. The pooled estimate in fixed effect meta-analysis (I2 = 0%), was −3.3 ppm (95% CI: −4.5, −2.0), figure S2(a). There was no evidence of publication bias from Begg's or Egger's tests (p > 0.1), figure S2(b).
2.5.1.3. Personal exposures: particulate matter and carbon monoxide
No studies provided estimates of personal exposure to particulate matter whereas two studies provided two estimates of exposure to CO (statistically non-significant pooled reduction of −1.7 ppm (95% CI: −4.7, 1.3)).
2.5.2. 'ICS' with venting (ICS—vent)
Overall 28 studies—1, 12, and 15 conducted in Africa, Asia and Latin America respectively—concerned ICS with venting. Stove models comprised various fixed stove types made of mudbrick (e.g. ENPHO stove), metal (e.g. rocket stove) or brick (e.g. plancha stove), table S2.
2.5.2.1. Kitchen concentrations: particulate matter
Fifteen before-and-after studies (19 estimates) and eight cross-sectional studies (10 estimates) measured kitchen PM. The weighted (for sample size) mean levels for kitchen PM were 0.89 mg m−3 at baseline and 0.33 mg m−3 post-intervention, a weighted mean percentage reduction of 63.3% (figure 6.1).
With an I2 value of 86% (p < 0.005), random effects meta-analysis was conducted with a pooled effect estimate of −0.45 mg m−3 (95% CI: −0.56, −0.34), figure S3(a). Figure S3(b) shows the funnel plot. Tests of funnel plot asymmetry were of borderline significance for Begg's test (p = 0.029), and significant for Egger's test (p < 0.0005), suggesting publication bias (likely in the direction of smaller studies reporting a larger reduction in PM). Analysis stratified by study design showed this bias to be significant for before-and-after studies (Begg's p = 0.019; Egger's p = 0.001) but not for cross-sectional studies (Begg's p = 0.210; Egger's p = 0.097).
2.5.2.2. Kitchen concentrations: carbon monoxide
Twelve before-and-after studies (17 estimates), eight cross-sectional studies (nine estimates) and one RCT (one estimate) measured kitchen CO. The weighted mean levels were 11.9 ppm at baseline and 4.2 ppm post-intervention, with a weighted mean percentage reduction of 64.4%, figure 6.2.
The pooled effect estimate in random effects meta-analysis was −5.62 ppm (95% CI: −7.09, −4.16), figure S4(a). Tests for funnel plot asymmetry were non-significant for Begg's test (p = 0.182), but significant for Egger's test (p = 0.012) (funnel plot figure S4(b)), potential publication bias being in the direction of smaller studies reporting larger reductions in CO. Publication bias was significant for before-and-after designs (Begg's p = 0.127; Egger's p = 0.025) but not for cross-sectional studies (Begg's p = 0.466; Egger's p = 0.114).
2.5.2.3. Personal exposures: particulate matter
Seven studies, four before and after studies and three cross-sectional studies, provided nine estimates of personal PM. The weighted mean levels were 0.697 mg m−3 at baseline and 0.171 mg m−3 post-intervention, with a weighted mean reduction of 75.5%, figure 6.3.
There was significant statistical heterogeneity (I2 = 100% (p < 0.0005)), and random effects meta-analysis yielded a statistically non-significant pooled estimate for absolute reduction in personal PM of 0.28 mg m−3 (95% CI: −0.67, 0.11), figure S5(a). There was no statistical evidence of publication bias according to Begg's (p = 0.175) and Egger's (p = 0.404) tests, figure S5(b).
2.5.2.4. Personal exposures: carbon monoxide
Eight studies measured personal CO: one RCT (two estimates), three before-and-after studies (four estimates), and four cross-sectional studies (five estimates). The weighted mean levels were 3.6 ppm baseline and 1.6 ppm post-intervention; weighted mean reduction of 55.1%, figure 6.4.
Statistical heterogeneity was observed (I2 = 84% (p < 0.0005)) and the pooled effect estimate in random-effects meta-analysis was −1.36 ppm (95% CI: −1.90, −0.81), supplementary figure S6(a). There was no statistical evidence of publication bias in studies of personal CO according to Begg's (p = 0.169) and Egger's (p = 0.264) tests, figure S6(b).
2.5.3. Complex (multi-facetted) interventions
Two before-and-after studies in Kenya and Sudan provided estimates on the impact of multi-component interventions (combinations of a hood with flue venting outside the house, 'improved' stove, fireless cooker and LPG, determined according to user preferences) (table S3) including two estimates for kitchen concentrations of PM2.5 (pooled reduction of −0.23 mg m−3 (95% CI: −0.36, −0.10) with a 44.8% reduction in weighted mean concentration) and three estimates for kitchen concentrations of CO (pooled reduction of −2.2 ppm (95% CI: −7.6, 3.2) with a 45.4% reduction in weighted mean concentration), tables 1 and 2.
2.5.4. Advanced combustion ('gasifier') solid fuel stoves
Four studies (three conducted in India and one in Laos) addressed impacts of advanced combustion solid fuel stoves, all before-and-after studies. Stove models comprised free-convection, forced-convection and forced-convection combined with optimized fuel stoves, table S4.
2.5.4.1. Kitchen concentrations: particulate matter
The four studies provided nine estimates of kitchen PM2.5 with weighted means of 0.611 mg m−3 at baseline and 0.308 mg m−3 post-intervention, resulting in a weighted average PM reduction of 49.5% (figure 6). Fixed effect meta-analysis (I2 = 0%), yielded a pooled effect estimate of −0.23 mg m−3 (95% CI: −0.32, −0.15), (figure S7(a)). No evidence of publication bias was observed with Begg's (p = 1.0) and Egger's (p = 0.458) tests, figure S7(b).
2.5.4.2. Kitchen concentrations: carbon monoxide
For kitchen CO, three studies provided seven estimates of effect. The weighted mean values were 10.7 ppm at baseline and 5.4 ppm post-intervention, with a weighted average reduction of 49.5%, figure 6. In random effects meta-analysis (I2 = 35%), the statistically non-significant pooled estimate was −2.0 ppm (95% CI: −4.0, 0.1) figure S8(a). There was no evidence of publication bias with Begg (p = 0.368) and Egger's (p = 0.127) tests, figure S8(b).
2.6. Clean fuels
2.6.1. Alcohol based fuels (i.e. ethanol)
Two before-and-after studies conducted in Nigeria, Ethiopia and two regions of Madagascar addressed impacts of ethanol on kitchen concentrations of PM2.5 (four estimates) and CO (four estimates); none measured personal exposure to HAP, table S5.
2.6.1.1. Kitchen concentrations: particulate matter
For kitchen PM, weighted means were 0.72 mg m−3 at baseline and 0.12 mg m−3 post-intervention, with a weighted mean reduction of 82.8% (figure 6).
In random effects meta-analysis the pooled effect estimate was −0.58 mg m−3 (95% CI: −0.92, −0.24), with considerable statistical heterogeneity (I2 = 82%), figure S9(a). Tests for publication bias were non-significant for Begg's test (p = 0.308), but marginally significant for Egger's test (p = 0.056).
2.6.1.2. Kitchen concentrations: carbon monoxide
For kitchen CO, weighted means were 33.0 ppm at baseline and 5.9 ppm post-intervention; the weighted average reduction was 82.2%, figure 6. The high baseline CO values (range 15.0–70.5 ppm) are likely to reflect the widespread use of charcoal in these study communities.
In random effects meta-analysis, the pooled estimate was −27.3 ppm (95% CI: −41.5, −13.1), with significant heterogeneity (I2 = 83%), figure S10(a). Tests for publication bias were non-significant for Begg's (p = 0.089) and Egger's (p = 0.161) tests, figure S10(b).
2.6.2. LPG
Ten studies (five cross-sectional, two before-and-after and three RCTs) assessed the impacts of cooking with LPG on concentrations of and exposure to HAP, table S6. Study locations included Cameroon, Nigeria, Paraguay, Nepal, Ghana and India.
2.6.2.1. Kitchen concentrations: particulate matter
For kitchen PM2.5 (11 estimates), weighted means were 0.65 mg m−3 at baseline and 0.11 mg m−3 post-intervention, with a weighted mean reduction of 83.3% (figure 6).
In random effects meta-analysis the pooled effect estimate was −0.52 mg m−3 (95% CI: −0.650, −0.390), with significant statistical heterogeneity (I2 = 79%), figure S11(a). Tests for publication bias were non-significant for both Begg's (p = 0.169) and Egger's (p = 0.217) tests, figure S11(b).
2.6.2.2. Kitchen concentrations: carbon monoxide
For kitchen CO (three estimates), the weighted means were 14.0 ppm at baseline and 2.7 ppm post-intervention, with a weighted mean percentage reduction of 85.7%, figure 6. Random effects meta-analysis (I2 = 83%) yielded a pooled effect estimate of −11.6 ppm (95% CI: −17.5, −5.8), figure S12.
2.6.2.3. Personal exposure: particulate matter and carbon monoxide
Whilst six studies provided eight estimates of the impact of cooking with gas on personal exposure to PM2.5, only one measured CO (mean = 0.68 ppm; SD = 0.32). Weighted mean levels of PM2.5 were 0.58 mg m−3 at baseline and 0.28 mg m−3 post-intervention, with a weighted mean reduction of 74.3% (figure 6).
In random effects meta-analysis the pooled effect estimate was −0.10 mg m−3 (95% CI: −0.14, −0.06), with significant statistical heterogeneity (I2 = 84%), figure S13(a). Tests for publication bias were non-significant for the Begg test (p = 0.536) and Egger's test (p = 0.066), figure S13(b).
2.6.3. Cooking with electricity
Five studies (all cross-sectional) examined an intervention using electricity for cooking providing six estimates for kitchen PM, two estimates for kitchen CO and one for personal PM (with no estimates for personal CO), table S7. Study locations included Nepal, Paraguay and Nigeria.
2.6.3.1. Kitchen concentrations: particulate matter
For kitchen PM, weighted means were 0.60 mg m−3 at baseline and 0.08 mg m−3 post-intervention, with a weighted mean reduction of 86.2% (figure 6). In random effects meta-analysis (I2 = 95%) the pooled effect estimate was −0.45 mg m−3 (95% CI: −0.77, −0.14), figure S14(a). Tests for publication bias were non-significant for Begg's (p = 0.452) and Egger's (p = 0.292) tests, figure S14(b).
2.6.3.2. Kitchen concentrations: carbon monoxide
For kitchen CO, the weighted means were 10.3 ppm at baseline and 0.6 ppm post-intervention, with a weighted mean percentage reduction of 94.6%, figure 6. Random effects meta-analysis (I2 = 97%) yielded a pooled effect estimate of −9.5 ppm (95% CI: −27.6, −8.5), figure S15.
3. Discussion
This systematic review synthesizes data obtained from studies of estimates for concentrations of and personal exposure to respirable PM and CO. Eligible studies included both cleaner biomass burning stoves (with and without venting, and stoves that include more advanced combustion) and those with clean fuels (ethanol, LPG and electricity).
3.1. Intervention impacts on kitchen and personal PM and CO according to WHO guidelines
Figures 6–9 show the effects of the cleaner cookstove and clean fuel interventions for the seven intervention categories for the four HAP outcomes and compared against WHO AQGs: Global Update 2005 (AQG) reference levels for PM2.5 and the 2009 WHO guidelines for indoor air quality: selected pollutants for CO (WHO 2006, 2010).
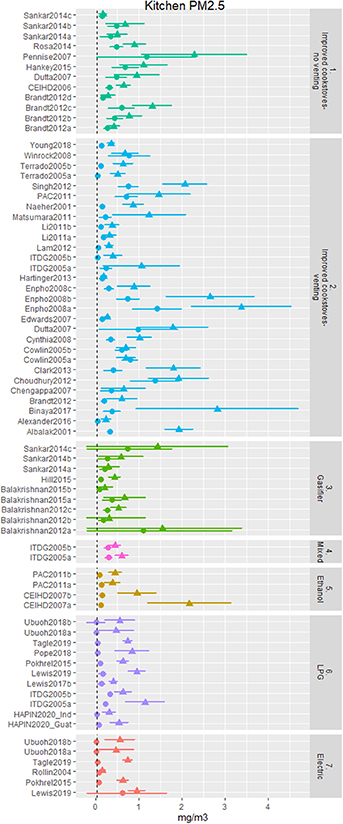
Figure 7. Baseline and intervention levels for kitchen PM2.5 (mg m−3) for all improved solid fuel stove and clean fuel interventions in relation to WHO AQG.
Download figure:
Standard image High-resolution image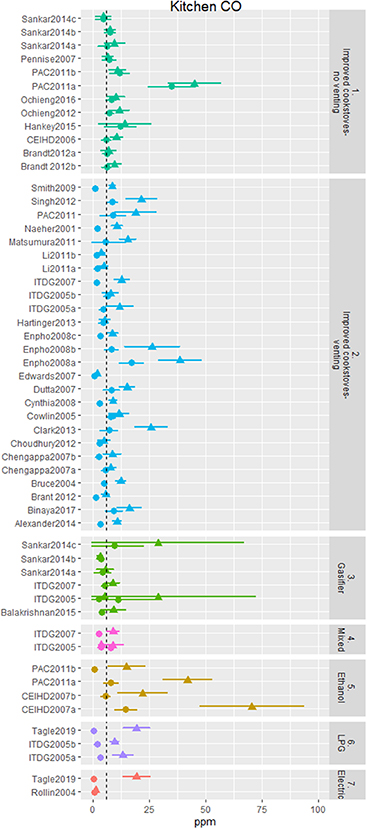
Figure 8. Baseline and intervention levels for kitchen CO (ppm) for all improved solid fuel stove and cleaner fuel interventions in relation to WHO AQG.
Download figure:
Standard image High-resolution image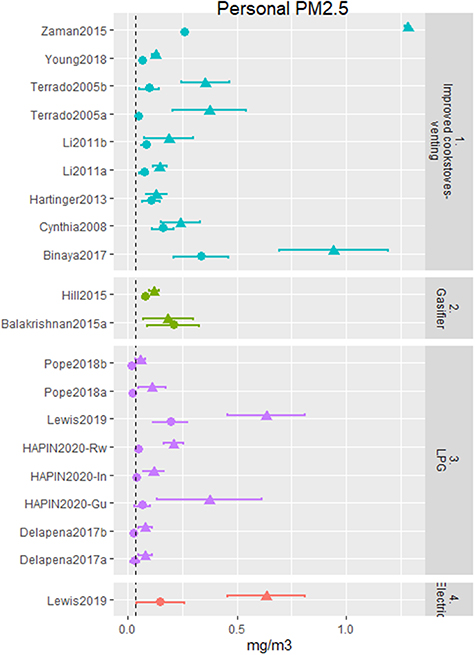
Figure 9. Baseline and intervention levels for personal exposure to PM2.5 (mg m−3) for all improved solid fuel stove and clean fuel interventions in relation to WHO AQG.
Download figure:
Standard image High-resolution image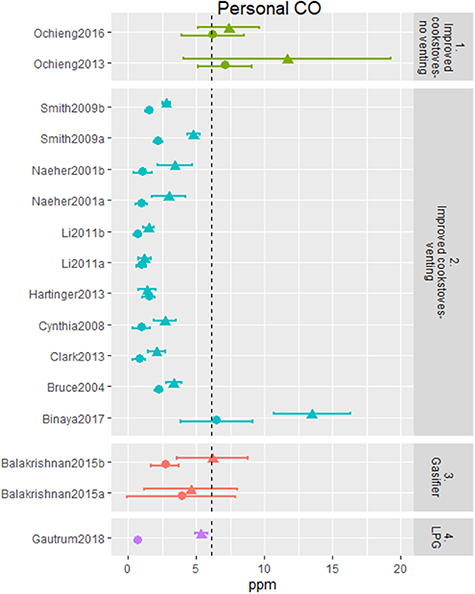
Figure 10. Baseline and intervention levels for personal exposure to CO (ppm) for all improved solid fuel stove and cleaner fuel interventions in relation to WHO AQG.
Download figure:
Standard image High-resolution image
For kitchen concentrations of PM2.5, all intervention types, and most individual studies, resulted in statistically significant reductions (figure 2) and observed large percentage and absolute reductions, with only a small number reporting minor reductions or even increases. However, it is notable that only interventions involving very clean fuels (particularly for LPG stoves (11 estimates) and electric stoves (six estimates)) consistently achieved mean post-intervention levels near or below the WHO AQG IT-1 level (figure 6). Most of the interventions involving biomass stoves were at much higher PM2.5 kitchen concentrations than WHO IT-1. Among solid fuel stoves, those interventions with chimneys had lower PM2.5 concentrations than those without. None of the advanced combustion stoves (gasifiers) achieved WHO IT-1, although these only included stoves with forced draft combustion (the authors were not able to find any field based data from pellet fuel gasifier stoves). Kitchen PM levels from ethanol cookstove interventions were in general much lower than biomass cookstoves, but above the WHO AQG IT-1 PM2.5 target.
Similar results were observed for studies measuring concentrations (kitchens) of CO, with some notable exceptions. Like PM2.5, pre-intervention levels of CO showed a great deal of variability with many exceeding the WHO 24 h guideline value (figure 7). Post-intervention kitchen concentrations of CO were significantly reduced for both chimney and non-chimney cleaner biomass stoves, as well as ethanol and LPG clean fuel stove interventions (figure 3). Chimney stoves had the best performance in reducing CO among the solid fuel stoves, and ethanol from the clean fuels. In contrast to the findings for kitchen concentrations of PM (11 out of the 73 cleaner technology and clean fuel interventions achieving the WHO-IT1 guideline level (figure 6)), the majority of all types of interventions achieved CO levels at or below the WHO 24 h guideline (51 of 59 interventions).
For personal exposure to HAP, baseline levels tended to be lower than for kitchen concentrations for both PM2.5 (figure 8) and CO (figure 9). For personal exposure to PM2.5, whilst the data was more sparse, only the interventions involving cooking with advanced combustion cookstoves, LPG or electricity resulted in a statistically significant pollutant reduction (figure 4), and only LPG interventions consistently achieved levels below or near the WHO IT-1 AQG (figure 8). All but one of the post intervention levels for LPG were close to or below the WHO IT-1 level of 35 µg m−3 for PM2.5, with a 74% (61%–83%) reduction observed to a post-intervention level of 58 µg m−3. Excluding the outlier study with an intervention estimate of 195 µg m−3 led to a post intervention average below WHO IT-1 of 33 µg m−3 and a pooled reduction of 78.1%. For chimney stoves a 76% (19%–87%) reduction was observed to a post-intervention level of 171 µg m−3 and for advanced combustion stoves a 20.3% (increase of 12.5% to reduction of 39.5%) reduction was observed to a post-intervention level of 105 µg m−3 (figure 6).
For personal exposure to CO, chimney stoves, advanced combustion biomass stoves, and LPG interventions resulted in statistically significant reductions. All interventions (both cleaner biomass burning technologies and clean fuels) resulted in levels of personal exposure below the WHO 24 h guideline level.
3.2. Implications for maximizing health gains
Combustion derived exposure to respirable PM from active and second-hand smoking, HAP and ambient air pollution have been associated with disease outcomes (pneumonia in children and chronic obstructive pulmonary disease, lung cancer, stroke and ischaemic heart disease) through published exposure-response functions (Burnett et al 2014, 2018, HEI 2020). These mostly non-linear functions (not including lung cancer that appears to have a linear exposure-response relationship) highlight that the risk of disease declines more steeply at lower levels of exposure relative to higher levels. For this reason it is the post-intervention levels of PM that are particularly important when considering risk on health rather than absolute or relative reductions of HAP. Whilst post-intervention levels varied substantially between interventions, most of those involving cleaner burning biomass stoves were close to the WHO annual PM2.5 IT-1 of 35 µg m−3. Epidemiological studies and related dose-response curves suggest that to have a meaningful positive impact on the burden of disease from HAP, interventions need to be consistently at or below the interim guideline level (WHO 2006, Burnett et al 2014). Only clean fuels interventions (studies of ethanol, LPG and electricity) reported mean post-intervention concentrations of PM2.5 close to or at the IT-1 levels (all below 100 µg m−3). For the limited number of biomass burning chimney stoves that achieved post intervention levels to the IT-1 target, further examination of these technologies and the circumstances of their use is warranted (e.g. Terrado et al 2005, Young et al 2019), including their impacts on fuel savings and the environment (Berrueta et al 2008, Granderson et al 2009, Johnson et al 2009).
There are a variety of factors that can contribute to reductions in emissions that affect post-intervention levels with a key influence being the use of multiple fuels and stoves in parallel to the intervention to meet different cooking and home energy needs (Ruiz-Mercado and Masera 2015, Quinn et al 2018, Ochieng et al 2020). This fuel and/or stove 'stacking' is common practice and is increasingly being reported in more recent measurement studies. Considering the substantial impact that 'stacking' can have on the level of emissions and exposure in the home, ongoing (and future) efforts to design and promote interventions to reduce HAP and will need to account for these practices to maximize health benefits, for example by understanding and addressing the reasons why people stack and promoting combinations of cleaner interventions. In addition, the effect of lighting, space heating and other combustion sources in and around the home, as well as pollution from other homes and sources in the community, while rarely quantified in evaluation studies, contribute to the observed pre- and post-intervention concentrations and exposures. These factors highlight the need for a comprehensive solution to the HAP problem, with interventions to clean up cooking as well as other household energy uses; this is likely to be more effective if targeted at the community level rather than single households.
3.3. Strengths and limitations
This review represents a comprehensive appraisal of the current evidence base for quantified impacts on key health damaging pollutants of all cleaner and clean cooking solutions tested in field based conditions. With a 60% increase in the number of HAP measurement studies within a 3 years period, this meta-analysis draws on a wide range of published and unpublished sources including appraisal of specialist websites, conference proceedings and through direct communication with lead researchers in the clean cooking sector. Given the wealth of quantitative data available representing seven distinct intervention categories with impacts on both concentrations (kitchen) and exposure (cooks and children, where available) to PM2.5 and CO, a variety of approaches have been used to present results from the review using both meta-analytical representation (e.g. forest plots) as well as referencing impacts for users' needs (i.e. relating values for baseline and post-intervention impacts to WHO AQG values). As one would expect, there is substantial heterogeneity between the included studies in relation to levels of PM2.5 and CO, intervention type, context, circumstances of intervention use and employed methodology. For this reason the synthesis is presented for both individual studies and pooled across studies, allowing consideration of both general conclusions as well as context- and intervention-specific messages.
Another strength of this review is that it considers kitchen concentrations and exposure measurements from real-life settings in which other stoves, heaters, and lamps may be used concurrently, thus offering a realistic snapshot of HAP levels and exposures in practice. However, it is essential to interpret these measurements as potentially including other background levels of air pollution from household or ambient sources and thus a possible underestimation of the positive effect of cleaner stoves and clean fuels. The observation that clean fuel interventions consistently achieved the WHO IT-1 level for PM2.5 despite potential stacking of fuels within these households, and potential contributions from PM2.5 in ambient air, is noteworthy and suggests that it may be possible to achieve even lower concentrations and exposure if cleaner technologies and fuels are used exclusively within the community.
The results of these evaluation studies provide a useful guide to the HAP and exposure reductions achieved by different cooking solutions; however, the actual performance in any given setting will vary according to the contextual and operational conditions in which the stove/fuel combinations are used, including the housing type and condition, user-needs, geographical and climatic conditions, and many other factors (Rehfuess et al 2014, Stanistreet et al 2014, Puzzolo et al 2016). Results should therefore be interpreted with caution, with the overall pooled results for each stove and fuel type seen as a general guide to what is being achieved, while individual studies can provide more detailed and context-specific insights. This concern may be especially important for interpreting the cleanest options, such as LPG and electricity, as the user groups who can afford these fuels for cooking often have substantial socioeconomic and demographic differences from biomass users. At the same time, there is evidence from before and after studies that biomass-using homes transitioning to LPG can achieve low HAP exposures (Johnson et al 2018).
While a greater number of studies are being reported on LPG interventions, a limitation of the current evidence base is the paucity of studies being published on the intervention impacts of advanced combustion stoves and other clean fuels (e.g. alcohol fuels and electricity). There is also a lack of empirical evidence on the direct effects of interventions on personal exposure to PM2.5. This is likely to partly be the result of an historical lack of suitable technology for measuring personal PM, especially in young children, as well as practical challenges involved including cost, and inconvenience to subjects. Moreover, although there are a few large-scale programmes ongoing that provide evidence on intervention impacts, the majority to date have been studies of relatively small projects and programmes. Given that many of these studies are early efficacy studies typically conducted at the beginning of wider programmes, it is not possible to extrapolate their effectiveness in terms of intervention impacts if implemented at scale over the longer term. The durability of the stove technologies over the longer term needs to be considered in terms of their effectiveness beyond the evaluation periods—there is evidence to suggest, for example, that properly maintained LPG stoves might be more robust in their efficacy to reduce HAP over time than more advanced biomass cookstoves (Mortimer et al 2016, Shen et al 2018). However, given the paucity of evidence further research on long term viability of cleaner cooking options in reducing HAP is needed.
One issue identified through the synthesis of evidence for the review was the presence of potential publication bias identified through statistical funnel plot asymmetry when pooling results. Such bias could have exaggerated observed intervention impacts for reductions in both PM2.5 and CO due to the pooled evidence being based on studies with larger samples of homes with potentially greater reductions in concentrations. Conversely, estimates derived from the included studies would also include contributions to levels of PM2.5 and CO from other sources (for example other use of solid fuels and kerosene for heating and lighting or from ambient sources that would have diluted the observed intervention impacts from cleaner cooking).
Another consideration is that most studies summarized measures of PM2.5 and CO using arithmetic means leading to the syntheses through meta-analyses adopting this metric. Given that the distributions of these pollutants were generally positively skewed, geometric means or medians could have provided more reliable summary measures with use of means potentially leading to exaggerated intervention effects. An important implication of this limitation is that for interventions that achieved levels of kitchen concentrations or personal exposure at or below WHO guideline levels, larger fractions of the study populations would have met these targets than is suggested by the skewed mean estimates. This warrants consideration of a universal reporting structure for future HAP measurement studies (e.g. inclusion of geometric and arithmetic means, stratified by primary and secondary cooking fuel types) to minimize measurement bias when pooling PM2.5 exposure data in future meta analyses.
3.4. Recommendations for research and policy
There is a need for more studies conducted in the field to strengthen the evidence base for more robust assessment of intervention impacts of clean fuel interventions (more on LPG but in particular ethanol and electricity interventions). Such studies should adopt standardized methods to objectively assess the range of potentially health damaging pollutants, at least assessing concentrations of and exposures to both PM and CO. Monitoring of multiple stoves and other combustion devices in the home and immediate vicinity, and their contributions to levels of HAP and exposure quantified where possible is critical to advancing the evidence-base. Similarly, levels of ambient air pollution resulting from household combustion of neighbouring homes and other sources (which may include garbage burning, burning of crop residue, brick kilns, transport, industry and power generation) should be measured to assess the contribution to household levels of and personal exposure to PM and CO.
At the time of presenting the synthesis for the review, a large observational study was published supporting the main message from the review in relation to the importance of cooking with clean fuels over solid fuels and biomass to achieve reductions in HAP to substantively benefit health when used in everyday settings. In the prospective urban rural epidemiology (PURE)-AIR study, data on kitchen and personal PM2.5 were collected from 2541 households and 998 individuals from 120 rural communities in Bangladesh, Chile, China, Columbia, India, Pakistan, Tanzania and Zimbabwe (Shupler et al 2020). The authors found that women from households primarily cooking with electricity (48 h mean = 62 µg m−3 (range = 50–76)) or gas (48 µg m−3 (43–54)), although typically with additional 'stacking' from secondary fuels had significantly lower exposure levels than those using coal (71 µg m−3 (57–86)), crop waste (97 µg m−3 (73–128)), wood (78 µg m−3 (69–89)), dung (146 µg m−3 (110–194)) and shrubs/grass (147 µg m−3 (109–197)). Whilst exposure to PM2.5 for women using clean fuels were above the WHO IT-1 guideline level for PM2.5 of 35 µg m−3, the authors note the often high ambient levels of HAP and suggest that 'community-level transition to clean cooking fuels, and potentially emissions reductions from other ambient sources' are required to maximize health gains.
The PURE-AIR study supports the main findings of this analysis, that clean fuel sources are associated with the lowest HAP exposures. In order to bring HAP exposure down to these lower exposure levels across populations, the efforts to characterize effectiveness of interventions and the factors driving contributions to exposure as described above need to be complemented with understanding how those factors can be impacted through policy, pricing, behaviour, and other levers. For example, while venting of stoves is to be encouraged to reduce indoor levels and personal exposures, finding ways to reduce total emissions to the ambient environment (e.g. cleaner combustion technologies or increasing chimney height) is critical to achieving low neighbourhood levels and minimizing exposure of the total population. Similarly, the most effective interventions using clean fuels need to be supported with efforts (e.g. financing mechanisms or comprehensive distribution networks to support continuous household supply of LPG or ethanol) to maximize displacement of traditional technologies. As HAP is influenced by different types of household energy as well as ambient air pollution entering the house, a comprehensive approach towards measuring and addressing HAP is needed. This includes taking heating and lighting into consideration when promoting clean energy use—in addition to cooking.
More high quality and direct feedback of program performance and effectiveness will also help inform decisions and facilitate efforts to maximize exposure reductions. Most critical, the paucity of personal exposure data needs to be addressed. New and more user-friendly instruments for measuring stove usage and exposure are a step in this direction (Chartier et al 2017, Liao et al 2019, Pillarisetti et al 2019, Burrowes et al 2020, Ventrella et al 2020, Wilson et al 2020), though the management and deployment of these devices still need to be supported by technical know-how. This new technology can enable the design of larger scale studies, such as the PURE-AIR and household air pollution intervention network studies (Arku et al 2018, Johnson et al 2020), that include measurements across many countries and/or communities under a harmonized protocol to minimize measurement biases when pooling data across locations in future meta-analyses.
Models to predict HAP exposure have also shown promise to scale-up quantitative exposures to a larger population (Baumgartner et al 2011, Balakrishnan et al 2013, Shupler et al 2018, Hill et al 2019, Sanchez et al 2020, Johnson et al 2021), though additional work is needed to test their performance and reliability across contexts. Biomarkers may also have a role, but need further development to understand how they relate to HAP exposure and health outcomes (Rylance et al 2013, Barr et al 2020).
A public health problem affecting almost half of the world's population demands the most-effective evidence-based cooking solutions are rolled out on a large-scale. Whilst there is not a single 'one size fits all' solution to the HAP problem, a combination of suitable technologies and programmatic approaches can be employed to meet the needs of specific geographical, socio-economic and cultural settings. Innovations in solid fuel stoves to reduce emissions will continue, however, the post-intervention PM levels of advanced combustion stoves presented here suggests that a lot of progress still needs to be made before a 'healthy', scalable biomass stove is available. With a growing evidence base demonstrating (a) generally disappointing post-intervention levels of PM achieved from cleaner biomass burning stoves and (b) the consistent effectiveness in PM reduction for clean fuel interventions such as LPG, ethanol and electricity in achieving emissions consistent with WHO guideline levels for health, greater emphasis needs to be placed on scaling adoption of cleaner fuels for policy, practice and programmes.
Data availability statement
The data that support the findings of this study are available upon reasonable request from the authors.
Funding
This study was commissioned and paid for by the World Health Organization (WHO). The authors have been given permission to publish this article. The authors alone are responsible for the views expressed in this article and they do not necessarily represent the views, decisions or policies of the institutions with which they are affiliated.