

Abstract
Lake-rich northern permafrost landscapes are sensitive to changing climate conditions, but ability to track real-time and potentially multiple hydrological responses (e.g. lake expansion, drawdown, drainage) is challenging due to absence of long-term, sustainable monitoring programs in these remote locations. Old Crow Flats (OCF), Yukon, is a Ramsar Wetland of International Importance where concerns about low water levels and their consequences for wildlife habitat and traditional ways of life prompted multidisciplinary studies during the International Polar Year (2007–2008) and led to the establishment of an aquatic ecosystem monitoring program. Here, we report water isotope data from 14 representative thermokarst lakes in OCF, the foundation of the monitoring program, and time-series of derived metrics including the isotope composition of input waters and evaporation-to-inflow ratios for a 13 year period (2007–2019). Although the lakes spanned multiple hydrological categories (i.e. rainfall-, snowmelt- and evaporation-dominated) based on initial surveys, well-defined trends from application of generalized additive models and meteorological records reveal that lakes have become increasingly influenced by rainfall, and potentially waters from thawing permafrost. These sources of input have led to more positive lake water balances. Given the documented role of rainfall in causing thermokarst lake drainage events in OCF and elsewhere, we anticipate increased vulnerability of lateral water export from OCF. This study demonstrates the value of long-term isotope-based monitoring programs for identifying hydrological consequences of climate change in lake-rich permafrost landscapes.
Export citation and abstract BibTeX RIS

Original content from this work may be used under the terms of the Creative Commons Attribution 4.0 license. Any further distribution of this work must maintain attribution to the author(s) and the title of the work, journal citation and DOI.
1. Introduction
Shallow lakes are a prominent feature of northern permafrost landscapes, play important roles within local hydrological and global biogeochemical cycles, and provide ecosystem services for wildlife, waterfowl and Indigenous communities (Prowse et al 2006, Vincent et al 2011, Heino et al 2020). Research suggests that lake-rich northern landscapes are particularly vulnerable to rising temperatures, alteration of precipitation patterns and changes to permafrost processes (e.g. ACIA 2004, IPCC 2014). Northern lakes of thermokarst origin have displayed dynamic hydrological responses to recent climate changes, from lake surface area expansion to drawdown by evaporation and drainage (e.g. Smith et al 2005, Labrecque et al 2009, Rowland et al 2010, Carroll et al 2011, Jones and Arp 2015, Lantz and Turner 2015, Pastick et al 2018, Jones et al 2020, Serban et al 2021). These multiple hydrological trajectories can lead to cascading effects on biogeochemical cycling, habitat availability and ecological interactions (e.g. Rouse et al 1997, Prowse et al 2006, Schindler and Smol 2006, Tranvik et al 2009, Balasubramaniam et al 2017).
Several studies have suggested that shallow thermokarst lakes will continue to have varying hydrological responses to ongoing climate change and associated changes in catchment characteristics (e.g. Wolfe et al 2011b, Bouchard et al 2013, Turner et al 2014a, MacDonald et al 2017). Anticipated increases in air temperature and longer ice-free seasons (Kattsov et al 2005, Arctic Monitoring and Assessment Programme (AMAP) 2011) are expected to increase vapor loss from lakes (Schindler and Smol 2006, Arp et al 2015), which could result in widespread lake desiccation if not offset by increased precipitation (Bouchard et al 2013). Predicted decreases in spring snow cover for many northern areas may further reduce runoff available to counter evaporation from lakes (Arctic Monitoring and Assessment Programme (AMAP) 2011, Derksen and Brown 2012, Krasting et al 2013), while in other locations increased snowfall is anticipated (Krasting et al 2013). Increased northern shrub growth may reduce evaporative losses if sufficient snowmelt runoff can be generated in the lake catchment (Myers-Smith et al 2011, Lantz et al 2013, Turner et al 2014a). Additionally, permafrost thaw may result in lake drawdown via increased vertical lake drainage (e.g. Yoshikawa and Hinzman 2003) or may increase lateral hydrological connectivity that compensates for evaporative losses (Avis et al 2011, Wolfe et al 2011b). Absence of long-term monitoring of thermokarst lakes hampers identification of preferential hydrological pathways, amongst the plethora of possibilities, in response to real-time climate change. This uncertainty challenges development of adaptation plans by natural resource stewards in locations where habitat provided by thermokarst lakes contribute to Indigenous cultures.
Old Crow Flats (OCF), Yukon, is one such lake-rich northern landscape that has experienced dramatic changes in response to climate warming (e.g. thermokarst lake drainage, shrub growth; ABEK 2007, Wolfe and Turner 2008, Lantz and Turner 2015). OCF is an internationally important wetland (The Ramsar Convention of Wetlands 1982) and home to abundant wildlife and waterfowl that support the traditional lifestyle of the Vuntut Gwitchin First Nation who reside in the nearby village of Old Crow. OCF is cooperatively managed by the Vuntut Gwitchin Government (VGG), the North Yukon Renewable Resources Council (NYRRC) and Parks Canada Agency (PCA; Vuntut National Park; Parks Canada 2010). As part of the Canadian federal government International Polar Year program over a decade ago (IPY; 2007–2008), a multidisciplinary projected entitled 'Yeendoo Nanh Nakhweenjit K'atr'ahanahtyaa (Environmental change and traditional use of the Old Crow Flats in northern Canada)' was conducted to address stakeholder concerns about the effects of climate change on OCF (Wolfe et al 2011a). One of these concerns was declining lake-levels and the consequential loss of aquatic habitat (ABEK 2007). A major goal of the IPY project was to leave a legacy for the local community through the establishment of long-term monitoring programs capable of tracking trends in, and identifying drivers of, ecosystem change, with the intention to inform decisions and policies for adaptation (Wolfe et al 2011a).
A foundational component of the IPY project was an intensive three-year (2007–2009) water balance assessment of 58 lakes in OCF using isotope tracers (δ18O, δ2H; Turner et al 2014a). Results revealed complex interactions among hydrological processes, catchment characteristics and meteorological conditions, which were used to predict potential trajectories in lake hydrological conditions in response to anticipated changes in climate. Based on these findings and in collaboration among multiple stakeholders (VGG, NYRRC, PCA and university researchers), Tondu et al (2013) identified 14 of the 58 lakes, which were representative of the hydroecological diversity and catchment characteristics of lakes in OCF, as the basis for a long-term hydroecological monitoring program operationalized by the multi-stakeholder partnership. In that study, Tondu et al (2013) assembled five years (2007–2011) of water isotope data and utilized metrics (calculated lake-specific input water isotope compositions (δI) and evaporation-to-inflow (E/I) ratios) and attempted to evaluate trends in the importance of snowmelt, rainfall and evaporation to the lakes, but the time-series were too short to detect evidence of hydrological change. Since then, through ongoing collaboration among stakeholders, the monitoring program has continued and results have been acquired for an additional eight years (2012–2019). Here, we compile and evaluate 13 years of water isotope monitoring data to assess the trajectories of climate-induced hydrological changes in shallow thermokarst lakes of OCF. Findings reveal systematic trends towards increasingly positive water balances driven by rainfall and possibly also permafrost thaw of the OCF landscape. This unique long-term dataset for a vast, remote northern landscape provides clear, and somewhat unexpected, evidence of the current main direction of ongoing hydrological change. Findings provide an early warning of lake hydrological responses to climate change, knowledge crucial for adaptation planning by natural resource stewards and other stakeholders.
1.1. Study area
Centered ∼55 km north of the village of Old Crow is OCF, a vast 5600 km2 wetland containing more than 8700 shallow predominantly thermokarst lakes and ponds within a catchment that spans 14 000 km2 (figure 1; Turner et al 2014a, Lantz and Turner 2015). This low-relief landscape is underlain by fine-grained glaciolacustrine sediments and continuous permafrost (Zazula et al 2004), which is considered to restrict sub-permafrost inflow and outflow from influencing lake water balances (Turner et al 2014a). Lakes in OCF are perched above the Old Crow River, which exports waters derived from precipitation, runoff and lake drainage from OCF (Turner et al 2014b). Water isotope compositions (δ18O, δ2H) have been used to classify OCF lakes as snowmelt-, rainfall- or evaporation-dominated depending on the main hydrological processes controlling lake water balance (Tondu et al 2013, Turner et al 2010, 2014a). In general, snowmelt-dominated lakes are associated with catchments encompassing higher proportions of forest vegetation, rainfall-dominated lakes are associated with catchments containing larger proportions of tundra vegetation and evaporation-dominated lakes possess isotope-derived E/I ratios >0.5 and are associated with higher lake area to catchment ratios (Turner et al 2014a). The 14 lakes of the OCF hydroecological monitoring program, described in Tondu et al (2013), are distributed throughout the landscape and are representative of the range of hydrological conditions and catchment characteristics (figure 1). They include three snowmelt-, eight rainfall- and three evaporation-dominated lakes, as designated by Turner et al (2010) and based on sampling during 2007.
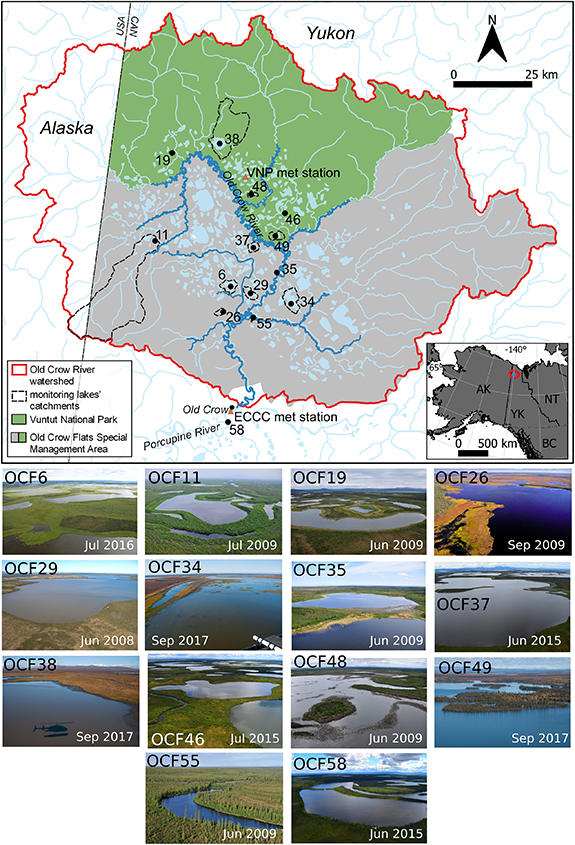
Figure 1. Map of Old Crow Flats (OCF), Yukon Territory, showing the location of the 14 lakes included in the monitoring program, the southern boundary of Vuntut National Park, and the Village of Old Crow. The Old Crow River and main tributaries are highlighted in darker blue. Meteorological data presented in this study were recorded in Old Crow and in Vuntut National Park. Spatial data sources include GeoGratis, Government of Canada (water features), U.S. Geological Survey (Old Crow River watershed), and Government of Yukon (Vuntut National Park and OCF Special Management Area).
Download figure:
Standard image High-resolution image2. Methods
Daily mean temperature and total precipitation data were compiled from the Environment and Climate Change Canada (ECCC) meteorological station located at the Old Crow airport (Station IDs 1582, 53023, and 26894) and a rain gauge in Vuntut National Park (VNP). Mean thaw and winter season values were identified for the monitoring interval 2007–2019, and a prior period 1981–2006. The ECCC precipitation record for this location has missing data on numerous dates and is not consistently partitioned between rainfall and snow water equivalent. The temperature record was used to calculate the timing and duration of thaw seasons by identifying all days of each year when the 31 day rolling mean was greater than 0 °C. The 2007–2019 time series of thaw season length, seasonal temperature and seasonal total precipitation were compared to corresponding mean and standard deviation values of the 1981–2006 record. Seasons that were missing data for more than 15 days (1996–98, 2000–05, 2012, 2014, 2017, and 2019) were removed from analysis. Total thaw season precipitation for 1981–2006 (ECCC) and 2007–2019 (ECCC and VNP) were compared using a Wilcoxon rank sum test (R software version 3.6.3).
The OCF monitoring lakes were sampled for analysis of water isotope composition (δ18O and δ2H) during spring (June; shortly after ice-off) and fall (August–September; shortly before ice-on) from 2007 to 2019. For the duration of the study, 178 samples were collected during spring and 158 during fall. Lake water samples were collected at a depth of ∼10–15 cm and stored in 30 ml high-density polyethylene bottles until analysis. Samples collected from 2007 to 2012 were analyzed by conventional continuous flow isotope ratio mass spectrometry (CF-IRMS) at the University of Waterloo—Environmental Isotope Laboratory (UW-EIL). Samples collected post-2012 were pre-filtered (0.45 μm) into 2 ml vials and measured by laser absorption using a Los Gatos Research Triple Liquid Water Isotope Analyzer at UW-EIL (2013–2014) and a Picarro Water Isotope Analyzer at the Biogeochemical Analytical Service Laboratory at the University of Alberta (2015–2019). Samples collected in 2016 were also analyzed by UW-EIL to ensure consistency of results between the methods and labs. Isotope compositions are expressed as δ-values, representing deviations in per mil (‰) from Vienna Standard Mean Ocean Water (VSMOW) such that δsample = ((Rsample/RVSMOW) − 1) × 103, where R is the 18O/16O or 2H/1H ratio in sample and VSMOW. Results of δ18O and δ2H analyses are normalized to −55.5‰ and −428‰, respectively, for Standard Light Antarctic Precipitation (Coplen 1996). Analytical uncertainties are standard deviations based on the in-run standards and are ±0.2‰ for δ18O and ±2.0‰ for δ2H for water samples analyzed by CF-IRMS, and ±0.2‰ for δ18O and ±0.8‰ for δ2H for those analyzed by laser absorption.
Here, we adopt the isotope framework developed and reported by Tondu et al (2013), which includes defining the local evaporation line (LEL) based partly on isotope monitoring of a class-A evaporation pan from 2007 to 2010 and meteorological data from the same time period (appendix 1 (available online at stacks.iop.org/ERL/16/124024/mmedia)). Measurement of lake water isotope compositions (δL) and application of the coupled-isotope tracer approach of Yi et al (2008) were used to extract: (1) the isotope composition of input waters (δI) from which the relative importance of different sources of water was identified, and (2) evaporation-to-inflow ratios calculated as E/I = (δI − δL)/(δE − δL) where δE represents the isotope composition of vapour derived from an evaporating lake (appendix 1). To identify potential sources of input waters to the monitoring lakes, δI values were compared to isotope ranges for rain (δ18O: −20.6 to −19.0‰, δ2H: −152 to −144‰; waterisotopes.org; Bowen 2019), snow (δ18O: −35.7 to −27.4‰, δ2H: −262 to −203‰; waterisotopes.org; Bowen 2019), ice-wedges (δ18O: −25.9 to −22.4‰, δ2H: −202.1 to −174.9‰; Bandara et al 2020) and syngenetic peat pore-ice as a proxy for permafrost waters (δ18O: −21.0 to −18.6‰, δ2H: −166 to −154‰; Bandara et al 2020). δI values for snow and rain were obtained from 'The online isotopes in precipitation calculator' (waterisotopes.org; Bowen 2019), which uses global precipitation oxygen and hydrogen isotope data to calculate average monthly values for a specified location. June-September values were used to generate a range for rain isotope composition and November-April values were used establish a range for snow isotope composition. We determined values for each lake and then averaged them to obtain a landscape value for OCF.
Following the recommendations of Tondu et al (2013), Mann-Kendall analyses of the 13 year spring and fall δ18OI and E/I time-series were conducted to assess the directionality and statistical significance of temporal trends, and select meteorological data (Hirsch and Slack 1984, Zhang et al 2000, Helsel and Hirsch 2002). Trend analyses were performed using the Kendall package (version 2.2; McLeod 2011) in R software (version 3.2.2; 4 April 2018, The R Foundation for Statistical Computing, www.r-project.org). Output from this analysis includes tau, which is a measure of the monotonic dependence of isotope values on time and ranges between −1 and 1. Statistical significance is denoted by the two-sided p value (sl). Tau values with sl < 0.05 were identified as significant trends. Generalized additive models (GAMs) were used to identify the synthetic trends in the δ18OI and E/I time-series for all 14 lakes during the 13 year spring and fall time periods using the mgcv package (version 1.8-28; Wood 2017) and Schoenberg version (version 0.0-6; Simpson 2018) in R (version 3.5.2; 4 April 2018).
3. Results
Meteorological records reveal temporal deviations in thaw season length, temperature and total thaw season precipitation (i.e. rainfall) during 2007–2019 relative to long-term averages (1981–2006) (figure 2). The thaw season length during 2007–2019 (mean = 147 days) was consistently longer than the 1981–2006 mean (141 days; figure 2(a)). Although the mean thaw season temperature during 2007–2019 was mostly within one standard deviation of the long-term (1981–2006) mean, winter season temperature experienced a significant increasing trend following 2013 (Mann-Kendall tau = 0.714, sl = 0.036; figures 2(b) and (c)). For years when ECCC data were available during 2007–2019, total thaw season precipitation was mostly above the 1981–2006 average (146 mm), especially for 2007–2011 (figure 2(d)). Five of ten years of total thaw season precipitation recorded in OCF by VNP (2007–2016) were one standard deviation above the long-term average. Combined ECCC and VNP total thaw season precipitation for 2007–2019 (mean = 187 mm, median = 191 mm, n = 26) was greater than the 1981–2006 record (figure 2(e)) with Wilcoxon rank sum test results indicating a statistically significant difference between the intervals (p = 0.0485). Total snow water equivalent during 2007–2019 was mostly within or close to the long-term (1981–2006) standard deviation, except for 2011 when winter precipitation was well above average (figure 2(f)).

Figure 2. Temperature and precipitation data from 2007–2019 for Old Crow, Yukon (ECCC Station IDs 1582, 53023, and 26894, 2020), including (a) length of thaw season, (b) mean thaw season temperature, (c) mean winter season temperature, (d) total thaw season precipitation (mm) recorded by ECCC (black) and VNP (grey), (e) comparison of total thaw season precipitation for 1981–2006 (ECCC) and 2007–2019 (ECCC and VNP) intervals, and (f) total winter season precipitation (mm). The values above the x-axes for (b)–(d) and (f) represent the number of missing days. The solid and dashed horizontal lines represent the corresponding mean and one standard deviation for 1981–2006, respectively, which were derived from seasons that had less than 15 days of missing data.
Download figure:
Standard image High-resolution imageLake water isotope compositions (δL) from the 13-year, 14-lake monitoring data set span a large range of values from −25.8 to −11.7‰ and −200.3 to −121.0‰ for δ18O and δ2H in the spring, respectively, and −22.3 to −8.7‰ and −176.8 to −99.9‰ for δ18O and δ2H in the fall, respectively, reflecting a gradient of hydrological settings and diverse catchment conditions across OCF (figure 3). During both spring and fall, the majority (57.8% and 82.2%, respectively) of δL values plot above the LEL, which suggests greater influence on the lake water balances from isotopically-enriched sources (i.e. rainfall and possibly also water from permafrost thaw) rather than isotopically-depleted sources (i.e. snowmelt and water from ice-wedge melt; also see next paragraph). Lake water isotope values from the fall plot further away from the global meteoric water line (GMWL) along the LEL with some lakes surpassing the terminal basin steady-state isotope composition (δSSL), reflecting evaporative enrichment imparted by warmer summertime air and water temperatures from longer exposure to the atmosphere.

Figure 3. Lake water isotope compositions (δL) from the 14 OCF monitoring lakes for the 13 year sampling period during the (a) spring and (b) fall superimposed onto the four year isotope framework from Tondu et al (2013). The isotope framework includes the global meteoric water line (GMWL: δ2H = 8 δ18O + 10; Craig 1961) and the local evaporation line (δ2H = 4.7 δ18O − 71.2; Tondu et al 2013), with the latter defined by the mean annual isotope composition of precipitation (δP), the terminal basin steady-state isotope composition (δSSL) and the limiting non-steady-state isotope composition of a water body approaching complete desiccation (δ*). Isotope composition ranges for rain (δrain) and snow (δsnow) from waterisotopes.org (Bowen 2019), and ice-wedge (δice) and syngenetic peat pore-ice (δperm) from Bandara et al (2020), are also shown.
Download figure:
Standard image High-resolution imageLake input water oxygen isotope compositions (δ18OI) during the spring and fall display largely coherent temporal patterns during the 13 year monitoring period (figures 4(a) and (b)). Most individual lakes (10/14 for both spring and fall) displayed significant increasing trends in δ18OI according to Mann-Kendall trend analysis (table 1), and this was also reflected by the rising GAM-estimated trend-lines and narrow confidence intervals (figures 4(a) and (b)). The GAM-estimated trend-lines for both spring and fall approached the isotope compositions of rainfall and permafrost and diverged from isotope compositions of snow and ice-wedges, suggesting the former have become increasingly more important contributors to the lake water balances. Based on prior lake water categorization criteria established by Turner et al (2014a), all 14 lakes fell within the rainfall-dominated category by the last sampling period in 2019 (table 1).
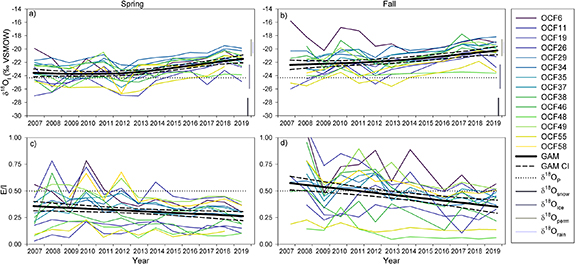
Figure 4. Time-series of (a), (b) oxygen isotope composition of input water (δ18OI) and (c), (d) evaporation-to-inflow ratios (E/I) for the 14 monitoring lakes from 2007 to 2019 during the spring and fall. The dotted line in panels (a) and (b) represents the mean annual isotope composition of precipitation (δP; −24.3‰; Tondu et al 2013). Isotope composition ranges for rain (δrain) and snow (δsnow) from waterisotopes.org (Bowen 2019), and ice-wedge (δice) and syngenetic peat pore-ice (δperm) from Bandara et al (2020), are also shown along the right y-axis in (a) and (b). The dotted line in panels (c) and (d) represents an E/I value of 0.5, a threshold previously used to define evaporation-dominated lake water balances in OCF (Turner et al 2014a). Black solid and dashed lines represent the generalized additive models (GAMs) and the 95% confidence interval (GAM CI), respectively.
Download figure:
Standard image High-resolution imageTable 1. Descriptive statistics for lake water δ18OI and E/I and summary statistics of the 13 year Mann-Kendall trend tests for spring and fall. Significant (sl < 0.05) trends are in bold type. The original lake hydrological category (Tondu et al 2013) and the current lake hydrological category based on analysis of the 13 year monitoring record are reported.
| δ18OI (Spring) | E/I (Spring) | ||||||||||
|---|---|---|---|---|---|---|---|---|---|---|---|
| Lake | Local name | Original category | Final category | Mean (‰) | Standard deviation | Mann-Kendall tau | Mann-Kendal sl | Mean | Standard deviation | Mann-Kendall tau | Mann-Kendal sl |
| OCF6 | Zelma | Evaporation | Rainfall | −22.17 | 1.38 | 0.15 | 0.502 | 0.44 | 0.13 | −0.44 | 0.044 |
| OCF11 | Snowmelt | Rainfall | −25.20 | 1.36 | 0.41 | 0.059 | 0.12 | 0.06 | 0.33 | 0.127 | |
| OCF19 | Evaporation | Rainfall | −23.21 | 1.29 | 0.54 | 0.012 | 0.50 | 0.13 | −0.44 | 0.044 | |
| OCF26 | Snowmelt | Rainfall | −23.64 | 0.96 | 0.67 | 0.002 | 0.19 | 0.03 | −0.51 | 0.017 | |
| OCF29 | John Charlie | Rainfall | Rainfall | −21.15 | 0.95 | 0.62 | 0.004 | 0.37 | 0.05 | −0.38 | 0.077 |
| OCF34 | Netro | Rainfall | Rainfall | −21.81 | 1.05 | 0.64 | 0.003 | 0.31 | 0.05 | −0.41 | 0.059 |
| OCF35 | Rainfall | Rainfall | −23.38 | 1.28 | 0.54 | 0.012 | 0.32 | 0.07 | −0.21 | 0.360 | |
| OCF37 | Ts'iivii zhit | Rainfall | Rainfall | −21.92 | 0.90 | 0.64 | 0.005 | 0.39 | 0.06 | −0.58 | 0.011 |
| OCF38 | Husky | Rainfall | Rainfall | −22.39 | 0.70 | 0.28 | 0.200 | 0.22 | 0.07 | −0.59 | 0.006 |
| OCF46 | Evaporation | Rainfall | −23.56 | 1.58 | 0.46 | 0.033 | 0.33 | 0.13 | −0.23 | 0.300 | |
| OCF48 | Hotspring | Rainfall | Rainfall | −24.10 | 0.63 | 0.28 | 0.200 | 0.13 | 0.05 | −0.38 | 0.077 |
| OCF49 | Marten | Rainfall | Rainfall | −21.95 | 1.12 | 0.59 | 0.006 | 0.47 | 0.07 | −0.49 | 0.024 |
| OCF55 | Snowmelt | Rainfall | −25.13 | 1.10 | 0.45 | 0.047 | 0.12 | 0.04 | −0.06 | 0.837 | |
| OCF58 | Mary Netro | Rainfall | Rainfall | −22.75 | 1.50 | 0.53 | 0.029 | 0.45 | 0.11 | −0.42 | 0.087 |
| δ18OI (Fall) | E/I (Fall) | ||||||||||
| OCF6 | Zelma | Evaporation | Rainfall | −18.66 | 1.43 | −0.24 | 0.304 | 0.72 | 0.21 | −0.39 | 0.086 |
| OCF11 | Snowmelt | Rainfall | −23.23 | 1.68 | 0.55 | 0.016 | 0.42 | 0.17 | −0.15 | 0.537 | |
| OCF19 | Evaporation | Rainfall | −21.82 | 1.16 | 0.78 | 0.001 | 0.67 | 0.19 | −0.75 | 0.002 | |
| OCF26 | Snowmelt | Rainfall | −22.49 | 1.19 | 0.67 | 0.005 | 0.30 | 0.05 | −0.09 | 0.755 | |
| OCF29 | John Charlie | Rainfall | Rainfall | −19.92 | 1.09 | 0.70 | 0.002 | 0.53 | 0.08 | −0.55 | 0.016 |
| OCF34 | Netro | Rainfall | Rainfall | −20.53 | 0.96 | 0.75 | 0.002 | 0.44 | 0.08 | −0.49 | 0.043 |
| OCF35 | Rainfall | Rainfall | −21.46 | 1.47 | 0.53 | 0.029 | 0.50 | 0.10 | −0.27 | 0.276 | |
| OCF37 | Ts'iivii zhit | Rainfall | Rainfall | −20.46 | 0.98 | 0.64 | 0.012 | 0.54 | 0.12 | −0.51 | 0.049 |
| OCF38 | Husky | Rainfall | Rainfall | −21.45 | 0.95 | 0.18 | 0.451 | 0.32 | 0.11 | −0.45 | 0.047 |
| OCF46 | Evaporation | Rainfall | −20.49 | 1.61 | 0.24 | 0.350 | 0.55 | 0.18 | −0.49 | 0.043 | |
| OCF48 | Hotspring | Rainfall | Rainfall | −23.68 | 0.33 | 0.49 | 0.043 | 0.11 | 0.09 | −0.60 | 0.013 |
| OCF49 | Marten | Rainfall | Rainfall | −20.77 | 1.22 | 0.38 | 0.119 | 0.64 | 0.12 | −0.45 | 0.062 |
| OCF55 | Snowmelt | Rainfall | −24.13 | 1.16 | 0.52 | 0.024 | 0.15 | 0.03 | −0.39 | 0.086 | |
| OCF58 | Mary Netro | Rainfall | Rainfall | −22.25 | 1.29 | 0.71 | 0.003 | 0.57 | 0.10 | −0.56 | 0.020 |
Lake evaporation-to-inflow (E/I) ratios during the spring and fall declined during the 13 year monitoring period, as captured by decreasing GAM-estimated trend-lines and narrow confidence intervals especially for the fall sampling period (figures 4(c) and (d)). Mann-Kendall trend analysis identified significant decline of E/I ratios in many of the lakes (6/14 for spring and 8/14 for fall; table 1). Although three lakes were classified as evaporation-dominated at the start of the monitoring record, none were classified as such by the end (table 1). Indeed, although the monitoring lakes spanned broad hydrological gradients early in the record, they all experienced common shifts in water balance regardless of whether they were initially categorized as snowmelt-, rainfall-, or evaporation-dominated. Additionally, multiple lakes had E/I values that exceeded 1.0 during the fall near the start of the record (figure 4(d)), indicative of lake drawdown and potential for desiccation, but none exceeded this threshold after 2009. These patterns suggest reduced importance of evaporative water loss from lakes in OCF during the ice-free season over the 13 year monitoring period.
4. Discussion and conclusions
Northern lake hydrology is influenced by interactions among many drivers, including air temperature, precipitation, catchment vegetation and permafrost dynamics, all of which are likely to continue to change with ongoing climate warming (e.g. Kattsov et al 2005, Prowse et al 2006, Arctic Monitoring and Assessment Programme (AMAP) 2011, Myers-Smith et al 2011, Derksen and Brown 2012, Krasting et al 2013, Lantz et al 2013, Lantz and Turner 2015, Arndt et al 2019). This has led to predictions of multiple hydrological trajectories for shallow northern lakes (e.g. Rowland et al 2010, Vincent et al 2011, Wolfe et al 2011b, Tondu et al 2013, Turner et al 2014a, MacDonald et al 2017).
In OCF, prior research hypothesized, based on analysis of 3–5 years of water isotope data, catchment characteristics, meteorological conditions and local observations, that hydrological responses would be distinct according to lake category (Tondu et al 2013, Turner et al 2014a; figure 5). Expansion of shrub growth was expected to increase the importance of snowmelt in some lake catchments, while an increase in the magnitude of evaporation was anticipated in other catchments with higher proportions of surface water. Indeed, these two scenarios were considered the most likely lake hydrological trajectories. When the monitoring lake dataset was examined at the five year mark by Tondu et al (2013), only three lakes demonstrated significant increasing trends in δ18OI, and none of the lakes displayed trends in E/I ratios. However, after Mann-Kendall trend test analysis of 13 years of δ18OI values and E/I ratios for each of the 14 monitoring lakes and summary trends depicted by the GAMs, results suggest that despite known variations in local lake catchment characteristics, an increase in wetness of OCF is directing an overarching trajectory on lake water balances. Based on the initial selection of diverse lakes and their broad geographic distribution (figure 1), as well as the narrow GAM confidence intervals which lend support to the trends displayed in figure 4, we contend that the time-series capture a common hydrological trajectory across the OCF landscape. Furthermore, comparison of δ18OI values to the isotope compositions of potential source waters indicate that rainfall and possibly also permafrost thaw are the candidates leading to more positive lake water balances. Evidently, the effects of rising rainfall and potentially permafrost thaw on lake water balances have outpaced other hydrological processes. These include supply of waters from snowmelt runoff that may be increasing in catchments with encroachment of shrub vegetation and from ice-wedge melt that may be expected due to high-latitude warming, as well as intensified open-water season evaporation with warmer temperatures and longer ice-free seasons. In summary, our data suggest that lakes in OCF are shifting and converging to a new hydrological regime, characterized by greater input of water and increased hydrological connectivity.

Figure 5. Modified schematic from Turner et al (2014a) that hypothesized potential future hydrological trajectories for lakes in northern thermokarst lake-rich landscapes such as OCF, under varying climate and catchment conditions. Bold lines represent the pathways that have become dominant in OCF during the past 13 years and the dashed box around 'Drained' represents a potential trajectory end point that may become more common. John Wiley & Sons.
Download figure:
Standard image High-resolution image
Meteorological records, although incomplete, also suggest an increase in the overall wetness of the OCF landscape in recent years driven by increased rainfall (figure 2(e); Lantz and Turner 2015), consistent with the lake δ18OI and E/I time-series trends (figure 4). Although lake input from permafrost thaw and the subsequent increase in catchment hydrological connectivity are promoted by wetter conditions and a lengthened thaw season (Beel et al 2021), it is more likely that increasing rainfall is the main driver of lake hydrological change because ice-wedge melt does not appear to be a strong contributor (figure 4). Ongoing research in OCF is integrating remote sensing with lake monitoring records to evaluate whether lake hydrological trajectories may be associated with catchment land cover change such as surface water accumulation, which may further delineate the importance of rainfall versus permafrost thaw contributions to lakes. Indeed, the influence of rainfall and permafrost thaw on potential hydrological trajectories of thermokarst lakes are intertwined, as outlined by Turner et al (2014a) and highlighted in figure 5. Increased rainfall can lead to higher rates of permafrost thaw, thermomechanical erosion and thermokarst lake expansion, and ultimately to more frequent drainage events (Mackay 1988, Hinkel et al 2007, Wolfe and Turner 2008, Avis et al 2011, Jones et al 2011, MacDonald et al 2012, Lantz and Turner 2015, Swanson 2019, Jorgenson et al 2020, Nitze et al 2020). Thus, we predict that while the past several years of monitoring data point to increased abundance of water in OCF, such conditions may further lead to 'rainfall-dominated' lakes, and their increasingly positive water balances likely will become far more susceptible to lateral drainage (figure 5). While the magnitude and pace of surface water change is not easily predicted, the potential loss of lake area and altered aquatic habitat due to enhanced lateral drainage could have far-ranging implications for biogeochemical cycling, wildlife and traditional use of OCF (Wolfe and Turner 2008, Wolfe et al 2011a, Balasubramaniam et al 2015, 2017).
Findings presented here demonstrate the utility of long-term isotope-based monitoring programs for identifying real-time trends and causes of thermokarst lake hydrological change in response to changing climate. Results show that lakes in OCF are trending towards more positive lake water balances driven by increased rainfall and possibly contributions from permafrost thaw. Most other studies documenting thermokarst lake change have utilized remotely-sensed datasets, which have proven highly useful for detecting where and when past change of surface-water area has occurred (e.g. Jones et al 2011, 2020, Lantz and Turner 2015, Nitze and Grosse 2016, Swanson 2019, Nitze et al 2020). High-resolution geospatial topographic information has also been used to estimate which lakes in the western Arctic coastal plain of Alaska are vulnerable to lateral drainage (Jones et al 2020). In contrast, our 13 year water isotope record provides real-time evidence of lake hydrological change and probable causes, even in the absence of complete meteorological records. These changes may not yet be detectable using remotely-sensed datasets. Hence, long-term monitoring programs utilizing water isotope tracers can provide early indication of pronounced lake hydrological change, which can precede substantial modifications visible at the landscape scale. It is likely that other northern lake-rich thermokarst landscapes are undergoing pronounced hydrological transitions in response to increases in temperature and shifting seasonality and amount of precipitation, which may consequently alter the frequency of catastrophic lake drainage events. However, we will not truly appreciate or recognize the processes influencing alteration in water abundance in thermokarst landscapes in unmonitored locations until after substantial change is detectable with remote sensing tools. This underscores the need for collaborative, sustainable, long-term monitoring programs of thermokarst lake landscapes. These programs are needed to inform natural resource stewards and stakeholders of probable consequences of climate change for aquatic ecosystems.
Acknowledgments
The authors would like to thank the community of Old Crow, the Vuntut Gwitchin Government, and the North Yukon Renewable Resources Council for their interest and logistical support that was key for sustaining this research program. Megan Williams was instrumental with coordinating the logistics. We are thankful to the many knowledgeable guides including Danny Kassi, James Itsi, James Linklater, Robert Bruce, who engaged in the research process during helicopter sampling campaigns to their traditional territories. We are also thankful to members of the Vuntut National Park staff (Jacqueline Menzies, Jeffrey Peter, and Leila Sumi), fellow researchers (Ann Balasubramaniam, Jana Tondu, and Bronwyn Hancock) and students (Luke Gray, Brent Thorne, Daniel Hughes, Joe Viscek, Christine Spencer, and Michelle Olejarz) who provided field and lab support. We thank Sasiri Bandara (University of Alberta) for providing ice-wedge and syngenetic peat pore-ice isotope data. Lastly, we thank the three reviewers and the Editor who provided valuable insight that enhanced the manuscript.
Data availability statement
The data that support the findings of this study are listed in table 1 and available upon request from the authors.
Funding
Funding for this research was provided by the Government of Canada International Polar Year Program, Natural Sciences and Engineering Research Council of Canada Northern Research Chair, Discovery Grant, and Northern Supplement programs, Parks Canada Agency, Polar Continental Shelf Program, Polar Knowledge Canada, the Northern Scientific Training Program and Brock Library Open Access Publishing Fund.
Conflict of interest
The authors declare no conflict of interest.