

Abstract
Reactive nitrogen (N) inputs in agriculture strongly outpace the outputs at the global scale due to inefficiencies in cropland N use. While improvement in agricultural practices and environmental legislation in developed regions such as Western Europe have led to a remarkable increase in the N use efficiency since 1985, this lower requirement for reactive N inputs via synthetic fertilizers has yet to occur in many developing and transition regions. Here, we explore future N input requirements and N use efficiency in agriculture for the five shared socioeconomic pathways. Results show that under the most optimistic sustainability scenario, the global synthetic fertilizer use in croplands stabilizes and even shrinks (85 Tg N yr−1 in 2050) regardless of the increase in crop production required to feed the larger estimated population. This scenario is highly dependent on projected increases in N use efficiency, particularly in South and East Asia. In our most pessimistic scenario, synthetic fertilization application rates are expected to increase almost threefold by 2050 (260 Tg N yr−1). Excepting the sustainability scenario, all other projected scenarios reveal that the areal N surpluses will exceed acceptable limits in most of the developing regions.
Export citation and abstract BibTeX RIS

Original content from this work may be used under the terms of the Creative Commons Attribution 3.0 licence.
Any further distribution of this work must maintain attribution to the author(s) and the title of the work, journal citation and DOI.
1. Introduction
Nitrogen (N) is a key nutrient for living organisms and has been exceedingly used in food production since the discovery of the Haber-Bosch process for fixing N2 in the early part of the 20th century (Fowler et al 2013, Galloway et al 1995, Smil 2001). Since then, the application of synthetic fertilizers has boosted the global agricultural production and allowed for the exponential increase in the global population (Galloway et al 2004).
Since at the global scale the crop N yield is less than 50% of the total N inputs (Lassaletta et al 2014) there are major N losses to the environment. N is lost from the soil-plant system by denitrification in the form of dinitrogen (N2), nitrous oxide (N2O) and nitric oxide (NO), ammonia (NH3) volatilization, nitrate (NO3−) leaching, and via water runoff and soil erosion (Bouwman et al 2013). NO, N2O, and NH3 are gases that not only affect air quality, ozone chemistry and heat retention in the atmosphere, but also negatively affect human health (Sutton et al 2013). NO3− in drinking water has potential health impacts and has thus been subjected to regulations in several countries, (e.g. the USA and the European Union; Bryan and van Grinsven 2013, van Grinsven et al 2015a).
Increased N losses to the environment adversely affect freshwater systems, the coastal ocean, and terrestrial ecosystems (Bouwman et al 2005, Seitzinger et al 2010). Nutrients, such as N, stimulate primary production in the hydrosphere, which can ultimately lead to the proliferation of (harmful) algal blooms and the development of hypoxic dead zones, which are detrimental for aerobic organisms (Howarth and Marino 2006, Rabalais 2002, Rabalais et al 2010, Turner et al 2003).
Future global food demand will depend on many factors, including population change, technology advancement, trade and global cooperation, and dietary changes as a consequence of economic growth (e.g. Billen et al 2015, Lassaletta et al 2016, van Grisnven et al 2015b, Westhoek et al 2014). These elements have been integrated into the shared socioeconomic pathways (SSPs; Ebi et al 2014, Kriegler et al 2014, O'Neill et al 2014), which are global storylines that follow internally consistent assumptions on a range of socioeconomic factors, varying according to mitigation and adaptation challenges with a focus on climate change. These SSP scenarios have been implemented with the Integrated Model to Assess the Global Environment (IMAGE) version 3.0 from 2006 until 2050, resulting in energy, food production and trade, greenhouse gas emissions, climate change, and land use and cover projections based on prescribed population and economic growth for 26 global regions (van Vuuren et al 2017).
In this paper, we quantify and scrutinize the future N inputs into croplands required that satisfy the demanded agricultural N production on a global scale. N agricultural production was derived from IMAGE 3.0 assuming the contrasting social, agronomical, and technological evolutions of each SSP. We furthermore calculate the scenario-specific future need for synthetic fertilizers according to the regional agricultural N dynamics. Ultimately this analysis can pinpoint where specific regions may pose environmental issues related to N inputs into croplands and the feasibility for these regions to improve their N use efficiencies by improving N management in croplands.
2. Methods
2.1. General
We calculate future (2006–2050) global N inputs into croplands by assessing the crop requirements according to each SSP scenario and for each of the IMAGE world regions (table S2). The model uses cropland and grassland areas as simulated with the IMAGE model (Stehfest et al 2014) for the five SSPs (van Vuuren et al 2017). Synthetic N fertilizer (S, kg N ha−1 yr−1) inputs into croplands are estimated as the difference between total N inputs into croplands (I, kg N ha−1 yr−1), and the sum of manure (M, kg N ha−1 yr−1), atmospheric deposition (D, kg N ha−1 yr−1), biological N2 fixation (F, kg N ha−1 yr−1) applied into or reaching croplands:
N inputs from manure, atmospheric deposition and biological N2 fixation are taken from the IMAGE Global Nutrient Model (IMAGE-GNM, Beusen et al 2015, 2016, see SI4). N inputs in intensive grasslands are calculated as the N withdrawn from animal products (N in production of meat, milk, and carcass withdrawal, plus N excretion in grasslands) for intensive livestock production (SI6).
Crop N yields (Y) represent the N in harvested products. We use historical and future aggregated crop N yields obtained from the production for all food, feed, fiber, biofuel and industrial crops and stimulants as well as the N content in the harvested product of each crop, as provided by IMAGE 3.0 for the five SSPs (van Vuuren et al 2017, see SI1). Y can be related to the N inputs in a variety of ways. For instance, the N use efficiency (NUE) is a measure that relates the total N inputs (I) to the crop N yields, that is NUE = Y/I. Similarly, Lassaletta et al (2016), (2014) related Y (expressed in kg N ha−1 yr−1) to I using a hyperbolic relationship as follows:
where Ymax (kg N ha−1 yr−1) represents the asymptote for the curve, or the hypothetical maximum yield (see SI2). Note that Ymax differs from the potential yield as defined by the agronomic yield gap approach (e.g. van Ittersum et al 2016). It rather represents a hypothetical value that fits the yield-input relation according to equation 2. This simple yet robust relation based on Ymax has been successfully used to describe input-yield curves at the country scale and for large global regions (Lassaletta et al 2014, Lassaletta et al 2016, Mueller et al 2017), whereby changes in agricultural management (e.g. fertilization technique, irrigation, rotations, crop varieties) are directly reflected in variation of the Ymax value (Lassaletta et al 2014, Lassaletta et al 2016, Zhang et al 2017, Mueller et al 2017). With an unchanged Ymax, N yield can only increase by adding N inputs. Improved N management or improved crop varieties lead to a larger Ymax value, such that with the same input level, N yield will be higher; or the same N yield can be obtained with less N inputs (see supplementary figure 1 available at stacks.iop.org/ERL/13/044008/mmedia). The merger of equations 1 and 2, provides the solution for the synthetic N fertilizer required for each region and SSP:
Y-I curves with their respective Ymax have been established for the 26 IMAGE regions at the base year (2005) as a base to develop assumptions for scenario construction.
Production increase can be achieved not just by increasing the crop N yield, but also by expanding the cropland area. The methodology for differentiating the contribution toward future cropland N production (increasing area vs. increasing yield) is given in SI5.
Table 1. SSP descriptions (modified after Mogollón et al in preparation)
| Property | 2050 level | ||||
|---|---|---|---|---|---|
| SSP1 | SSP2 | SSP3 | SSP4 | SSP5 | |
| Keyword | Sustainability | Middle of the road | Fragmentation | Inequality | Conventional development |
| Technological development | Rapid | Medium | Slow | Slow | Rapid |
| Progress towards development goals | Good | Some | Failure to achieve goals | Highly unequal | Market-driven |
| Resource intensity | Low | Medium | Very low | Highly unequal | Conventional development |
| Population (106 inhabitants) | 8531 | 9243 | 10038 | 9213 | 8629 |
| GDP/capita (2005 US$, market exchange rate) | 24563 | 17877 | 12024 | 17500 | 32449 |
| Global greenhouse gas emissions (GtC-eq yr−1) | 15.6 | 19.8 | 21.5 | 18.0 | 27.9 |
| Global mean temperature increase relative to 1860 (°C) | 2.1 | 2.3 | 2.3 | 2.2 | 2.5 |
| Crop production (Mton d.m.a) | 4749 | 5111 | 5069 | 4855 | 5215 |
| Area arable and permanent crops (Mha) | 1522 | 1735 | 1846 | 1732 | 1720 |
| N Production (Tg N yr−1) | 120 | 132 | 137 | 126 | 140 |
| Ymax calculation (FYmax, equation S2) |  |
equation S1 | Same as previous year | wealth dependent | equation S1 |
2.2. The SSPs scenarios
The SSPs include a sustainability scenario (SSP1, sustainability) in which the world makes good progress toward reducing our environmental impact, with ongoing efforts to achieve development goals while lessening resource intensity and fossil fuel dependency. SSP2 (business as usual) typifies the middle of the road pathway, where current trends propagate toward the future. SSP3 (fragmentation) consists of a fragmented world with weak institutions and low regional development. SSP4 (regional inequality) represents a scenario with a highly unequal world in which a relatively small, rich global elite develops a fast pace, while a larger, poor group is vulnerable to the impact of climate change. SSP5 (economic development) concerns a global development that focuses on economic growth with continued high greenhouse gas emissions.
2.3. Calculating N input and surplus in croplands
N in manure (M), N deposition (D), and biological N fixation (F) by crops were taken from the IMAGE-GNM model (Beusen et al 2016). For further details see SI4.
Synthetic N fertilizer use is calculated with equation (3) based on the total N inputs (I). I for SSP1 (and the wealthy regions in SSP4) is calculated based on modifying the target NUEs of Zhang et al (2015) to our global regions to calculate Ymax. These NUEs assume, among other things, global improvements in water and nutrient management, in the timing of fertilizer application, the cultivation of crops best adapted to the local environment, global access to advanced agronomic technologies, and the implementation of policies to regulate N runoff (Zhang et al 2015). For SSP3 (and the SSP4 poor regions) we assume a constant Ymax (from 2005) provided a lowermost NUE of 20% is met. For SSP2, SSP5, and the middle-income regions in SSP4, equation (3) still contains two unknowns (S and Ymax). Equation (3) was thus solved for each region establishing a relation between Ymax and the gross domestic product—per capita (GDP-pc). The future Ymax for this correlation was calculated using the crop N yield, biological fixation, deposition, and manure of SSP2, together with the synthetic N fertilizer projections from FAO-2050 (Alexandratos and Bruinsma 2012). For further details see SI3. An additional assumption among scenarios is that world regions with Y < 30 kg N ha−1 yr−1 were inferred to adhere to a constant Ymax, provided it meets a minimum NUE constraint of 20% (see table 1). Furthermore a maximum NUE constraint of 85% is applicable to all scenarios (e.g. Giller et al 2004).
N surplus corresponds to the difference between N inputs and outputs. We compare the N surplus for each region and each SSP in 2050 with the maximum allowable threshold of 80 kg N ha−1 yr−1 according to EUNEP (EUNEP 2015). A summary of the various datasets used in this study is available in table 1.
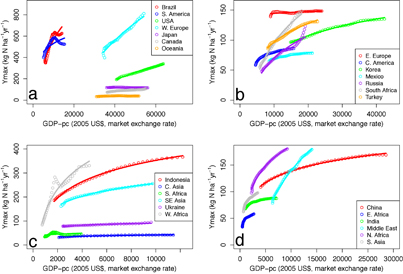
Figure 1. GDP-pc−Ymax relation for FAO projections from 2011 until 2050 for various regions. (a) High-income regions and biological N-fixing regions. (b) Middle-income regions. (c) Low-income regions. (d) Rapid agricultural growth regions.
Download figure:
Standard image High-resolution image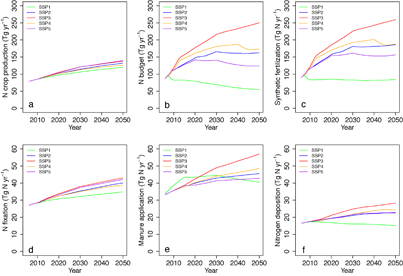
Figure 2. (a) Global N production, (b) global N budget; and global N inputs in croplands from (c) synthetic fertilizers, (d) fixation, (e) manure, and (f) deposition from 2006 until 2050. The green lines represent SSP1, the blue lines represent SSP2, the red lines represent SSP3, the orange lines represent SSP4, and the purple lines represent SSP5. Note the different Y axis for panels (a), (b), (c) vs panels (d), (e), (f).
Download figure:
Standard image High-resolution image3. Results
3.1. GDP-pc—Ymax relation
Figure 1 shows the Ymax based on the FAO-2050 estimates for future total N inputs following business as usual projections as a function of the GDP-pc for SSP2. The positive correlation between GDP-pc and Ymax can be explained by improvements in agricultural technology with increasing wealth. Most countries, however, show an attenuated increase of Ymax with increasing GDP-pc, which adheres to the law of diminishing returns. A notable exception is Japan, which has a decreasing GDP-pc−Ymax relation.
3.2. Global N budget under the 5 SSPs scenarios
Figure 2(a) shows that all SSPs follow a modest increase in the crop N production until 2050. This increase, however, is highest for SSP5, which grows by 61 Tg N yr−1, in comparison to most attenuated N production increase (SSP1 by 41 Tg N yr−1). Figure 2(b) shows the N surpluses (positive budgets, inputs > outputs) up to the year 2050. The N surplus in 2005 (86 Tg N yr−1) increases for SSP2 (163 Tg N yr−1), SSP3 (250 Tg N yr−1), SSP4 (173 Tg N yr−1), and SSP5 (124 Tg N yr−1) and only decreases under SSP1 (55 Tg N yr−1).

Figure 3. N inputs per hectare for deposition (red), synthetic fertilizer (green), fixation (cyan), and manure (purple) for 2005 and 2050 according to the 5 SSPS. (a) High income and N fixing regions, (b) middle-income regions, (c) low-income regions, (d) rapid growth regions.
Download figure:
Standard image High-resolution imageFigures 2(c)–(f) consists of the total N inputs into global croplands. In 2006, the sum of biological N2 fixation (figure 2(d)), manure (figure 2(e)) and atmospheric N deposition (figure 2(e)) constituted about 46% of the total N inputs into global croplands. The share of these inputs, however, changes substantially toward 2050 for the five SSPs. In SSP1 they eventually represent at 51% of N inputs. SSP2, SSP3, SSP4 show a decrease in the proportion of these inputs because of increased use of synthetic N fertilizers (figure 2(c)), with values of 44%, 33%, 37%, respectively. The temporal pattern for the N surpluses in global croplands (figure 2(b)) strongly resembles the synthetic N fertilizer trends (figure 2(c)), indicating that the former is highly controlled by the latter. The proportion of these inputs for SSP5 decreases toward 2025, but eventually increases back to a value of 46%. SSPs 2–5 all follow a steady increase in manure, deposition, and fixation as N inputs into croplands. SSP1 shows other patterns that reflect changing practices under this sustainable pathway, notably full manure recycling and lower atmospheric N deposition.
Figure 2(c) shows that global synthetic N fertilizer use by 2050 between the SSP scenarios varies by a factor of three. The use in SSP1 remains for the most part stable, with values in the range of 85 Tg N yr−1. SSP2 shows a rapid increase in global fertilizer use that reaches 180 Tg N yr−1 by 2030, and around 185 Tg N yr−1 by 2050. SSP3 is marked by the highest increase in synthetic N fertilizer inputs with values reaching 260 Tg N yr−1. SSP4 shows an increase of global synthetic N fertilizer use that falls between those of SSP2 and SSP3 reaching values of 200 Tg N yr−1 in 2040, before dropping to around 190 Tg N yr−1. SSP5 follows a trend similar to SSP2, but after 2020 levels off to a range of 150–160 Tg N yr−1.
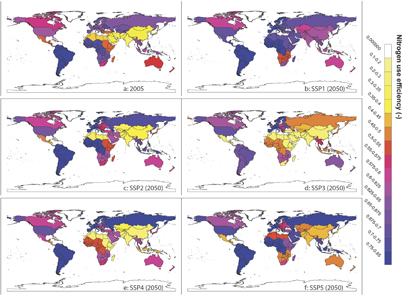
Figure 4. Global maps of N use efficiency for the IMAGE regions. (a) Baseline year (2005), (b) SSP1 (2050), (c) SSP2 (2050), (d) SSP3 (2050), (e) SSP4 (2050), (f) SSP5 (2050).
Download figure:
Standard image High-resolution image3.3. Regional N inputs under the 5 SSP scenarios
Figure 3 shows the change in N inputs, outputs and surpluses per hectare from the base year (2005) until 2050 for each of the SSPs and for each region. The high and middle income regions (figure 3(a)), with large acreage under N2-fixing crops (Brazil and South America), show only a minor increase in the N-inputs to croplands, with the exception of Japan and Western Europe, which are characterized by a marked decrease and minor variation among the various SSPs. Figure 3(b) represents the remaining middle income regions. With the exception of Eastern Europe, all these regions show a significant increase of the areal input rates in SSP3. In the low-income regions, synthetic N fertilizer use is predicted to increase considerably from the contemporary low levels, particularly in Western Africa. Figure 3(d) shows the N inputs for rapidly growing regions, which show a strong contrast between scenario results, particularly between SSP1 and SSP3. In all scenarios, the results for Eastern Africa show that synthetic N fertilizer use will have to increase rapidly to meet the crop demand projections. Only in high-income regions is the threshold surplus of 80 kg N ha−1 yr−1 not reached in any of the scenarios by 2050. In the rest of the regions the areal surplus dramatically surpasses this limit, particularly in SSP2, SSP3 and SSP4. The potential emissions of N compounds to the environment in large regions such as China and India is expected to increase more than three-fold in the most pessimistic situations.
3.4. N use efficiencies and surpluses in 2050
Figure 4 shows the regional values of N use efficiency in 2005 and 2050 for the various SSPs. NUE is high in South America and Western Africa in 2005 (early stage of development as in Zhang et al (2015)), but much less so in the Middle East, North Africa, India, China and Rest of South Asia (figure 4(a)). SSP1 (figure 4(b)) shows the expected regional NUEs of Zhang et al (2015), with the lowest values at 60%. SSP2 (figure 4(c)) follows the GDP-pc –Ymax curve, and develops a marked interregional NUE variation, with the wealthy and N2 fixing regions remaining high, and regions such as North Africa, China, and India remaining low. SSP3 (figure 4(d)) causes a net decrease in the NUE for all regions, with values ranging from the minimum allowable value of 20%–70%. SSP4 (figure 4(d)) shows an unequal global NUE development, while SSP5 (figure 4(e)) follows a NUE development to SSP2, but with comparably higher nutrient use efficiencies due to the higher GDP-pc for this scenario.
4. Discussion
Nitrogen fertilization has slowly increased since the early 20th century with a discernible acceleration post 1950. Different approaches have been used to estimate future total N inputs to croplands at the global scale. Bodirsky et al (2014), Liu et al (2016), and Lassaletta et al (2016) used food production, consumption and trade as a basis for forecasting the future N budget in croplands. Our methodology differs in that we do not model the crop N yields. Rather, we take the values generated by the integrated assessment model IMAGE 3.0, which has comprehensively incorporated the socioeconomic aspects of food production and trade to generate a regional N crop production demand. Our approach is similar to Lassaletta et al (2014), but whereas they used historical Y and I to calculate the evolution of Ymax from 1960–2010, we used GDP-pc to estimate Ymax, and calculated Y from IMAGE N production data and land use. These estimates were, in turn, used to calculate I (and eventually S) from 2005 until 2050.
Based on historical trends, Galloway et al (2004) predicted N inputs of 270 Tg N yr−1 by 2050, a figure that compares well with our SSP5 prediction (264 Tg N yr−1). Liu et al (2016) estimated that total N inputs to croplands will reach 270 Tg N yr−1 by 2030, a value which falls between our SSP2 and SSP5 predictions (280 Tg N yr−1 and 262 Tg N yr−1). Excluding our SSP1 scenario, the range of N inputs in croplands globally (262–337 Tg N yr−1) closely follow the estimates of Bouwman et al (2009) who projected future total N inputs into croplands in 2050 to be 292–378 Tg N yr−1 for the four Millennium Ecosystem Assessment scenarios. Our SSP1 scenario, which follows the NUEs of Zhang et al (2015), has predicted total N inputs to croplands of (174 Tg N yr−1) by 2050. These values are slightly larger than the values of this latter study (160 Tg N yr−1). This discrepancy is due to the lower projected requirements in Zhang et al (2015) as compared to our SSP1 scenario (107 Tg N yr−1 vs. 120 Tg N yr−1).
Our estimates of fertilizer use in 2050 range from 85 Tg N yr−1 (SSP1) to 260 Tg N yr−1 (SSP3). The FAO projection for synthetic N fertilizer use of 138 Tg N yr−1 in 2050 (Alexandratos and Bruinsma 2012) is lower than SSP3, SSP4 and SSP5. SSP1 (sustainability) is much lower than FAO, and SSP2 (using FAO trends in productivity) is very similar. Crucially, only SSP1 would be within the planetary boundaries established for N, which are defined as a safe operating space for human societies (de Vries et al 2013, Steffen et al 2015).
Advances in crop management can lead to both an upward shift in Ymax and also an improvement in NUE. Lassaletta et al (2014) determined four possible temporal trajectories for Ymax in various countries from 1960–2010. In their type 3 countries, there was a sufficient increase in Ymax leading to a noticeable improvement in NUE and thus increasing crop N yields were maintained even with decreasing N inputs. Type 3 particularly applies to Western Europe. Their type 2 suggested an increase in Ymax coupled to an increase in the N input, such that NUEs would improve despite an increase in synthetic N fertilizer usage, a situation observed in the USA and Brazil. For the future, a combination of these paths on a global scale is required in order to reach the NUEs suggested by Zhang et al (2015) by 2050. For instance, countries must increase their Ymax values by a factor ranging from 1.1 (Japan) up to 4.4 (Eastern and Western Africa) during this timeframe. On a country basis, Lassaletta et al (2014) found that most countries in their type 2 and type 3 increased their Ymax between 1960 and 2010 by a factor of 2.5, with increases of up to a factor of 4 for countries with low Ymax values (< 50 Tg N yr−1) in 1960 (Lassaletta et al 2014). Thus, countries and regions with low Ymax values may be able to achieve much larger increases in Ymax toward the year 2050. Nevertheless, countries in Lassaletta's type 1 and type 4 had either a stable Ymax or were in the N mining realm. Thus, in order to reach the NUE of SSP1, Lassaletta's type 1 and type 4 countries must switch to type 2 or type 3.
High-income regions show little variations in N inputs between the five SSP scenarios because they are already characterized by high Ymax values and NUEs in 2005. Some low- and middle-income regions show little variation for the various SSPs due to low crop demand arising from slow economic and population growth (e.g. Russia, Ukraine, Southern Africa). The greatest potential to improve N yields due to an increase in Ymax thus lies in the remaining middle-income and the rapidly developing countries (figure 3). These regions include South Asia, India, and China, who are characterized by significant large populations and agricultural production, but whose Ymax values are still relatively low (< 110 Tg N yr−1). These regions generally saw little variation in their Ymax development for the 1960 to 2000 timeframe (type 1; Lassaletta et al 2014). Nevertheless, they are predicted to see an acceleration in both population growth and the demand for animal proteins in the future. Therefore, improving agricultural management can mean the difference between only moderate increases in synthetic N fertilizer application (SSP1) and a strong increase in synthetic N fertilizer application coupled to low NUE (figure 4), which consequently would lead to large N surpluses and N losses to the environment.
On a global scale, little to no temporal improvement in Ymax represents the main assumption for our SSP3 scenario and our SSP4 scenario for low-income regions. These scenarios portray a world that will increasingly rely on synthetic N fertilization with NUEs significantly diminishing (figure 4). The SSP5 scenario represents a world with a population of similar proportion to SSP1 (2050) but with less environmental concern and more wealth, which directly translates into more animal protein consumption. While not as substantial as in SSP1, economic improvements in NUEs and Ymax also occur in SSP5. However, the crop N production demanded from agricultural systems is highest of all SSPs, and the N budget difference between SSP5 and SSP1 typically exceeds 60 Tg N yr−1. Likewise, the N budgets increase with time for the SSP2 scenario, despite an increasing Ymax. These scenarios demonstrate that Ymax improvements that are solely tied to economic development are also not sufficient to keep up with the food demand and thus will require an increase in the future global synthetic N fertilizer use in agriculture.

Figure 5. (a) Contribution of area change (red) and yield change (blue) to the increase in cropland N production between 2005 and 2050. (b) Ratio of global cropland area in 2050 to that in 2005.
Download figure:
Standard image High-resolution image
The significant increase in crop production from higher N fertilization does not prevent the need for considerable expansion of agricultural land, which takes place under all scenarios except SSP1 (figure 5(b)). While at the IMAGE region scale, no N mining takes place, Lassaletta et al (2014) found that several individual countries such as Morocco and Nigeria have been characterized by negative soil N budgets since the 1960s. This type 4 Ymax path is associated with soil N mining due to low fertilizer application. Depletion of N and other nutrients such as P could trigger cropland expansion. N mining, coupled to increasing N crop demand may pose environmental challenges, as it entices land encroachment and deforestation to make way for new agricultural land. Land expansion may significantly contribute to additional crop production, with up to 32% contribution for SSP3. In contrast, improvements in Ymax for SSP1 lead to no requirements for areal cropland expansion (figure 5(a)).
Ultimately, the dramatic increase in the areal N surplus for most of the studied scenarios threatens the sustainability of food production systems. Only SSP1 reconciles crop production with water and air quality preservation, while in the other storylines the environmental burden would exceed acceptable limits of N pollution and additional environmental impacts due to new agricultural land acquisitions at the expense of natural areas.
Additional N fertilizer application is also required in intensive grasslands due to human consumption of ruminant products. Our estimated N extraction from grasslands with intensive ruminant production was roughly 6.5 Tg N yr−1 in 2005, which is somewhat higher than the 3–4 Tg N yr−1 previously estimated (Bouwman et al 2013). This N imbalance increases for most scenarios, with estimates in 2050 of 4.9 Tg N yr−1, 23 Tg N yr−1, 45 Tg N yr−1, 42 Tg N yr−1, and 28 Tg N yr−1 for SSP1, SSP2, SSP3, SSP4, and SSP5, respectively. N extraction from intensive systems could eventually lead to insufficient N availability for grass production. Therefore, additional fertilization and/or better legume management of intensive grasslands to meet these removed amounts must take place to maintain a balanced system. These values represent 6%–22% of the predicted synthetic N fertilization use in global croplands and thus potential future locations where N application may be necessary.
Conclusions
In order to achieve a global sustainable balance between cropland production and ecosystem preservation, it is important to limit the amount of N emitted to the environment. Following the NUE targets of Zhang et al (2015) for SSP1, the global anthropogenic reactive N produced can be stabilized at current levels (and even slightly decrease) on the global scale. This scenario also leads to a marked decrease in the reactive N demand per capita in agriculture. In contrast, all other scenarios forecast an increase in synthetic N fertilizers to boost agricultural production. The increase in demand due to poor socioeconomic choices could produce a severe environmental impairment in 2050.
Acknowledgments
Funding for this research was provided by Marie Skłodowska-Curie Individual Fellowship Grant number 661163 awarded to JMM. AFB and AHWB received support from PBL Netherlands Environmental Assessment Agency through in-kind contributions to The New Delta 2014 ALW projects no. 869.15.015 and 869.15.014.