

Abstract
Human-induced climate change poses a major threat to the reliable water supply in many highly populated regions. Here we combine hydrological and climate model simulations to evaluate risks to the water supply under projected shifts in the climate at the Paris Agreement warming levels. Modelling the primary surface water sources for Melbourne, Australia, we project that the risk of severe water supply shortage to the climate-dependent portion of the system increases substantially as global warming increases from 1.5 °C to 2.0 °C. Risks are further exacerbated by increases in water demand but substantially ameliorated by supply augmentation from desalination. We demonstrate that reductions in precipitation, rising temperature and growth in water demand combine to substantially amplify the risk of severe water supply shortage under near-term global warming in the absence of a climate-independent supply. This risk amplification is not as apparent in assessments based on meteorological drought alone. With the diminishing opportunity of meeting the 1.5 °C Paris target, our study highlights the need to accelerate greenhouse gas mitigation efforts to reduce risks to climate dependent water supply systems.
Export citation and abstract BibTeX RIS

Original content from this work may be used under the terms of the Creative Commons Attribution 3.0 licence. Any further distribution of this work must maintain attribution to the author(s) and the title of the work, journal citation and DOI.
1. Introduction
Intense and prolonged droughts place great stress on human and natural systems and can trigger costly emergency water management measures to safeguard a safe and reliable water supply. Changing rainfall regimes and increasing temperatures influence the reliability of water supply to growing populations. Highly concentrated populations located in some temperate and subtropical regions are likely to experience rainfall reductions due to the poleward expansion of the Hadley cell and related changes in atmospheric circulation in coming decades (Seager et al 2007, Seidel et al 2008). In many regions, such changes may be sensitive to thresholds such as whether the Paris Agreement's (UNFCCC Conference of the Parties (COP) 2015) 1.5 °C or 2.0 °C global warming targets are met, which are in turn conditional on the collective success of nationally determined contributions of the world's nations. This sensitivity and the lack of detailed information on water resource impacts at 1.5 °C and 2.0 °C of warming prompts the need for rapid and robust assessments of hydrological drought risk at these levels of warming (Henley and King 2017, King et al 2017). Here we provide a methodology for assessing these risks, using a representation of Melbourne's water supply system as a case study.
Previous assessments of drought under a warming climate (Dai 2013, Trenberth et al 2014, Dai and Zhao 2017), and specifically at 1.5 °C and 2.0 °C of warming (Schleussner et al 2016, Lehner et al 2017, Döll et al 2018, Samaniego et al 2018, Liu et al 2018), have largely focused on meteorological or agricultural drought by estimating future precipitation deficits, runoff from global hydrological models and/or soil moisture water balance with indices such as the Palmer Drought Severity Index (Cook et al 2015) (PDSI). However, notwithstanding the advantages of the PDSI, particularly for agricultural purposes at seasonal timescales, sparsely gridded soil moisture indices cannot be used to deduce impacts on critical water infrastructure such as drinking water supplies for major cities. Drought probabilities based on precipitation alone can underestimate risk (Ault et al 2016) and PDSI metrics do not consider the nonlinear dependencies between water demand, water restrictions, reservoir storage capacity and the reliability of supply (Henley et al 2013, Turner et al 2014, van Loon 2015).
In this study, we combine stochastic hydro-climatological modelling, rainfall-runoff modelling and climate model data. We use a stochastic model to represent the statistical characteristics of hydroclimatic data, a rainfall-runoff model to simulate the behaviour of a water supply catchment under a range of climate regime shifts, and climate model simulations to quantify the degree of shifts under policy-relevant levels of global warming. The following section describes the data and methods used in this study.
2. Data and methods
2.1. Data
Rainfall and temperature observations are from the Australian Bureau of Meteorology's Australian Water Availability Project (AWAP) (Jones et al 2009). Inflow observations for Melbourne's four major water harvesting reservoirs (Thomson, Upper Yarra, O'Shannassy and Maroondah) are supplied by Melbourne Water. Climate model data are from the CMIP5 (Taylor et al 2012a) archive.
2.2. Stochastic model
To assess the risk of changes in precipitation (P) and temperature (T) to a water supply system we combine a stochastic hydrological risk assessment with climate model projections of future rainfall and temperature change (figure S1 shows the overall methodology and is available online at stacks.iop.org/ERL/14/084028/mmedia). We start by synthetically generating 1000 replicates of monthly P and T of the same length as the observed series, 100 years. This large number of replicates from the stochastic approach allows for more precise risk estimates than are possible if only one replicate (e.g. the observed series) is used. This is because risks computed from a stochastic ensemble are less sensitive to sampling variability. With regards to model accuracy, the stochastic model accounts for both the correlation between P and T and the temporal autocorrelation of both series, using a multi-site lag-one autoregressive AR(1) model with Box-Cox transformation (Matalas (1967) and section 2.3 in the study by Peel et al (2015) contain detailed explanations). The model preserves the annual probability distributions (figures S3–4), annual serial autocorrelation functions for lags of 1–20 years (figures S5–6) and the covariance structure (figure S7) of water year (March–February) P and T. We determine therefore that the model is a suitably accurate representation of rainfall and temperature at this spatio-temporal scale. We then simulate mean-state hydroclimatic change using annual shifts, ΔP (%) and ΔT (°C), from a 1961–1990 baseline. We apply these shifts on a regular grid (ΔP: −25 to +25%, ΔT: −0.5 to +3.0°C) to our synthetic water-year P and T time series. We then disaggregate our synthetic time series from annual to monthly time step using a non-parametric k-nearest neighbour (kNN) bootstrap sampling approach (Lall and Sharma 1996). In this method, monthly fragments of the stochastically generated annual total are sampled probabilistically from observed annual data (Henley et al 2013) to obtain realistic sequences of monthly P and T that resemble the annual and interannual characteristics of the observed data.
2.3. Catchment and reservoir model
We then generate monthly reservoir inflow sequences, Q, using the lumped conceptual Precipitation-Evapotranspiration-Runoff Model (PERM) of Peel et al 2015, (see section 2.5 of that study). The inputs to PERM are monthly P and T. The output is monthly catchment runoff, Q, which we take as total inflow into the system's four major water storages. A time series of T is used as an input to PERM rather than potential evapotranspiration (PET), as climate model projections of T are considered more reliable than projections of variables required to estimate PET. In the case study region, this decision is likely to be acceptable as the catchments are largely water-limited (McMahon et al 2015), however this may not be true for other types of catchments. The model is calibrated using P, T and Q data from 1913–2012. The Nash–Sutcliffe Efficiency (NSE) for monthly runoff is 0.82, which indicates a good calibration.
Reservoir behaviour is simulated with a mass balance model similar to that used by Henley et al (2013). The model includes a seasonally-varying monthly demand, increasing demand due to population growth, savings from water restrictions, system losses and augmented supply from desalination. The reservoir's initial storage level is simulated probabilistically with a gamma distribution (figure S8). Water demand and losses are modelled with a seasonally varying pattern linked to monthly mean temperature (figure S9). The demand pattern is assumed to remain constant in a warmer climate. To test the sensitivity of increasing demand, we represent higher population demand scenarios by increasing the total demand (D) as a fraction of the historical annual average inflow (Q) into the four major water storages (594 GL) from a 'low' demand level of D/Q = 0.7 to a 'very high' demand level of D/Q = 0.9. The highest level simulated here is an approximation of the median demand projection at around 2045–2050 (City West Water et al 2017). Water restrictions and other demand management measures, which may include water pricing, are simulated in four stages such that the total demand reduces by 5%, 10%, 20% and 25% when the total reservoir storage level falls below 60%, 45%, 20% and 10%, respectively. Note that managed aquifer recharge is not possible as a major water supply measure in the study region. The water supply shortage risk is calculated by dividing the number of months spent under the severe shortage limit (10% storage) by the total number of months in each replicate, and averaging this probability across all 1000 stochastic replicates.
2.4. Climate model projections
Climate model simulations were obtained from the fifth phase of the Climate Model Intercomparison Project (CMIP5). Simulations from 15 models in the CMIP5 archive (listed in table S1) over the period 1861–2005 under both natural and anthropogenic forcings (historical), 1861–2005 under natural forcings only (historicalNat), and 2006–2100 under four representative concentration pathway (RCP) scenarios (RCP2.6, RCP4.5, RCP6.0 and RCP8.5) were utilised. Modelled fields are re-gridded to a common 2° x 2° grid. We use a time-slice method (James et al 2017, King et al 2017) to select model-simulated years from the four RCP scenarios to represent the 'Natural', 'Current', '1.5 °C' and '2.0 °C' warmer worlds. The 'Natural' scenario is estimated using the 1901–2005 period from the ensemble of the historicalNat simulations. These are simulations in CMIP5 that include natural external climate forcings such as solar variability and volcanic emissions but exclude anthropogenic climate forcings. The 'Current' scenario is defined as the 2006–2026 period (that is, a 21 year window centred on 2016) in the high greenhouse gas emissions RCP8.5 scenario. We define our 1.5 °C world as all years within decades in the 2006–2100 experiments in which decadal-average global temperatures are between 1.3 °C–1.7 °C warmer than the mean global temperature in the equivalent model's historicalNat simulation for 1901–2005. The 2 °C world is defined similarly but using a decadal-averaged temperature of 1.8 °C–2.2 °C above the corresponding natural baseline. We use each CMIP5 model's mean change in precipitation (in %) and temperature (in °C) relative to its own baseline, implicitly bias-correcting the mean. For our case study we use two 2° × 2° grid cells over the study region.
3. Results
3.1. Concurrent warming and drying
Several highly populated regions of the world face the prospect of concurrent precipitation decrease and rising temperatures under global warming (figure 1(a)). Observations and model projections indicate the American Southwest is shifting towards increasing aridity (Seager et al 2007, Cook et al 2015) (figure 1(b)). Although some of the temperature increase during meteorological drought is the result of land-surface feedbacks from reduced evaporative cooling and increased incoming solar radiation from reduced cloud cover (Wolf et al 2017), anthropogenic warming is increasing the probability of concurrently warm and dry conditions resembling those during the severe 2012–2014 drought in California (Diffenbaugh et al 2015). A broad and consistent drying signal is projected in the Mediterranean (figure 1(c)), with drought amplification projected under increasing levels of global warming (Marx et al 2017, Samaniego et al 2018). Southern Australia (figure 1(d)) is a region experiencing strong influences from both climate change and interannual to decadal variability (Cai et al 2014). South-western Australia has experienced severe declines in rainfall and runoff since the 1970s, driven by anthropogenic emissions of greenhouse gases (Delworth and Zeng 2014), stratospheric ozone depletion (Delworth and Zeng 2014) and regional land-use change (Pitman et al 2004).
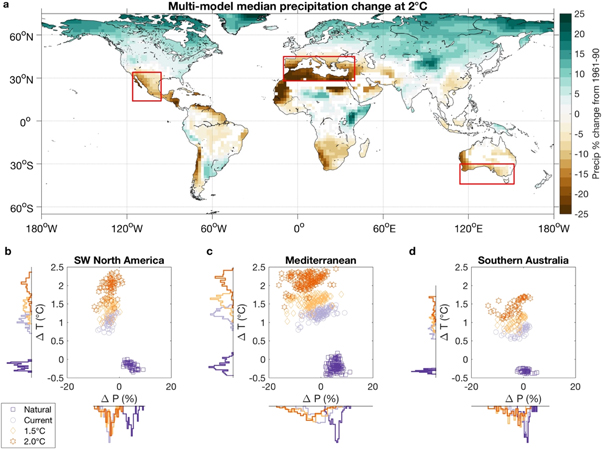
Figure 1. Global and regional hydroclimate changes in climate models. (a) Multi-model median precipitation change from 1961–1990 at 2 °C of global warming; location of three regions of interest highlighted in red boxes; grid cells shown only where two-thirds of models agree on the sign of the change. (b)–(d) Multi-model medians and normalised marginal probability distributions of annual mean precipitation and temperature change from 1961–1990 for all grid cells in the three regions in Natural, Current, 1.5 °C and 2.0 °C warmer worlds.
Download figure:
Standard image High-resolution imageHere we compare mean precipitation and temperature shifts in the American Southwest, the Mediterranean and Southern Australia for four global warming scenarios: a pre-industrial 'natural' world, the 'current' world, and two future worlds where global mean surface temperature is 1.5 and 2.0 °C above natural baseline temperatures (King et al 2017). We utilise a suite of model experiments from the fifth phase of the Coupled Model Intercomparison project (CMIP5) (Taylor et al 2012b) to obtain large ensembles of simulated climate at these levels of global warming (King et al 2017, Methods). In the three regions, models generally project concurrent warming and drying. Mean temperature change (ΔT) follows the general trajectory of global temperature, with higher rates of projected regional warming in the Mediterranean and in the American Southwest than in southern Australia (King et al 2017) (figures 1(b)–(d)). At 1.5 °C of warming all three regions are projected to experience precipitation reductions relative to 1961–1990 (figures 1(b)–(d)). In the Mediterranean the mean precipitation change at 1.5 °C is –5.3%, with 90% confidence intervals of [–12.4%, +0.8%]. For Southern Australia the projection is for a change of –2.6% [–9.6%, +2.4%], and for the American Southwest it is –2.2% [–6.4%, +1.5%].
3.2. Recent long and severe drought in Australia
Australia felt the consequences of extremely dry and warm conditions during the Millennium Drought from 1997–2009 (figures 2(d)–(g)). The drought led to the commissioning of several large water supply augmentation projects, including for Melbourne. The drought was associated with substantial agricultural losses and environmental degradation (van Dijk et al 2013). The drought was unprecedented in instrumental records in southeastern Australia, and it is plausible that climate change had an influence (van Dijk et al 2013, Cai et al 2014, Hope et al 2017). For the city of Melbourne's major surface water supply catchments (Rhodes et al 2012), the Millennium Drought brought declines in reservoir inflow in all months (figures 2(a) and (b)), with the highest volume reductions in winter and spring. Monthly inflow was between 22%–55% below average (figure 2(c)). The highest proportional runoff reductions occurred during autumn. For temperature, the positive anomalies were strongest in summer. At a given monthly rainfall total, higher mean monthly temperatures are coincident with reductions in catchment runoff. This relationship is strongest from Sep–May.

Figure 2. Observed hydroclimate changes in Melbourne's catchments and southeastern Australia. (a) Monthly climatologies of catchment mean precipitation (P), total monthly inflow into Melbourne's major water harvesting reservoirs (Q) and catchment mean temperature (T). (b) Anomalies during the Millennium Drought for P, Q and T. (c) Percent anomalies during the Millennium Drought for P and Q. (d)–(g), Precipitation (d), (f) and temperature anomalies (e, g) (from 1961–1990) during the Millennium Drought in southeastern Australia. Precipitation (%) and temperature (°C) for cool (d), (e) and warm (f), (g) seasons.
Download figure:
Standard image High-resolution imageThe city of Melbourne demonstrated a capability to adapt to water shortages during the Millennium Drought (Rhodes et al 2012). However, the possibility of droughts more intense than previously experienced (Tan and Rhodes 2013), higher temperatures (DELWP 2016a), uncertainty in catchment responses (Saft et al 2016, Tan and Neal 2018) and demand growth (Melbourne Water 2017) are all major reasons for concern. Future augmentation of the desalination plant may mitigate these concerns but may come at a substantial cost to the community and the environment. Note that the State Government has offset the current operational power of the desalination plant with renewable energy certificates (DELWP 2019). The Millennium Drought left water managers in southern Australia confronted with a pressing need to better understand the future likelihood of severe and protracted droughts.
In this study we evaluate future risks to water supply infrastructure at particular levels of global warming both with, and without, the addition of water supply from a desalination plant. We use climate models and hydrological modelling to infer future drought risks at key levels of global warming. To demonstrate the method, we focus on the broad characteristics of Melbourne's major surface water supply. The population of greater Melbourne is projected to grow from 4.5 million in 2015 to around 8.0 million in 2051 (DELWP 2016b). With rapid population growth, projected warming and drying, and long instrumental observations (>100 years), the city's water supply system is an ideal case study. The recently observed severe drought and the possible influence of climate change provide additional impetus to understand the combined impacts of future changes on risks to water supply at the catchment scale at natural, current and policy-relevant future levels of global warming.
3.3. Risks to water supply at 1.5 °C and 2.0 °C global warming
Here we assess the probability of severe water supply shortage for a range of shifts in mean precipitation and temperature. Using hydrological modelling we simulate total inflows into a water supply reservoir system and subsequent storage levels using stochastic precipitation and temperature at a monthly time step and conceptual rainfall-runoff modelling (Methods). The PERM rainfall-runoff model (Peel et al 2015) represents interception by vegetation, soil moisture storage and evapotranspiration that is limited by either soil moisture or energy. Our simulations use a simplified representation of the major water supply catchments and reservoir system for Melbourne, both with and without a climate independent water source—a desalination plant capable of supplying up to 150 GL of water per annum. The models capture the key statistical properties of the climate variables. In capturing the interannual persistence, annual probability distributions and the covariance between T and P (see figures S3–7) the models simulate realistic hot-dry sequences. We incorporate plausible water restrictions policies and savings that are consistent with projected drought response actions (Methods).
Mean precipitation reduction is the primary driver of increasing water shortage probability (contoured surfaces in figure 3), producing a rapid escalation of the probability that storage levels are below 10%, a level considered here to indicate severe supply shortages. Water supply shortage risk increases as a function of both precipitation decline and temperature increase. Relatively small changes in both of these variables are capable of substantially increasing the risk. Accounting for the negative correlation between catchment temperature and precipitation, higher mean temperatures can exacerbate risk by increasing the moisture demand from the atmosphere, increasing evapotranspiration from the catchment and consequently reducing the inflow into the reservoir system. For example, with a mean catchment warming of +2 °C relative to 1961–90 and a precipitation change of –5%, the water supply shortage risk intensifies to over 30% in the absence of the desalination source (figure 3(a)). The addition of a major desalination source (figure 3(b)) substantially reduces the risk.

Figure 3. Severe water supply shortage risk at projected mean shifts in temperature and precipitation at different levels of global warming (a) without desalination and (b) with desalination. Background shading shows the probability that the reservoir is at a storage level below 10% for scenarios of shifts in temperature and precipitation for a demand scenario in which demand is 0.85 of annual average inflow. Markers show individual CMIP5 model projections of mean precipitation and temperature shifts under different warming levels for the Natural, Current, and 1.5 °C and 2.0 °C warmer worlds for the southeastern Australia case study of Melbourne.
Download figure:
Standard image High-resolution imageClimate model projections of mean precipitation and temperature change (ΔP and ΔT) over the Melbourne water supply catchment region are now superimposed onto the risk surface (markers on figure 3) for each of the four warming levels: Natural, Current, 1.5 °C and 2.0 °C of global warming. The CMIP5 model projections indicate that regional warming will occur alongside global warming. There is high variability among the climate models. However, the models on average project a reduction in precipitation at both the 1.5 °C and 2 °C levels of global warming for the case study region. The mean precipitation shift over the catchments is –2.0%, with 90th percentile limits of [–11.0%, +5.1%] relative to 1961–90 at the 1.5 °C warming level. At 2 °C global warming the shifts are –3.3% [−14.7%, +3.3%]. The point on these risk surfaces directly below each marker can then be used to infer the corresponding risk. As the world warms, many regions will experience increasing water demand due to population growth. Melbourne's population is expected to nearly double over the coming three decades. We therefore compare the water supply shortage risk for five possible water demand scenarios under the four global warming levels, both without (figure 4(a)) and with desalination (figure 4(b)). As future demand on the reservoir system increases from 0.7 to 0.9 of the observed annual average inflow, the severe water supply shortage risk at 2 °C of global warming increases rapidly in the absence of desalination. At an annual demand of 0.75 of the mean inflow, the ΔP and ΔT climate model projections for the Melbourne region infer a median water supply shortage risk of only 0.6%, with 90th percentile limits of [0.1%, 4.3%] at 1.5 °C of warming. This increases to 2.9% [0.1%, 12.1%] at 2.0 °C of warming in the absence of system augmentation. At the higher demand level of 0.85 of the mean annual inflow, the median water supply shortage risk is 9.6% [3.8%, 24.4%] at 1.5 °C, increasing substantially to 20.4% [3.9%, 39.5%] at 2 °C of global warming. With desalination, the risks are substantially ameliorated (figure 4(b), note y-axis limit change). At the highest demand level however, the median risk increases rapidly with the degree of warming.

Figure 4. Severe water supply shortage risks for increasing water demand under different global warming levels (a) without desalination and (b) with desalination. Note the difference in y-axis limits. Box plots show the distributions of the median water supply shortage risk corresponding to CMIP5 model projections of mean precipitation and temperature change in the four different worlds for the southeastern Australia case study of Melbourne for a range of demand scenarios of D/Q, where D is the annual water demand and Q is the annual average inflow.
Download figure:
Standard image High-resolution image
4. Discussion and conclusions
Catchments will respond differently to severe dry episodes (Saft et al 2016, Tan and Neal 2018). The time-evolving influence of weather and climate on the land surface and the surface-groundwater link are often poorly constrained due to limited observations. Some studies highlight that plant physiological response to rising atmospheric CO2 can include increased water use efficiency by plants through a reduction of stomatal conductance and therefore reduced PDSI-based drought risk (Swann et al 2016). Other studies claim the effect is negligible relative to the impact of greenhouse gas-induced warming (Dai et al 2018). These complexities require detailed evaluation in future work. However, water managers will likely be faced with severe droughts before well-constrained, region-specific plant and catchment response models become available. This necessitates analyses such as this study. Whilst the precise spatio-temporal patterns of future rainfall also lie beyond the reach of current modelling capability, projections of change in mean temperature and precipitation are better constrained. It may therefore be that despite many uncertainties in catchment responses, projected concurrent drying and warming shifts are enough to justify increased water security measures. This may be particularly true for systems where reservoir storage depletion during severe drought is quicker than the implementation of supply augmentation (Berghout 2009). Hydrological approaches with detailed rainfall-runoff catchment modelling, local knowledge and practical metrics of water resource system risk can be a key assessment tool for water planners.
Water supply shortages to major populations can have catastrophic impacts on the economy and society. In this study we provide a methodology for incorporating the strengths of climate modelling and hydrological simulations to infer water supply risks. Using Melbourne, Australia as a case study, we examine the risk of severe water supply shortages at the 1.5 °C and 2 °C global warming levels proposed in the Paris Agreement. We show that if global greenhouse mitigation efforts are boosted to align with the 1.5 °C global warming level, the risk of severe water supply shortage can reduce considerably. Desalination provides a substantial buffer to these risks, but demand growth may outstrip this buffer, resulting in non-zero risks of severe water shortage in a warmer climate. Demand itself may also be exacerbated at higher levels of global warming (City West Water et al 2017, Melbourne Water 2017, Flower and Rhodes 2018). Regardless of the success or failure of international climate negotiations, societies located in climate zones prone to concurrently warmer and drier conditions would be wise to remain vigilant in fortifying their water resource defences against reductions in precipitation and the exacerbating influences of ongoing warming of the land surface.
Acknowledgments
The authors wish to thank Melbourne Water for their provision of data and assistance with this study. BJH, MP and RN received funding from an Australian Research Council Linkage Project (LP150100062), which was co-funded by Melbourne Water and the Victorian Department of Environment, Land, Water and Planning, and supported by the Australian Bureau of Meteorology. BJH and ADK are Associate Investigators of the Australian Research Council's Centre of Excellence for Climate Extremes (CLEX, CE170100023). MP received funding from an Australian Research Council Future Fellowship (FT120100130). AMU received funding from CLEX. ADK received funding from an ARC DECRA (DE180100638). DJK is supported by the Earth Systems and Climate Change Hub, which is funded by the Australian government's National Environmental Science Program. We acknowledge the support of the NCI facility in Australia. We acknowledge the World Climate Research Programme's Working Group on Coupled Modelling, which is responsible for CMIP, and we thank the climate modelling groups for producing and making available their model output. For CMIP, the US Department of Energy's Program for Climate Model Diagnosis and Intercomparison provides coordinating support and led development of software infrastructure in partnership with the Global Organization for Earth System Science Portals. We thank the Australian Bureau of Meteorology, the Bureau of Rural Sciences and CSIRO for providing the Australian Water Availability Project data.