

Abstract
Growing household energy demand, particularly in developing countries starting from a low base of consumption, is an important driver of current and future greenhouse gas emissions. Yet, our understanding of transitioning residential energy demand in developing country contexts is limited. This paper discusses changing energy service demands in urban low-income households in India, an emerging economy where the largest future growth in energy demand globally is projected to occur, and where 12 million new low-income homes for the urban poor are to be built by the government between 2015 and 2022. Based on mixed quantitative and qualitative methods comprising of surveys, interviews and focus group discussions, we analyze two inter-related questions: how does the demand for energy services change as the ability of low-income households to consume increases; and how do energy related behaviors influence household electricity consumption? We analyze the data collected to rank households according to their ability to consume and to identify the types of, and progression in, energy services acquired. The appliances and associated services pursued are lights, fans, televisions, and refrigerators, with varied energy efficiencies. Analogously, we quantify the influence of behavior in determining electricity consumption, and show that the inclusion of socio-demographic and behavioral factors explain a significant proportion (51%) of the variance in household electricity consumption, along with the role of material factors such as building physical characteristics and appliance stocks. We complement the statistical analysis with qualitative fieldwork and discuss changing energy related behaviors as the ability of households to consume increases. We conclude with recommendations for climate actions that are compatible with development in the growing low-income housing stock.
Export citation and abstract BibTeX RIS

Original content from this work may be used under the terms of the Creative Commons Attribution 3.0 licence. Any further distribution of this work must maintain attribution to the author(s) and the title of the work, journal citation and DOI.
1. Introduction
As economies develop, households gain the ability to consume more energy services, and in turn reconfigure national energy demand patterns (Reddy 1991, Wolfram et al 2012, Royston et al 2018). Domestic energy use already accounts for a quarter of global final energy demand and a significant portion of greenhouse gas (GHG) emissions (Johansson et al 2012, Abrahamse and Shwom 2018). Most of the growth in future household energy demand is projected to be in urban areas in developing countries, with large implications for climate change (Bai et al 2018). At the same time, transitions in household energy demand can also be opportunities to lock-in low carbon consumption patterns (Creutzig et al 2016, Creutzig 2018, Seto et al 2016). However, our understanding of changing energy use patterns and the feasibility of achieving low-carbon residential demand in developing country contexts is partial because of the lack of data on energy use and related behaviors (Bai et al 2018, Nagendra et al 2018, Steg 2018).
More recently, a number of studies are focusing on energy demand, services and climate mitigation from developing countries (Sathaye and Meyers 1985, Pachauri et al 2004, Ürge-Vorsatz and Novikova 2006, Ürge-Vorsatz and Novikova 2008, Cabeza et al 2014, Zheng et al 2014, Ahmad et al 2015, Schaffrin and Reibling 2015, Rao and Ummel 2017, Yu et al 2018), and on urban transitions and climate mitigation (Bulkeley 2013, Evans et al 2016, Raven et al 2017, Luque-Ayala et al 2018, Peng and Bai 2018, Khosla and Bhardwaj 2019). The literature on the role of energy related practices (Shove and Warde 2002, Shove and Pantzar 2005, Stephenson et al 2010, Spaargaren 2011, Lutzenhiser 2014, Hess et al 2018) and behaviors in reducing residential demand (Langevin et al 2013, Frederiks et al 2015, Hong et al 2016, Huebner et al 2016, Delzendeh et al 2017, D'Oca et al 2018, Ding et al 2018, Zhang et al 2018) is also growing. Studies estimate the energy savings potential of occupant behavior at 10%–25% for residential buildings (Dietz et al 2011, Zhang et al 2018), with behavior or lifestyle factors explaining 37% variance in electricity consumption in the United Kingdom (Gill et al 2010), and 42% variance in the United States (Sanquist et al 2012). However, there is a high variation between case studies (Ürge-Vorsatz et al 2009, Lopes et al 2012). More so, the integration of technical, economic, and sociocultural factors in the research on residential energy consumption and climate change remains limited (Wijaya and Tezuka 2013, Lutzenhiser 2014, Sovacool 2014, Schmidt and Weigt 2015, Sovacool et al 2015, Stern et al 2016, Hu et al 2017, Abrahamse and Shwom 2018, Khalid and Sunikka-Blank 2018, Romero-Lankao et al 2018, Sunikka-Blank et al 2019). The gap is particularly true for the research on developing countries and for scales larger than individual buildings (Zhang et al 2018), where the rapidly transforming built environment will have significant long-term impacts on infrastructure, energy, and GHG emissions (Bredenoord et al 2014, Charoenkit and Kumar 2014, Seto et al 2016).
This paper examines changing energy service demands in households in India, a country where the largest global growth in energy demand is projected to occur (IEA 2015, 2018). It focuses on urban low-income housing, given the Indian government target of constructing 12 million urban homes for the urban poor and first-time home owners from 2015 to 2022 under its 'Affordable Housing for All' program (MoHUPA 2016). Other studies that are beginning to examine the low-income housing stock are of Mexico (Hernandez-Roman et al 2017, Saldaña-Márquez et al 2018), Malaysia (Zaid and Graham 2011, 2017), South Africa (Winkler et al 2002), China (Gan et al 2017), and India (Mastrucci and Rao 2018, Sengupta et al 2018). The existing literature on residential energy consumption in India, however, focuses on technological and engineering approaches and rarely considers how households use technologies (with the exception of Jain et al 2014, Rathi and Chunekar 2015, Malodia and Bhatt 2019). Energy consumption is mostly predicted on the basis of expenditure, income levels and appliance stocks (Filippini and Pachauri 2004, Pachauri 2004, Rogers and Suphachasalai 2008, de la Rue du Can et al 2009, Ekholm et al 2010, van Ruijven et al 2011, O'Neill et al 2012, Bhattacharyya 2014, Chaturvedi et al 2014, Bhattacharyya 2015, Ahmad and de Oliveira 2015, Parikh and Parikh 2016), with large variations in the results (Chunekar 2019). With this backdrop, we use mixed quantitative and qualitative methods to answer two inter-related questions: how does the demand for energy services change as the ability of low-income households to consume increases; and how do energy related behaviors influence household electricity consumption? Based on the findings, the paper suggests climate actions for the growing low-income housing stock in India, with potential implications for other developing economies. This study provides among the first sets of analyses on energy demand in India's low-income housing transitions, and is particularly relevant as there is no publicly available household energy data available for the country's lower income groups (Sreenivas and Iyer 2015, Rai et al 2017).
2. Methods
This study is based on empirical surveys, interviews and focus group discussions of low-income households in India. As India has no countrywide residential energy survey, we undertake a detailed household survey to determine energy use patterns. The survey aims to capture a breadth of social and technical factors that influence household energy consumption, and was designed based on extensive reviews of survey instruments in the literature and with peer review input. The questionnaire was organized around seven categories to capture the spectrum of energy use assets, demographic and socioeconomic characteristics, and the socio-cultural factors underlying energy use behaviors of households. The questionnaire categories were: physical household and building characteristics; household socio-demographics; electricity bills; ownership of thirty observable household appliances; energy use behavior; and awareness and perception of energy conservation (see supplementary information (SI) Annex A is available online at stacks.iop.org/ERL/14/095008/mmedia for the full questionnaire and Annex B for a description of the survey design and implementation).
Data was collected for approximately 700 government-built low-income households surveyed over two seasons each (winter in January and summer in July 2017). The sites were located in the city of Rajkot, India, chosen for its track record of delivering housing at scale and speed, and with similar physical building specifications as other government low-income housing from across the country. The location was also selected for its hot and dry climate, and reliable electricity access that allowed an examination of consumption patterns not skewed by disruptions of supply. We employed a random sampling strategy to generate a representative sample of households at the sites under study—which the local municipal government classified into three categories (broadly from poorest to richest): Basic Services for Urban Poor; Economically Weaker Sections; and Low Income Groups. See SI Annex C for description of the sample characteristics, data summary and sampling method.
Using the surveyed data, we use an item response model to construct an index that ranks households according to their assets (i.e. a range of household appliances and vehicles owned), or an 'asset index'. The asset index serves as a proxy for the households' ability to consume based on their ownership of a basket of appliances instead of self-reported measures of income and consumption (detailed method in SI Annex D). This is important in urbanizing and developing country contexts where income measures are known to be incorrect given volatile household income and expenditure flows (Deaton 2003). Based on this approach, households with a higher rank on the asset index have a higher economic well-being.
Next, we calculate the expected number of appliances owned for households using locally estimated scatterplot smoothing (LOESS), a standard procedure to flexibly estimate expected values without strong assumptions (see SI Annex D). The change in the expected number and types of appliances owned as the households rank higher on the asset index shows the progression in appliance ownership as households' ability to consume and economic well-being increases. Because the actual index value has no intrinsic meaning, we report our results in terms of the percentile rank of the household on the asset index. We label this progression in appliance ownership as an 'energy services ladder.'
Analogously, we use the data on energy-related behaviors obtained from the survey to test if their influence is statistically significant in predicting the household electricity consumed (in kWh) obtained from the utility. This is done by employing a Least Absolute Shrinkage and Selection Operator (LASSO) model to measure the relative importance of each of the different material (building and appliance) factors, socio-demographic, and behavioral factors obtained from the survey. The LASSO model, discussed in detail in the SI Annex D, is chosen as other standard regression approaches with such a large number of plausible explanatory factors tend to 'overfit' the data, generating poor predictive performance on outcomes of interest. The LASSO model rectifies these issues by 'shrinking' the scale of prediction of the least important factors, generating stable, high quality predictions (Tibshirani 1996). It is thus a good choice for modeling the explanatory power of the various factors on electricity consumption.
To demonstrate the role of behavioral factors, we run LASSO regressions predicting the natural logarithm of electricity consumption (kWh) using only material variables (26 variables); material and socio-demographic variables (75 variables); and material, socio-demographic, and behavioral variables (134 variables)—and measure the proportion of variance explained in the outcome. We use the natural logarithm of electricity consumption to do so because the unaltered distribution was noticeably exponential in nature. These regressions include 213 observations, the number of households for which we could get both survey and utility readings for both the winter and summer months.
While the quantitative analysis of the surveyed data demonstrates shifting appliance stocks and the influence of behavioral factors on electricity use, further research is needed to understand the socioeconomic and cultural rationales that underlie different household energy uses and behaviors (Lutzenhiser 1992, Shove and Pantzar 2005, Stephenson et al 2010, Zhang et al 2018). To examine these dimensions, we complement the quantitative analysis with in-depth interviews of household members and site-by-site focus group discussions aimed at understanding how residents purchase appliances and use energy, and the factors that influence their decision-making. More detail on the qualitative methods used are discussed in SI Annex B. Discussions were held in the evening to ensure participation by maximum number of residents, with some questions posed to certain gender and age groups to understand the influence of their socio-cultural characteristics on energy use. We also interviewed attendants of appliance retail shops near the housing sites to understand consumer preferences. The results are discussed in the next section.
3. Results and discussion
3.1. Climbing the energy services ladder with changing appliance ownership
In this section, we examine how appliance ownership changes with the increased ability of households to consume. The analysis helps develop a baseline of low-income housing electricity consumption and identify the types of energy services prioritized, to subsequently inform climate actions. Households surveyed had an average January electricity consumption of 62.25 kWh and an average July electricity consumption of 102.65 kWh, compared with the global household average of 279.41 kWh in 2014 (World Energy Council 2014). While this is relatively low, the implications for energy and climate change are important because of the scale of impending growth, and the subsequent numbers of new appliances that will be purchased. In India alone, an additional 400 million people are expected to live in urban centers in the next two decades with a large associated increase in energy demand (UN DESA 2014).
3.1.1. Results
Figure 1 shows the energy services ladder with the progression in expected appliance ownership as the households' ability to consume increases (as measured by the percentile rank on the asset index). As discussed in the Methods section, in order to calculate the expected number of appliances in a flexible manner, a LOESS curve was estimated as a function of the percentile rank on the asset index. Figure 1 displays these results, where the x-axis is the percentile rank on the asset index given to the household, while the y-axis measures the expected number of lighting bulbs (top panel) and appliances (bottom panel) owned by the household.
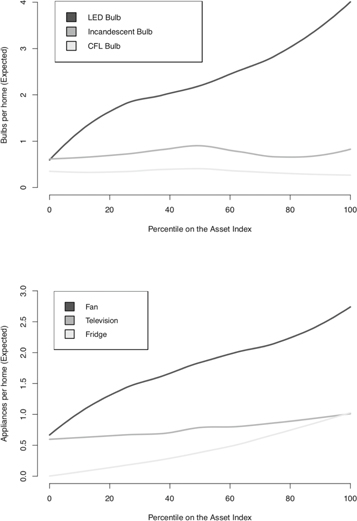
Figure 1. Energy services ladders for the sampled low-income housing. The ladders demonstrate changing appliance penetration as the ability of households to consume increases. The x-axis is the percentile on the asset index given to the household, while the y-axis measures the expected number of lighting bulbs (top panel) and appliances (bottom panel) owned by the household.
Download figure:
Standard image High-resolution image3.1.2. Discussion
A set of insights on appliance ownership patterns emerge from figure 1. First, from the thirty appliances surveyed for, most households have access to only the most basic technologies and services: lighting; fan-based cooling; entertainment from the television (TV); and refrigeration for food.
Second, for lighting, the most common use of electricity, there is a counterintuitively high penetration of conventionally expensive, energy-efficient light emitting diode (LED) bulbs. LEDs provide the largest reduction in electricity consumption without a reduction in brightness, but cost more than five times that of incandescent bulbs, which can deter the willingness of households to pay (Chunekar et al 2017). From the survey and interviews, we find that the remarkably high LED use is closely linked with the broader policy environment and a government scheme that promotes LED bulbs by marketing and selling them at a reduced price. During focus group discussions, many residents indicated awareness of the LED scheme via the TV, radio, or information provided at electricity bill payment centers where the bulbs could be easily purchased. Notably, the number of incandescent and tube lights remain constant, indicating an established practice of purchasing incandescent bulbs but with increased purchase of LEDs as households' assets increase.
Third, fans are the most owned appliance to address cooling needs in the hot climate. Fans are preferred to air conditioning units, which remain too expensive, and to air-coolers, which are water-intensive and not feasible in water-scarce regions. Air conditioners remain out of reach for the low-income population, in spite of the fast rising global air-conditioning demand, the largest of which is projected to be in India (IEA 2018). Fan ownership is followed closely by ownership of televisions. The probability of owning a TV is high even though households may not own many other assets. This result reinforces the findings from the existing literature that TV viewing has become the most important information and entertainment activity for aspiring middle and lower-income families across countries (Wilhite 2008, 2012).
Fourth, as the households rank higher on the asset index, many households purchase fridges, as indicated by the increased probability of fridge ownership at the highest percentiles of the asset index. The relatively similar price point of the refrigerator and the TV suggests there is less emphasis on services from a fridge, even in a hot climate.
Finally, while fans and TVs are by far the most ubiquitous appliances used within the low-income housing, the number that are energy-efficient (or 'star rated' according to the government standard) is minimal (figure 2). Energy efficient fridges are more prevalent, partly because of the mandatory efficiency standards for fridges whereas the standards are voluntary for ceiling fans and TVs (Bureau of Energy Efficiency 2016). Retailer interviews corroborated that while consumers are aware of energy savings from efficient fridges, they are less aware of efficient TVs and fans that are also less prevalent in the market. As increased housing provisions and incomes lead to more use of energy intensive appliances, there is enormous scope for the transition to be energy efficient and low-carbon (Abhyankar et al 2017).

Figure 2. Percentage of energy efficient appliances owned in the low-income housing sample.
Download figure:
Standard image High-resolution imageIt is worth noting that while these insights are drawn from the low-income housing surveyed, they represent the trends of a core set of appliances as households across India transition to higher levels of income (Desai et al 2008, Government of India 2011, Desai and Vanneman 2015). The implications of the large number of first-time appliance purchases is important, as once bought they persist in households for a decade or more (Seto et al 2016), and can often be passed on second-hand, as the discussions with the residents brought forth.
3.2. The influence of energy-related behaviors on electricity consumption
In this section, we build on the above discussion on appliance ownership and examine the role of energy related behaviors in determining household electricity consumption.
3.2.1. Results
We find from the survey and interviews that households have different experiences of indoor heat, use different strategies for cooling, and have different uses of energy, as see in figure 3. Household cooling strategies can be electricity consuming (e.g. turning on the fan) or can be non-electricity consuming (e.g. adjusting clothing, opening windows and doors, putting water-filled water clay pots on the floor). Alternatively, some households deliberately use their appliances less to reduce electricity consumption (e.g. all members occupy one room to use less fans), whereas others have higher bills because they use their appliances for commercial purposes (e.g. running a handicraft cottage industry from the home). In other cases, electricity use differs because of the age and employment of household members.
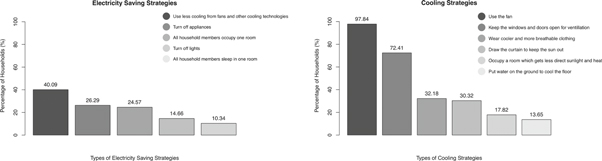
Figure 3. Different electricity saving and cooling strategies used in the low-income housing sample.
Download figure:
Standard image High-resolution imageWe test the influence of the different material (building and appliance characteristics), socio-demographic, and behavioral factors in predicting the electricity consumption of households. Data for the different variables was collected by the survey questionnaire and electricity consumption units (kWh) were obtained from the electric utility for the surveyed months. Table 1 lists the key material, socio-demographic and behavioral variables obtained from the household surveys. Since a total of 134 variables are used in the analysis, all of them are not listed in table 1. These are provided in a detailed list of variables and code in the electronic SI Annex E and F. Using a LASSO model, discussed in the Methods section and in the SI Annex D, we ran regressions predicting the natural logarithm of electricity consumption (kWh) over a two month period (over which the utility measures electricity consumption) to investigate the relative importance of each of these factors, by measuring the proportion of variance explained in the outcome. The results describe how much of the variance in the electricity consumed is explained when energy-related behavioral variables are included, in addition to the conventional material variables which are used to predict electricity consumption. This is an established way of determining of how much of the different patterns of electricity consumption can be explained by various household factors.
Table 1. Key Material, socio-demographic and behavioral variables obtained from the household energy survey.
| CATEGORY | KEY VARIABLES (HOUSEHOLD VARIABLES) |
|---|---|
| MATERIAL (BUILDING & APPLIANCES) |
|
|
|
|
|
|
|
|
|
| SOCIO-DEMOGRAPHIC |
|
|
|
|
|
|
|
|
|
|
|
|
|
|
|
|
|
| BEHAVIOR |
|
|
|
|
|
|
|
|
|
|
|
|
|
|
As seen in figure 4, when conventional building and appliance (or material) factors alone are considered, 23% of variance in the sample's electricity consumed is explained from the LASSO model. On including socio-demographic variables (see table 1), the variance in electricity consumption explained increases to 32%. On further including behavioral factors (see table 1), the variance explained increases to 51% in the LASSO model. The detailed model outputs are presented in SI Annex E.

Figure 4. Each of the panels displays the residuals (errors) from a LASSO regression model predicting the natural logarithm of electricity consumption (kWh) over a two month period (the period over which an electricity bill is generated) from percentile in household consumption (measured by the asset index). The left panel describes a model including only material variables, the middle panel describes a model that adds demographic variables to material variables, and the right panel describes a model that includes material, demographic and behavioral variables.
Download figure:
Standard image High-resolution image
3.2.2. Discussion
The above result shows that behavioral factors are highly significant in explaining energy consumption, and in doing so, it makes a robust case for taking seriously the social and behavioral drivers of energy demand, rather than focusing solely on physical building and appliance stock characteristics. This adds to the growing global literature on the importance of examining behaviors in energy demand and climate studies (Guo et al 2018).
Having statistically established the influence of behavior on electricity consumption, the qualitative interviews and focus groups provide further insight on changing household energy appliances and the corresponding changes in energy behaviors that are taking place. Two examples illustrate this. First, is the introduction of the refrigerator, and its implications for changing food consumption patterns. While the use of the fridge as a food preservation technology is well established in wealthy countries, this is less so in those that are making the transition towards urban and higher-income lives (Wilhite 2012, 2008). In the households examined, a significant number of families turn the fridge off for almost one-third of the day. This is because their food consumption practices favor fresh produce and there is little overnight food storage. Analogously, the fridge is barely used in winter months. At the same time, in a larger proportion of homes, who may have initially preferred low-food storage, the fridge is now used throughout the day—moving towards the trend of energy reliant food production and consumption. A larger literature corroborates the role of the refrigerator in changing diets and food habits, across countries, and its influence in emerging economies where household practices are changing rapidly (Hansen and Wethal 2015, Wilhite 2018).
Another example is in the changing cooling patterns as the ability of households to consume increases. In spite of the hot and dry climate, the cooling loads in the houses examined are relatively low. In focus group discussions, the prominent view was that individuals found ways to adapt to the heat in the absence of cooling technologies or reliable electricity access. In moving to new homes with reliable electricity access, cooling technology use was still limited. Instead, a culture was built around night-time socialization in common spaces around the housing, as the evening temperature dropped. At the same time, in wealthier homes, cooling patterns are shifting to regular use of fans, often with individuals occupying separately cooled rooms. As the numbers of urban low-income households rise and an increasing ability to consume lowers the burden of the electricity bill, cooling loads are likely to pick up pace quickly, with fans followed by air-coolers and air-conditioners. This integration of mechanical cooling into everyday practices is akin to the literature from developed countries (Shove et al 2014, Walker et al 2014).
In sum, low-income housing presents an important site where transitions in energy services, technologies and their use are occurring at scale. The households studied exhibit a range of energy related behaviors, with those on the lower end of the asset index focused on savings (e.g. by using the streetlight to light up their home and save on the electricity bill, or with all household members sharing a room so as to use only one fan at night). At the upper-end of the asset index, household behaviors are anchored around increased consumption of energy services (e.g. with declared aspirations to buy large TVs or complaints by households about the lack of a neighborhood mall). This transition in energy services demand is rooted in a better quality of life, which is central to an urban context starting from a low base of consumption. Yet, the scale of the transition poses complex challenges for global climate change, with trade-offs for GHG emissions. In the following concluding section, we discuss the policy implications of these findings to suggest climate actions for urban, low-income housing.
4. Policy implications and conclusions for climate mitigation in low-income urban housing
Energy services consumption is critical to development especially for countries starting with a low base of demand (Reddy 1991). While the projected growth of domestic energy demand can be at significant odds with achieving GHG reduction, transitions in energy use of urban households starting from a low base of consumption can also reconcile this tension by locking-in low-carbon energy appliance ownership and associated behaviors at an early stage of investment (Seto et al 2016). Identifying appropriate climate actions in developing country contexts, however, requires understanding changing household energy technologies and behaviors, which remain difficult to study because of their unconventional boundaries of analysis and limited available data.
Drawing on empirical insights from India, we demonstrate the shifting energy service demands and associated behaviors in low-income housing, a rapidly-growing built-form across Indian and other developing cities. Based on the results and discussion, we argue that the increasing provision of low-income housing is an avenue for both climate mitigation and development goals to be met. By identifying which energy services are pursued by households, and which corresponding set of appliances should be targeted, low-carbon measures such as adoption of energy efficient technologies can be locked-in (Winkler et al 2002, Zaid and Graham 2011, Cabeza et al 2014, Charoenkit and Kumar 2014, Gan et al 2017, Hernandez-Roman et al 2017, Zaid and Graham 2017, Saldaña-Márquez et al 2018). This could be especially effective if implemented alongside existing policies, such as schemes to deliver low-income housing. In the Indian case discussed in this paper, the primary energy services sought by hot-climate, urban, and low-income homes are lights, fan, TV, and fridge. These appliances have saturated homes in the developed world as integral elements of entertainment, food, cleanliness and comfort, and are rapidly making their way into households everywhere (Wilhite 2018). But as the Indian case with LED lighting shows, awareness and policies can help transitioning households make low-carbon investment decisions about their daily energy appliances. A simplified calculation for the Indian case alone, which assumes all newly purchased fans and lighting are energy-efficient across the 12 million low-income homes to be built by 2022, leads to approximately 1.6–5.1 TWh of projected annual savings4 .
In many cities energy efficiency and demand-based policies are already in play, but to implement them systematically across first-time home and appliance owners requires a coordinated institutional effort to influence consumers at the point of purchase, ratcheting up energy efficiency standards of appliances, and providing information about the benefits and lower-lifetime costs. If strategically targeted across the core set of energy service technologies which households purchase, irrespective of household income levels, climate zones, and individual preferences, the growth low-income housing offers an important site for climate mitigation. Additional empirical studies from developing country contexts which will add to these findings are necessary to better embed our understanding of climate actions and low-carbon pathways within ongoing urban low-income housing transitions.
Acknowledgments
We thank the Swiss Agency for Development and Cooperation, Oak Foundation, and John D and Catherine T MacArthur Foundation for their support. We also thank Rimjhim Saxena, Deepaboli Chatterjee and Babu Lal for their assistance with data analysis and visualization. The responsibility of all errors rests with authors. The authors declare no competing financial interests.
Data availability statement
The data that support the findings of this study are available from the corresponding author upon reasonable request.
Footnotes
- 4
Based on a calculation of energy savings for 12 million low-income units. A simplifying assumption is to use the mode household appliance composition determined by the surveyed data. This mode appliance composition, in an energy-efficient scenario, is: two LED bulbs, two energy-efficient fans and one efficient tube light per household. The range in energy saving projections represents the different scenarios of hours of appliance use, taken from the existing literature.