

Abstract
We investigate linear trends in Antarctic skin temperatures (temperatures from about the top millimeter of the surface) over the four seasons using ERA5 ensemble mean reanalysis data. During 1950–2020, statistically significant warming occurred over East and West Antarctica in spring, autumn and winter, and over the Antarctic Peninsula in autumn and winter. A surface energy budget analysis revealed that increases in downward longwave radiation related to increases in air temperature and total column integrated cloud had a key role in Antarctic surface warming. There were negative sea level pressure trends around the periphery of Antarctica throughout the year, and the associated circulation contributed to warm advection from the middle latitudes to West Antarctica and the Antarctic Peninsula. Over the interior of East Antarctica, increase in moisture advection from lower latitudes enhanced the low-level cloud cover. A two-dimensional parameter diagram showed that skin temperature trends for time segments longer than 30 years starting before 1960 exhibited statistically significant warming in autumn and winter in East and West Antarctica and the Antarctic Peninsula. In spring, West Antarctica also showed statistically significant warming for long segments. In summer, the Antarctic Peninsula had statistically significant warming trends for long segments and cooling trends for segments less than 30 years. For all the studied time intervals, when skin temperatures had statistically significant positive trends, increases in downward longwave radiation contributed more than 70% of the warming and vice versa. This result demonstrates that on all time and space scales, changes in downward longwave radiation associated with variations in air temperature and atmospheric moisture loading play a dominant role controlling skin temperatures.
Export citation and abstract BibTeX RIS

Original content from this work may be used under the terms of the Creative Commons Attribution 4.0 license. Any further distribution of this work must maintain attribution to the author(s) and the title of the work, journal citation and DOI.
1. Introduction
Antarctic climate change has attracted considerable attention since the 1958 International Geophysical Year, particularly with regard to temperature. Temperature changes in Antarctica influence ice sheet mass (Pritchard and Vaughan 2007, Pritchard et al 2009). Various studies have addressed surface air temperature variability over Antarctica using reanalyzed data (Steig et al 2009, O'Donnell et al 2010, Schneider et al 2011, Nicolas and Bromwich 2014, Huai et al 2019, Bozkurt et al 2020, Hillebrand et al 2020, Jun et al 2020, Kusahara 2020) and observational data (e.g. radiosondes: Screen and Simmonds 2012; operational weather station data: Li et al 2014, Marshall and Thompson 2016, Jones et al 2019; automatic weather station data: Bromwich et al 2012).
From 1950 until the early 2000s, there were positive trends in annual mean surface air temperature over the entire Antarctic continent with the highest warming rate over West Antarctica (Steig et al 2009). However, the distribution and magnitude of surface air temperature trends over periods >40 years are very sensitive to seasonality (O'Donnell et al 2010, Nicolas and Bromwich 2014, Jones et al 2019). Over the Antarctic Peninsula, the magnitude of surface air temperature warming from 1950s to 2000s or 2010s in autumn and winter is greater than in spring and summer. West Antarctica, excluding the Antarctic Peninsula, experiences its highest warming rate in spring. Conversely, over some parts of East Antarctica surface air temperatures exhibit a negative trend in autumn and winter.
Surface air temperature trends are also sensitive to chosen start and end years that make up a period of study (Steig et al 2009, O'Donnell et al 2010, Nicolas and Bromwich 2014, Gonzalez and Fortuny 2018, Jones et al 2019). In East Antarctica, long term warming trends have been observed to exceed 50 years in all seasons; however, shorter periods (<30 years) demonstrated negative trends in spring and summer (Nicolas and Bromwich 2014, Jones et al 2019). Over the Antarctic Peninsula, warming trends were observed for long periods in all seasons (Steig et al 2009, O'Donnell et al 2010, Nicolas and Bromwich 2014, Gonzalez and Fortuny 2018, Jones et al 2019). However, cooling surface air temperatures appeared for short segments, even in winter (Gonzalez and Fortuny 2018, Jones et al 2019). Turner et al (2016) highlighted the differences between two short periods (1979–1997 and 1999–2016).
Climate variations on local (e.g. sea ice, sea surface temperature (SST) and local atmospheric circulation) and regional (e.g. remote atmospheric responses to SSTs over middle and low latitudes) scales contribute to Antarctic temperature change (Turner et al 2013, Clem et al 2017). The increase in released heat from the ocean into the atmosphere due to a loss of sea ice causes warming over the Antarctic Peninsula in summer and winter. The climatological Amundsen Sea low (ASL) induces northerly warm advection over West Antarctica and the Antarctic Peninsula in all seasons (Simmonds and Murray 1999, Simmonds and Keay 2000, Simmonds et al 2002, Simmonds 2003, 2015, Simmonds and King 2004, Hosking et al 2013). The ASL, which is related to the number and intensity of low pressure systems, plays an important role in warming over the Antarctic Peninsula, particularly during winter, when cyclones are more numerous and stronger (Fogt et al 2012, Clem et al 2017). The strength of the ASL is influenced by the phase of the Southern Annular Mode (SAM), characterized by westerly circumpolar flow variability associated with the strong meridional pressure gradient between the high and middle latitudes of the Southern Hemisphere (SH; Thompson and Solomon 2002, Thompson et al 2011, Fogt et al 2012, Fogt and Marshall 2020). The circumpolar westerlies associated with a positive SAM phase promotes or reduces warm advection from the middle latitude, which leads to warming or cooling over the Antarctic Peninsula or East and West Antarctica, respectively. Therefore, there is a negative relationship between SAM phase and temperature over East and West Antarctica, and a positive relationship between Antarctic Peninsula temperatures and SAM phase (Nicolas and Bromwich 2014, Jones et al 2019).
Previous studies examined the relationship between atmospheric circulation over the SH and tropical oceanic variability, often termed tropical–polar teleconnections (Liu et al 2005, Ding et al 2011, 2012, Pezza et al 2012, Clem and Fogt 2013, 2015, Ding and Steig 2013, Li et al 2014, 2015, Ciasto et al 2015, Irving and Simmonds 2015, 2016, Nuncio and Yuan 2015, Clem et al 2016, 2017, 2018, Turner et al 2016, Screen et al 2018, Yiu and Maycock 2019). During a La Niña event, the atmospheric response to SST cooling over the central Pacific region strengthens the ASL, which increases warm advection over the Antarctic Peninsula in all seasons except for summer, whereas during an El Niño, the response to SST warming over the region weakens the ASL and reduces warm advection (Clem and Fogt 2013, 2015, Ciasto et al 2015, Clem et al 2018, Yiu and Maycock 2019). In addition, warming in the tropical Atlantic and Indian oceans induce deepening of the ASL in winter (Li et al 2014, 2015). Atmospheric circulation change related to anomalous tropical heating reduces warm advection over high latitudes in the Atlantic sector, which leads to cooling over East Antarctica in spring (Clem et al 2018). In addition, the Indian Ocean Dipole, which is associated with a longitudinal SST contrast across the Indian Ocean, has an effect on high-latitude SH climate (Liu et al 2005, Nuncio and Yuan 2015). When the Indian Ocean dipole is in a positive phase (a cold SST anomaly over the eastern Indian Ocean relative to the western Indian Ocean), the pressure anomaly is negative north of the Ross Sea and positive south of Australia, promoting sea ice formation west of the Ross Sea (Nuncio and Yuan 2015). Recent studies reported that there are also middle latitude and polar teleconnection patterns between the Tasman Sea and Antarctica (Liess et al 2014). Warm temperatures over the Tasman Sea lead to increased temperatures over the Antarctic Peninsula via the poleward shift of cyclone tracks over the Southern Ocean (Sato et al 2021).
Retamales-Muñoz et al (2019) assessed trends in Antarctic skin temperatures, which are from roughly the top millimeter of the land or sea surface, during 2000–2018 using satellite and reanalysis data. However, no study has analyzed these temperature trends over long periods. In this study, we investigated the linear trends (determined with the least-squares method) in skin temperatures and their causes over a range of time intervals using ERA5 data obtained from the European Centre for Medium-Range Weather Forecasts (ECMWF). We undertake a surface energy budget analysis to determine the role played by downward longwave radiation changes in influencing Antarctic surface temperature variability, and explore how moisture and heat is transported from the high southern latitudes to over the Antarctic continent.
2. Data and methods
2.1. Reanalysis and observation data
We used the ECMWF monthly mean ERA5 reanalysis data from 1950 to 2020 (from 1950/1951 to 2020/2021 for summer [December to February]) at a horizontal resolution of 0.5° (Hersbach et al 2020) (available from https://www.ecmwf.int). To investigate temperature variability and its causes, various atmospheric (e.g. sea level pressure (SLP), skin temperature, shortwave and longwave radiation, latent and sensible heat flux, amount of integrated water and ice cloud) and oceanic (e.g. sea ice concentration and SST) parameters were used. The ERA5 dataset comprises ten ensemble members. To evaluate the performance of air temperature in the ERA5, we used air temperature observation data at surface and pressure level (850, 700, 500, 300 hPa) in the Antarctic Climate Data, which are available from the SCAR READER project (Turner et al 2004) (available from https://legacy.bas.acuk/met/READER).
2.2. Surface budget analysis
To investigate the causes in Antarctica skin temperature changes, we conducted surface budget analyses, which have been used previously for understanding Arctic surface climate change (Lesins et al 2012, Lee et al 2017). With this approach, we revealed how the various components of the energy budget contribute to variations in skin temperature.
The surface energy budget can be written as:

where l and S are longwave and shortwave radiation, respectively, and u denotes upward and d downward, G is a storage term, Flh is the surface latent heat flux and Fsh is the surface sensible heat flux. The residual term R includes heat conduction from below the surface (e.g. heat conduction through snow and/or heat loss through the melting of snow). When the fluxes are directed toward the surface (i.e. toward the interface), they are defined as positive. After taking the differential of equation (1), the trend in the surface energy budget is:
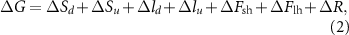
where the differential operator Δ represents the trend. In this study, we assumed an infinitesimally thin air surface interface with a very small heat capacity (Lesins et al 2012, Lee et al 2017), and hence the storage term G can be dropped.
The upward longwave flux is expressed as − σTs
4, where σ is the Stefan–Boltzmann constant, is the surface emissivity (herein set to 1) and Ts is the skin temperature. We may then write:
σTs
4, where σ is the Stefan–Boltzmann constant, is the surface emissivity (herein set to 1) and Ts is the skin temperature. We may then write:

Substituting this expression into equation (2) we derive:
Our equation (3) is identical to equation (3) in Lee et al (2017), except that we have included the trends of the upward and downward shortwave radiation because we examined all four seasons (they only studied the Arctic winter). The Ts in the denominator was the mean value of each season averaged over the study interval at each grid point. The parameter R is not provided in the ERA5 dataset. Therefore, the difference between ΔTs
and ((ΔSd + ΔSu + Δld + ΔFsh + ΔFlh)/4σTs
3) was used as the ΔR/(4σTs
3).
3. Results
3.1. Antarctic skin temperature rise and increased downward longwave radiation over 1950–2020
Figure 1(a) shows the time series of annual mean ERA5 skin temperature anomalies over Antarctica for each of the ten ensemble members and their mean. There was an overall warming trend over the entire continent from 1950 to 2020 in all members (0.30 ± 0.02 °C decade−1). Although the skin temperature exhibited ensemble spread in all years; the spread became small from 1979 because of an increase in assimilated satellite data sets. Conversely, before 1978, there was relatively large ensemble spread, particularly in the early 1950s, compared with 1979. To reduce the parameter uncertainty in the ERA5, we used ten ensemble mean data. We calculated the September–November (spring), December–February (summer), March–May (autumn) and June–August (winter) linear trends of each parameter in the energy budget. In addition, skin temperature data in another four reanalysis data sets (ERA20C (available from https://www.ecmwf.int): Poli et al 2016; ERA-Interim (available from https://www.ecmwf.int): Dee et al 2011; CFSR (available from https://cfs.ncep.noaa.gov/cfsr): Saha et al 2010, 2014; JRA55 (available from https://jra.kishou.go.jp): Kobayashi et al 2015) were used to compare the amplitudes and trends of surface skin temperature change among these data (figure S1 (available online at stacks.iop.org/ERL/16/064059/mmedia)). There are robust long term warming trends among three reanalyses (ERA5, ERA20C and JRA55), and all reanalyses have Antarctica warming with statistical significance above the 95% level.

Figure 1. (a) Time series of annual mean Antarctica ERA5 skin temperature (Ts) anomalies for mean (thick) and individual (thin) ensemble members from 1950 to 2020. (b) Distribution Ts linear trends from 1950 to 2020. The cross-hatched area indicates statistically significant (p < 0.05) trends.
Download figure:
Standard image High-resolution imageFigure 1(b) shows the geographical distribution of the linear trend of annual mean skin temperatures over Antarctica (1950–2020). A sizeable portion of the continent exhibited significant positive trends including the Antarctic Peninsula, the eastern part of West Antarctica, the Ross Sea, the coast around 0°E and the interior of East Antarctica. Previous studies reported differences in the distribution and magnitude of surface air temperature trends for each season (Steig et al 2009, O'Donnell et al 2010, Nicolas and Bromwich 2014, Jones et al 2019). Our linear trends of skin temperature for each season are shown in figures 2(a)–(d). Although significant trends in summer were limited to the coastal area around 0°E and the southern part of the Ross Sea (figure 2(b)), widespread warming trends were observed in the other three seasons (figures 2(a), (c) and (d)). The magnitude, areal extent and significance are most marked over West Antarctica in spring, the Antarctic Peninsula in autumn and East Antarctica in winter.

Figure 2. Skin temperature (Ts) linear trends (°C decade−1) in 1950–2020 (a) September–November (spring), (b) December–February (summer), (c) March–May (autumn) and (d) June–August (winter). Seasonal (month) ranges in (e)–(h) and (i)–(l) are the same as in (a)–(d) but depict data for downward longwave radiation (ld) and turbulent heat flux (HF; Flh+ Fsh), respectively, divided by 4σTs
3 (°C decade−1). The cross-hatched areas indicate statistically significant (p < 0.05) trends.
Download figure:
Standard image High-resolution imageTo explore the cause of Antarctica skin temperature change, we calculated linear trends of terms (i.e. ld/4σTs
3, (Fsh + Flh)/4σTs
3, (Su + Sd)/4σTs
3 and R/4σTs
3) in equation (3) for the four seasons during 1950–2020 (figures 2(e)–(l) and S2(a)–(h)). The distribution and magnitude of linear trends of ld/4σTs
3 were very similar to skin temperature over most of Antarctica, except in summer and high elevations around 0°E (figures 2(a)–(h)). Although there was a widespread positive trend in (Fsh + Flh)/4σTs
3 over the interior of East Antarctica in summer, they were very weak in general (figure 2(j)). Very few trends in the other three seasons were significant (figures 2(i), (k) and (l)). The linear trends of (Su + Sd)/4σTs
3 were very small in all seasons because of the high albedo of the snow/ice cover over Antarctica (figures S2(a)–(d)). During spring and summer, the ozone hole reduces absorption of shortwave radiation in the ozone layer, influencing surface climate thorough changes in atmospheric circulation and increased downward shortwave radiation at the surface (Thompson and Solomon 2002, Thompson et al
2011). However, increases in surface downward shortwave radiation have a minor direct impact on surface warming (Chiodo et al
2017). The linear trends of R/4σTs
3 were a little stronger but were still very modest (figures S2(e)–(h)). There were positive values in coastal areas around 0°E and the southern part of the Ross Sea; however, statistically significant change was limited to the southern Ross Sea in spring. Interpreting these results, we found that ld/4σTs
3 is the most important term in equation (3), which indicates that the increase in downward longwave radiation has a major impact on Antarctic skin temperature warming. Similar behavior of longwave radiation on surface budget is shown by Kumar et al (2021).
3.2. Causes of Antarctic surface climate change
The downward longwave radiation is strongly influenced by change in atmospheric temperature and cloud properties. To understand the causes of changes in downward longwave radiation over our 71 year study period, we analyzed linear trends of air temperature at 2 m (T2m) and vertical integral of water vapor flux for each season from 1950 to 2020 (figures 3(a)–(d)). Over West Antarctica and the Antarctic coastal regions, the trends in T2m were very similar to skin temperature in all seasons, meaning that surface air temperature warming has key role in skin temperature warming. Increases in air temperature are induced by enhanced warm advection from the middle latitudes (Simmonds and Murray 1999, Simmonds and Keay 2000, Simmonds et al 2002, Simmonds 2003, 2015, Simmonds and King 2004, Hosking et al 2013, Clem et al 2017), in agreement with poleward advection increase from midlatitude (figures 3(a)–(d)).

Figure 3. The linear trends of air temperature at 2 m (T2m: °C) and vertical integral of water vapor flux (VWF) (vector: kg m−1 s−1 decade−1) for (a) spring, (b) summer, (c) autumn and (d) winter. The seasons in (e)–(h) are the same as (a)–(d) but show data for sea ice cover (IC) and SLP (hPa decade−1). The cross-hatching shows areas with statistically significant (>95% confidence level) data for T2m (a)–(d) and IC (e)–(h).
Download figure:
Standard image High-resolution imageTo illustrate the impact of local and large-scale changes on Antarctic climate, the linear trends of SLP and sea ice cover for each season are shown in figures 3(e)–(h). Although there were negative SLP trends around Antarctica in all seasons, the SLP pattern strongly resembled the positive SAM phase in summer, which is consistent with Jones et al (2019). Rudeva and Simmonds (2015) and Grieger et al (2018) also highlighted the tight connections between SAM, cyclones, and southward moisture transport. In autumn, negative SLP pattern is similar to negative phase of the Pacific–South American, which induces an east-west seesaw pattern of warm and cold advection over West Antarctica (Marshall and Thompson 2016). The circumpolar westerlies associated with these negative SLP patterns causes warm advection from the South Pacific to the high latitudes, which leads to air temperature warming in all seasons over the Antarctic Peninsula and West Antarctica (figure 3). In addition, sea ice concentrations decreased to the west of the Antarctic Peninsula in all seasons (figures 3(e)–(h)), which would lead to increasing evaporation and heat from the affected ocean (Turner et al 2013) and result in enhanced air temperature and water vapor. Over the southern Weddell Sea, the northerly warm and moist advection associated with negative SLP over the Atlantic sector high latitudes induced the increase in air temperature in spring and summer (figures 3(a), (b), (e) and (f)). Further to the west, deepening of the ASL drives northward cold and dry advection from Antarctica over the Ross Sea in summer and autumn (figures 3(b), (c), (f) and (g)). In addition, over the most of East Antarctica coastal region, the northerly warm and moist advection from Southern Ocean causes air temperature increases (figure 3). Therefore, increases in warm and moist advection from the middle latitudes have a direct effect on air temperature warming and an indirect effect on skin temperature increases in these regions (figures 2(a)–(d) and 3(a)–(d)).
Conversely, over the interior of East Antarctica, the magnitude of air temperature warming was smaller than skin temperature because of relatively weaker warm advection from lower latitudes (figures 2(a)–(d) and 3(a)–(d)). Over the high latitudes, long and shortwave radiation at the surface are strongly influenced by clouds. In fact, the magnitudes of linear trends of downward longwave radiation for clear sky (ld_sky)/4σTs
3 without cloud forcing are smaller than those of ld/4σTs
3 for all seasons (figures 2(e)–(h) and S3(a)–(d)), meaning that change in cloud has also impact on downward longwave radiation change, in particular over the interior of East Antarctica. For that higher-elevation region, trends of middle level clouds between 800 and 450 hPa (MCC) are shown for each season from 1950 to 2020 (figures S3(e)–(h)). In all seasons, MCC showed statistically significant positive trends over the interior of East Antarctica, where there are relatively large differences in temperature between air and ground (figures 2(a)–(d), 3(a)–(d) and S3(e)–(h)). These results indicate that enhanced cloud cover increases downward longwave radiation and subsequent skin temperature increases in all seasons except summer over the interior of East Antarctica. Over this region, the weak wind and strong temperature inversion in winter reduces heat exchange between air and snow and influences the temperature difference between the air and surface (Heinemann et al
2019). Although warm and moist advection from lower latitudes is weak, there were significant increases in total column clouds water and moisture advection (figures 3(a)–(d) and S3(i)–(l)). However, cold conditions over interior East Antarctica is very conducive to the formation of clouds, in spite of relatively little moisture advection. Therefore, increase in moisture advection from lower latitude over East Antarctica interior would contribute to increasing clouds in low level.
3.3. Trends in three key Antarctic regions over various time intervals
Our analysis shows the dominant role played by downward longwave radiation in determining the overall trend in Antarctic skin temperature over our 71 year study interval. However, it is unclear whether this finding would hold true if only various intervals within the 71 year study period (hereafter segments) were considered, which would establish a physical connection between these two parameters. The structure of figure 1 suggests that any calculated trend is strongly dependent on the chosen start and end years, echoing similar comments by Nicolas and Bromwich (2014) and Gonzalez and Fortuny (2018). To investigate this, we used two-dimensional linear change diagrams to display temperature trends on a continuum (in steps of one year) of initial and end years. We constructed these diagrams for three key regions, West Antarctica, East Antarctica, and the Antarctic Peninsula (figure S4) as our analyses pointed to distinct behaviors of these subdomains.
Figure 4 shows the two-dimensional spatially averaged skin temperature trend diagram for these regions in all four seasons. In autumn and winter, the warming trends in the 1950s–1960s and early 1980s–2010s were most significant in all three regions with the greatest warming in East Antarctica (figures 4(c), (d), (g), (h), (k) and (l)). Over East Antarctica, significant warming also occurred in winter in the 1960s-early 1970s and early 1980s–2010s (figure 4(d)). East Antarctica exhibited the widest range of segments with significant temperature changes in winter. In spring, although significant warming was observed over West Antarctica in some segments starting before the late 1960s and ending after the early 2000s (figure 4(e)), there were no significant changes over East Antarctica or the Antarctic Peninsula even in longer segments (figures 4(a) and (i)). In summer, only the Antarctic Peninsula exhibited significant trends (figures 4(b), (f) and (j)). Significant warming was found for extended periods in the 1950s–early 1970s and early 1980s–2010s (figure 4(j)). We also found significant cooling of Antarctic Peninsula summer skin temperatures in both long and short segments starting after the 1980s and ending after the early 2010s, in agreement with an absence of warming since 1999 (Turner et al 2016). In addition, for short segments (<20 years) in the 21st century, skin temperature warming trends are not clearly seen over the all regions in all seasons except for in summer over East Antarctica (figure 4). Therefore, there is an absence of skin temperature warming over the entire Antarctic continent Antarctica since early 2000 (figure 1(a)). This corresponds to a period where, for the most part, there has been a progressive increase in Antarctic sea ice extent (Simmonds 2015). We do note, however, that 2020 established a new temperature record for Antarctica (figure 1(a)), a year in which the global average surface temperature tied for the hottest on record (Lenssen et al 2019). For more short segments (<10 years), skin temperature trend amplitudes were larger than long segments in all seasons in all regions, but these results were not significant (figure 4).

Figure 4. Two-dimensional linear change diagrams of spatially averaged skin temperature (°C decade−1) for (a) spring, (b) summer, (c) autumn and (d) winter in East Antarctica. Data for West Antarctica (e)–(h) and the Antarctic Peninsula (i)–(l) are also shown. All data are plotted along the final year of the studied time interval (horizontal axis) against the starting year (vertical axis). The gray shading overlays areas where the trends are not significant at the 95% confidence level.
Download figure:
Standard image High-resolution imageWe similarly investigated trends in ld/4σTs
3 (figure S5). It is striking that the magnitude and distribution of ld/4σTs
3 are very similar to skin temperature in all areas and seasons, except for spring over East Antarctica (figures 4 and S5). To explore the similarities in more detail, we calculated the ratios of ld/4σTs
3 and skin temperature changes (figure 5). When both skin temperature and ld/4σTs
3 exhibited significant changes, the ratio exceeded 0.7 in all regions in all seasons. In particular, the ratio exceeded 0.8 in autumn and winter over West Antarctica, with the highest values >1.0 in winter (figures 5(g) and (h)). In addition, high ratio values were found in short segments for the Antarctic Peninsula in summer when there was a negative trend in skin temperature changes (figure 5(j)). These results indicate that spatial and temporal Antarctic skin temperature changes are overwhelmingly explained by changes in longwave radiation.

Figure 5. Two-dimensional linear change diagrams of the ratio of downward longwave radiation (ld)/4σTs
3 and skin temperature trends for (a) spring, (b) summer, (c) autumn and (d) winter in East Antarctica. Data for West Antarctica (e)–(h) and the Antarctic Peninsula (i)–(l) are also shown. All data are plotted along the final year of the studied time interval (horizontal axis) against the starting year (vertical axis). The gray shading overlays areas where the trends are not significant at the 95% confidence level.
Download figure:
Standard image High-resolution image
4. Discussion and summary
To investigate long term trends in atmospheric and oceanic parameters, we used the preliminary version of ERA5 data for pre-satellite era of 1950–1978. In this first part of the ERA5 data set, the central pressure of some tropical cyclones was significantly lower than observations, but many other aspects of this dataset were satisfactory and robust (https://confluence.ecmwf.int/display/CKB/ERA5+back+extension+1950-1978+%28Preliminary+version%29%3A+tropical+cyclones+are+too+intense). The ERA-Interim data have the best performance of air surface temperature interannual variability compared with other reanalysis data (Huai et al 2019). Compared with ERA-Interim, the accuracy of air temperatures in the ERA5 is improved, as it is the successor data set to ERA-Interim (Gossart et al 2019, Tetzner et al 2019, Hillebrand et al 2020). In addition, comparisons of air temperature at 2 m from ERA5 with air temperature data at 14 Antarctica stations from each start observation years to 2020 showed that simulated T2m was in good agreement with in situ air temperature at Antarctica stations (figure S6 and table S1). The correlation coefficients of air temperature between ERA5 and observations attain at least 0.8 except for five stations. At three stations (d'Urville, Mawson and Halley), although cooling air temperature trends are observed over the 71 years, the opposite trends are found in ERA5. At these stations, difference in air temperature bias for each period would result from difference in number of assimilated observation data around these stations into ERA5 (Sato et al 2020), causing air temperature trend bias in ERA5. However, almost upper air temperatures at ten Antarctica stations in ERA5 have relatively high correlations (>0.80), indicating that ERA5 is an effective tool to investigate the climate change in Antarctica (figure S7 and table S2).
The long-term surface air temperature trend, which showed the greatest warming over the Ross Sea in spring and a relative warming trend over the Antarctic Peninsula in autumn and winter (figures 3(a)–(d)), is consistent with that found by Jones et al (2019). The long term air temperature trends over the Peninsula is indicator of local scale variability compared to short period less than 30 years (Gonzalez and Fortuny 2018, Jones et al 2019). In fact, Jones et al (2019) showed that changes in ocean surface temperatures influence air temperatures over coastal Antarctic stations in all seasons from 1957 to 2016. Therefore, skin temperature warming trends would be seen even in newer reanalysis data sets that have an improved reproduction of tropical cyclones. In fact, Antarctic warming trends for long periods (> 60 years) were also seen in the other reanalysis data sets (e.g. ERA20C and JRA55), whereas the amplitude of changes in Antarctic temperature was different among the reanalysis data sets (figures S1 and S8(a)–(d)).
In summary, we examined Antarctic skin temperature changes since 1950 and their causes using the reanalysis data from ERA5. These changes were explored over the entire record (1950–2020), as well as in specific segments of the study interval. For long segments (>30 years) starting before 1960, all Antarctic regions showed significant warming in autumn and winter. Conversely, the Antarctic Peninsula showed significant warming trends in summer over long segments and cooling trends over short segments. The increase in downward longwave radiation related to increases in air temperatures play a major role in skin temperature warming in all regions; the same is true for the opposite, i.e. that decreases in downward longwave radiation and air temperatures affect skin temperature cooling. The circumpolar westerly flow associated with negative SLP trends around Antarctica promotes northerly warm and moist advection over the Antarctic Peninsula and West Antarctica. Over the interior of East Antarctica, increases moisture advection enhance low level cloud cover, which leads to skin temperature warming. Our results are consistent with those from the Arctic (Lee et al 2017) in that broad temporal and spatial changes in Antarctic surface temperatures are strongly associated with variations in atmospheric moisture loading and the subsequent impacts of 'greenhouse' modification in downward longwave radiation.
Acknowledgments
This work was supported by a JSPS Overseas Research Fellowship (JSPS KAKENHI 20H04963, 19K14802) awarded to K.S. I.S. was supported by the Australian Research Council (Grant No. DP160101997). We would like to thank two anonymous reviewers for very helpful comments. We thank Sev Kender, PhD, from Edanz Group (https://en-author-services.edanz.com/ac) for correcting a draft of this manuscript.
Data availability statement
All data that support the findings of this study are included within the article (and any supplementary files).