

Abstract
How relative humidity is changing is important for our understanding of future changes in precipitation and evaporation. For example, decreases in relative humidity have the potential to increase evaporation and evapotranspiration increasing water scarcity. Since projected precipitation changes are highly uncertain, there is significant research relating precipitation changes to more certain local temperature increases, but such research often assumes relative humidity will remain constant. Here, we investigate how absolute and relative humidity across Australia have changed over 1955–2020. Absolute humidity, measured by dew point temperature, has remained relatively constant, while relative humidity has decreased on average over land by approximately −1%/decade. This suggests that assuming constant relative humidity when predicting future extreme precipitation using temperature or absolute humidity associations may result in over-estimation of future extreme precipitation intensities. As absolute humidity, measured by dew point temperature, was found to be relatively constant, we conclude the decrease in relative humidity is not due to a lack of water available for evaporation but may instead be the result of evaporation not increasing in line with temperature increases.
Export citation and abstract BibTeX RIS

Original content from this work may be used under the terms of the Creative Commons Attribution 4.0 license. Any further distribution of this work must maintain attribution to the author(s) and the title of the work, journal citation and DOI.
1. Introduction
Understanding how extreme precipitation will change in the future is important for water resource and flood planning. Whilst the knowledge of how temperature will change into the future is well understood and predicted, how extreme precipitation is expected to change is subject to much uncertainty (Trenberth 2011, Fowler et al 2021). Global and regional climate models have high skill in projecting temperature change but have thus far proved less skillful in simulating and projecting precipitation changes (Kundzewicz and Stakhiv 2010, Hartmann et al 2013, Allan et al 2014, Peleg et al 2019, Kim et al 2020). For this reason, many studies investigating the projection of extreme precipitation aim to relate precipitation directly to temperature change in order to take advantage of the robust temperature projections (Lenderink and Attema 2015, Agilan and Umamahesh 2017, Ali and Mishra 2017, Roderick et al 2020). This is based on the Clausius–Clapeyron (CC) relationship which states that as the temperature increases, the atmosphere has the capacity to hold more moisture, following a rate of 6–7% °C−1 (Allen and Ingram 2002). If it can be assumed that precipitation extremes scale with surface or column water (O'Gorman and Muller 2010, Bao et al 2017) then precipitation extremes can be expected to increase with increasing temperature. But for this relationship to be true, locally, relative humidity must remain constant (Westra et al 2014).
Studies relating day to day variations in local historical temperatures to extreme precipitation intensities have found precipitation-temperature associations in line with (Berg and Haerter 2013, Panthou et al 2014, Molnar et al 2015), and in excess of (Lenderink and van Meijgaard 2008, Wasko et al 2015, Busuioc et al 2016, Chan et al 2016, Ali and Mishra 2017, Visser et al 2020), the CC relationship. But at higher temperatures, reduced precipitation has been associated with further increases in temperature (Hardwick Jones et al 2010, Utsumi et al 2011, Maeda et al 2012, Wasko et al 2016). The most commonly suggested cause of this negative precipitation-temperature relationship is decreasing relative humidity at higher temperatures (Hardwick Jones et al 2010, Drobinski et al 2016) due to the supply of moisture available for evaporation being exhausted (Trenberth and Shea 2005, Vautard et al 2007, Wang et al 2017, Roderick et al 2019). As local temperature may not be representative of the precipitable moisture source (Zhang et al 2017), coastal regions where moisture availability is greater, exhibit greater associations of precipitation with temperature (Panthou et al 2014, Drobinski et al 2016).
Surface air temperature is not a direct measure of moisture availability in the atmosphere. Hence, absolute humidity, measured by dew point temperature, has been suggested as an alternative covariate for studying local precipitation-temperature associations (Lenderink and van Meijgaard 2010). The dew point temperature is the temperature at which saturation and therefore precipitation will occur if an air parcel is cooled and therefore depends upon the absolute humidity or the amount of water vapor in the air. Day-to-day associations between dew point temperature and precipitation have been found to be stronger, more positive, and more robust than studies using air temperature in India (Ali and Mishra 2017), Hong Kong, the Netherlands (Lenderink et al 2011), South Korea (Park and Min 2017), Australia (Wasko et al 2018), Europe (Lenderink and van Meijgaard 2010), as well as globally (Ali et al 2018). However, precipitation was still found to decrease after a certain dew point temperature was reached (Lenderink et al 2011, Park and Min 2017), which Park and Min (2017) suggested was due to the sharp reduction in relative humidity at higher temperatures.
The assumption of constant relative humidity in a changing climate is supported by theoretical water vapor feedback processes and global circulation models (Held and Soden 2000, Ingram 2002, Pierrehumbert et al 2007, Willett et al 2008) where increasing temperature acts to increase evaporation and moisture storage in the atmosphere, with the two changes counteracting each other to keep relative humidity quasi-constant. There is evidence from observational studies that relative humidity over land is being conserved (Trenberth et al 2005, Willett et al 2010). However, other studies find evidence against constant relative humidity over land (Dai 2006, Simmons et al 2010, Ye et al 2015). As land areas are warming at a greater rate than the ocean, a saturated parcel of air above the ocean at a lower temperature would become sub-saturated as it heats up over land causing a decrease in the relative humidity of onshore airflow (Fasullo 2012, Byrne and O'Gorman 2018). The magnitude of this decrease is estimated as ∼1.8% °C−1 in relative humidity (Fasullo 2012). These decreases in relative humidity are in agreement with smaller increases in specific humidity being projected over land (5.7% °C−1) as compared to the ocean which follow CC at 6–7% °C−1 (O'Gorman and Muller 2010).
Long-term observational trends in surface relative humidity remain unclear (Byrne and O'Gorman 2016). For example, using the 5° × 5° global Hadley Centre and Climate Research Unit (HadCRUH) dataset from 1973 to 2003, positive trends are observed over North America, Northwest Africa and South, Central and North East Asia, while negative trends are observed over most of the Southern Hemisphere, Europe and East Asia (Willett et al 2008). Dai (2006) who used four global and two oceanic datasets from 1975 to 2005 of temperature, dew point, and air pressure to derive relative humidity trends found similar regional variation—positive trends over the US, India and East Asia, and negative trends over most oceans, East Brazil, and Australia. But other studies show reductions in relative humidity over low‐latitude and midlatitude land areas. Using data from European Centre for Medium-Range Weather Forecasts reanalyses (ERA-40, ERA-Interim) and HadCRUH from 1973 to 2008 a decrease in relative humidity was particularly apparent over a period of about 10 years leading up to 2008 (Simmons et al 2010). More recently, using the 5° × 5° global gridded Met Office Hadley Centre Integrated Surface Database Humidity Dataset (HadISDH.2.0.0) from 1973 to 2013, negative relative humidity trends were found over most land areas with the exceptions of India, northern America, and Europe, but these long term trends were largely insignficant (Willett et al 2014).
Relative humidity changes do not just affect moisture availability for mean and extreme preciptiation. Stephens et al (2018) attributed increases in pan evaporation across Australia to increases in the vapour pressure deficit, suggesting increased evaporative demand in the future may reduce water security. Decreases in relative humidity are related to increases in evaporative demand (McMahon et al 2013), resulting in additional evapotranspiration occuring up to a point where stomatal closure can reduce evapotranspiration at low relative humidity (Bauer et al 2013, Byrne and O'Gorman 2016) or be limited by soil moisture availaiblity (Jung et al 2010). As a result, evaporative demand strongly influences catchment dynamics and water availability (Saft et al 2016). Increases in relative humidity are linked to increased heat stress (Sherwood and Huber 2010) and poorer health outcomes (Ding et al 2016).
Currently there does not exist a consistent picture of historical changes in relative humidity. Most studies investigating trends in relative humidity rely on gridded observations, reanalysis, or climate model simuations. Given the importance of relative humidity changes to understanding extreme precipitation changes and water availability, we aim to answer the question: has relative humidity remained constant? We use a high quality observed data set across Australia dating back to 1955 to analyse trends in temperature, dew point temperature, and relative humidity. We present one of the longest gauge observation trend studies using relative humidity on a continental level. Our findings are discussed in the context of future changes to extreme precipitation and evaporation.
2. Data and methods
Data were obtained from the Australian Bureau of Meteorology up to the year 2020 (inclusive), consisting of 1830 climate stations across Australia with varied start and end dates. The temperature records consist of average daily temperature, calculated as an average of daily maximum and daily minimum temperatures. The relative humidity data consists of sub-daily readings taken every 3 h starting from midnight (0 am). The number of readings recorded per day varies, with many stations recording only two observations per day at 9 am and 3 pm, and a minority the full eight sub-daily observations. Relative humidity is obtained either from electronic relative humidity sensor measurements or derived from wet and dry bulb measurements, with the dew point derived from wet and dry bulb temperature observations measured either using a mercury or platinum resistance thermometer (Lucas 2010). The average daily dew point temperature is used as a measure of absolute humidity and is available as the average of all sub-daily humidity observations. The data are quality controlled by the Australian Bureau of Meteorology and hence used as provided. As station metadata are not provided a discussion of the possible impact of instrumentation changes is discussed in section 4.2.
Data were filtered to include only data with a consistent number of daily observations. Two different approaches were taken. The first was to filter for stations with only eight observations or more per day. The second approach was to consider only temperature and relative humidity data, using all data with a minimum of two observations per day, using the average temperature from the maxima and minima and the average relative humidity from 9 am to 3 pm. This allowed the number of stations included to be increased as fewer stations have eight daily observations. The daily average relative humidity was then calculated from the 2 or 8 values.
Each station was filtered to remove incomplete datasets and to consider a consistent time period. Years with more than 20% of the days missing were excluded as were stations with more than 20% of years missing over the time period considered. Sensitivity tests changing this threshold to 15% or 10% reduced the number of stations but did not change conclusions presented here. Two time periods have been considered in this study, a 33 year period of 1988–2020 and a 66 year period from 1955–2020. These periods were selected to balance the need for an extensive spatial coverage of stations and longest record length possible. Two time periods are considered to ensure that the results are not sensitive to the selection of start year.
To test for (non-linear monotonic) trend we used the Mann–Kendall trend test (Mann 1945, Kendall 1975) with bias corrected pre-whitening to remove the effect of any serial correlation (Hamed 2009). Trend magnitude was calculated using the Theil–Sen estimator (Theil 1950, Sen 1968). For the interested reader an example time series is presented in figure S1 (available online at stacks.iop.org/ERL/16/074023/mmedia). As the Mann–Kendall trend test identifies statistical significance of the trend both the Mann–Kendall trend test and Theil–Sen estimator are presented in unison (see figure 1 for example). The Mann–Kendall test is described in Hamed (2009) and the Theil–Sen estimator for a time series is calculated as:

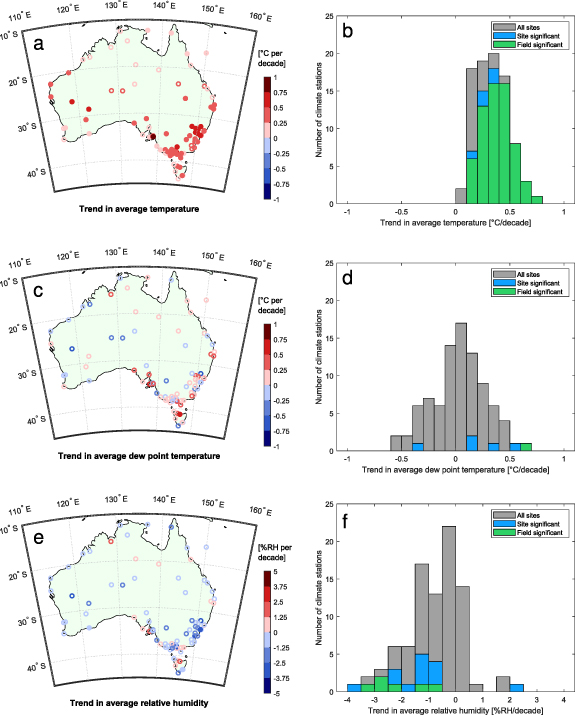
Figure 1. Changes in climatic variables across Australia over the period 1988–2020 using stations with eight observations available per day. (a) Map of temperature trends, (b) histogram of temperature trends, (c) map of dew point temperature trends, (d) histogram of dew point temperature trends, (e) map of relative humidity trends, and (f) histogram of relative humidity trends. Filled circles in the maps indicate field significance. Histograms present the magnitude of the trend at all the sites with colour indicating statistical significance.
Download figure:
Standard image High-resolution imageWhere  and are the relative humidity pairs for years i, j. The decadal trend is the Theil–Sen estimator multiplied by 10. We note that linear regression was also used as an alternative to the Theil–Sen estimator and results remained consistent as per similar studies that use both methods for trend magnitude estimation (Wasko et al
2020).
and are the relative humidity pairs for years i, j. The decadal trend is the Theil–Sen estimator multiplied by 10. We note that linear regression was also used as an alternative to the Theil–Sen estimator and results remained consistent as per similar studies that use both methods for trend magnitude estimation (Wasko et al
2020).
The significance in trend for each station analysed is presented with an α = 0.05. To eliminate false discovery rate errors in significance testing due to spatial dependence, the field significance was also considered using the method of Wilks (2006). The field (or global) significance adjusts the level of significance such that a p-value (p) is deemed statistically field significant if the following criteria is satisfied:
where j is the p-value rank sorted from largest (j = N) to smallest (j =1). For investigating relative humidity trends solely on rainy days, daily rainfall data was obtained from the Bureau of Meteorology. As rain is reported at 9am for the previous 24 h the temperature and humidity data are matched to the next day's rainfall. The relationship of relative humidity to the El Niño–Southern Oscillation (ENSO) was investigated using the Niño 3.4 index (Rayner et al 2003) defined as the area averaged sea surface temperature anomaly from 5°S–5°N and 170°–120°W.
3. Results
3.1. Temperature, dew point temperature, and relative humidity trends
Results for the period 1988–2020 using data with eight observations per day are shown in figure 1. Figures 1(a), (c) and (e) show maps of the strength of trend for temperature, dew point temperature, and relative humidity for all included stations. Figures 1(b), (d) and (f) present a histogram of trend magnitude (also highlighting statistically significant trends).
Figure 1(a) presents increasing temperatures across Australia. Temperature increases are much lower in the north of Australia likely due to increasing rainfall in the tropics. Although changes are not spatially weighted, the arithmetic mean trend of 0.32 °C per decade is consistent with previous studies (CSIRO & BOM 2018), suggesting our station sample is representative of continental changes. Figure 1(b) presents a histogram of the station temperature trends. The increase in temperature is statistically significant (locally and globally) at a majority of sites.
The changes in dew point temperature however are mixed (figures 1(c) and (d)), with large variability between stations and a relatively even spread of increasing and decreasing trends. There is little overall trend in dew point temperature with an average trend of 0.03 °C/decade. Of the 88 sites, only six sites had statistically significant trends. Dew point temperature, and therefore absolute humidity, displays a large degree of variability with no clear and significant changes over the period 1988–2020.
Relative humidity, however, is broadly decreasing (figure 1(e)), with the histogram showing a pronounced shift towards negative trends (figure 1(f)). The average trend in relative humidity across all sites is −0.8% per decade. 80% of sites (70 sites) have trends of reducing relative humidity, and, of these sites, 24% are at site statistically significant. Of the 21% of sites (18 sites) showing positive trends in relative humidity, only one site was statistically significant. A scatter plot of the relative humidity and temperature trends in figure S2 confirms the strength of the relative humidity trend is related to the strength of the temperature trend with a Spearman rank correlation of −0.50. Overall, relative humidity decreased as the climate warmed over the period 1988–2020. Changes for individual seasons and in the annual maximum relative humidity of the 8 values were also analyzed but are not presented as they show little difference compared to the annual average trends.
3.2. Sensitivity of relative humidity trends to analysis start year
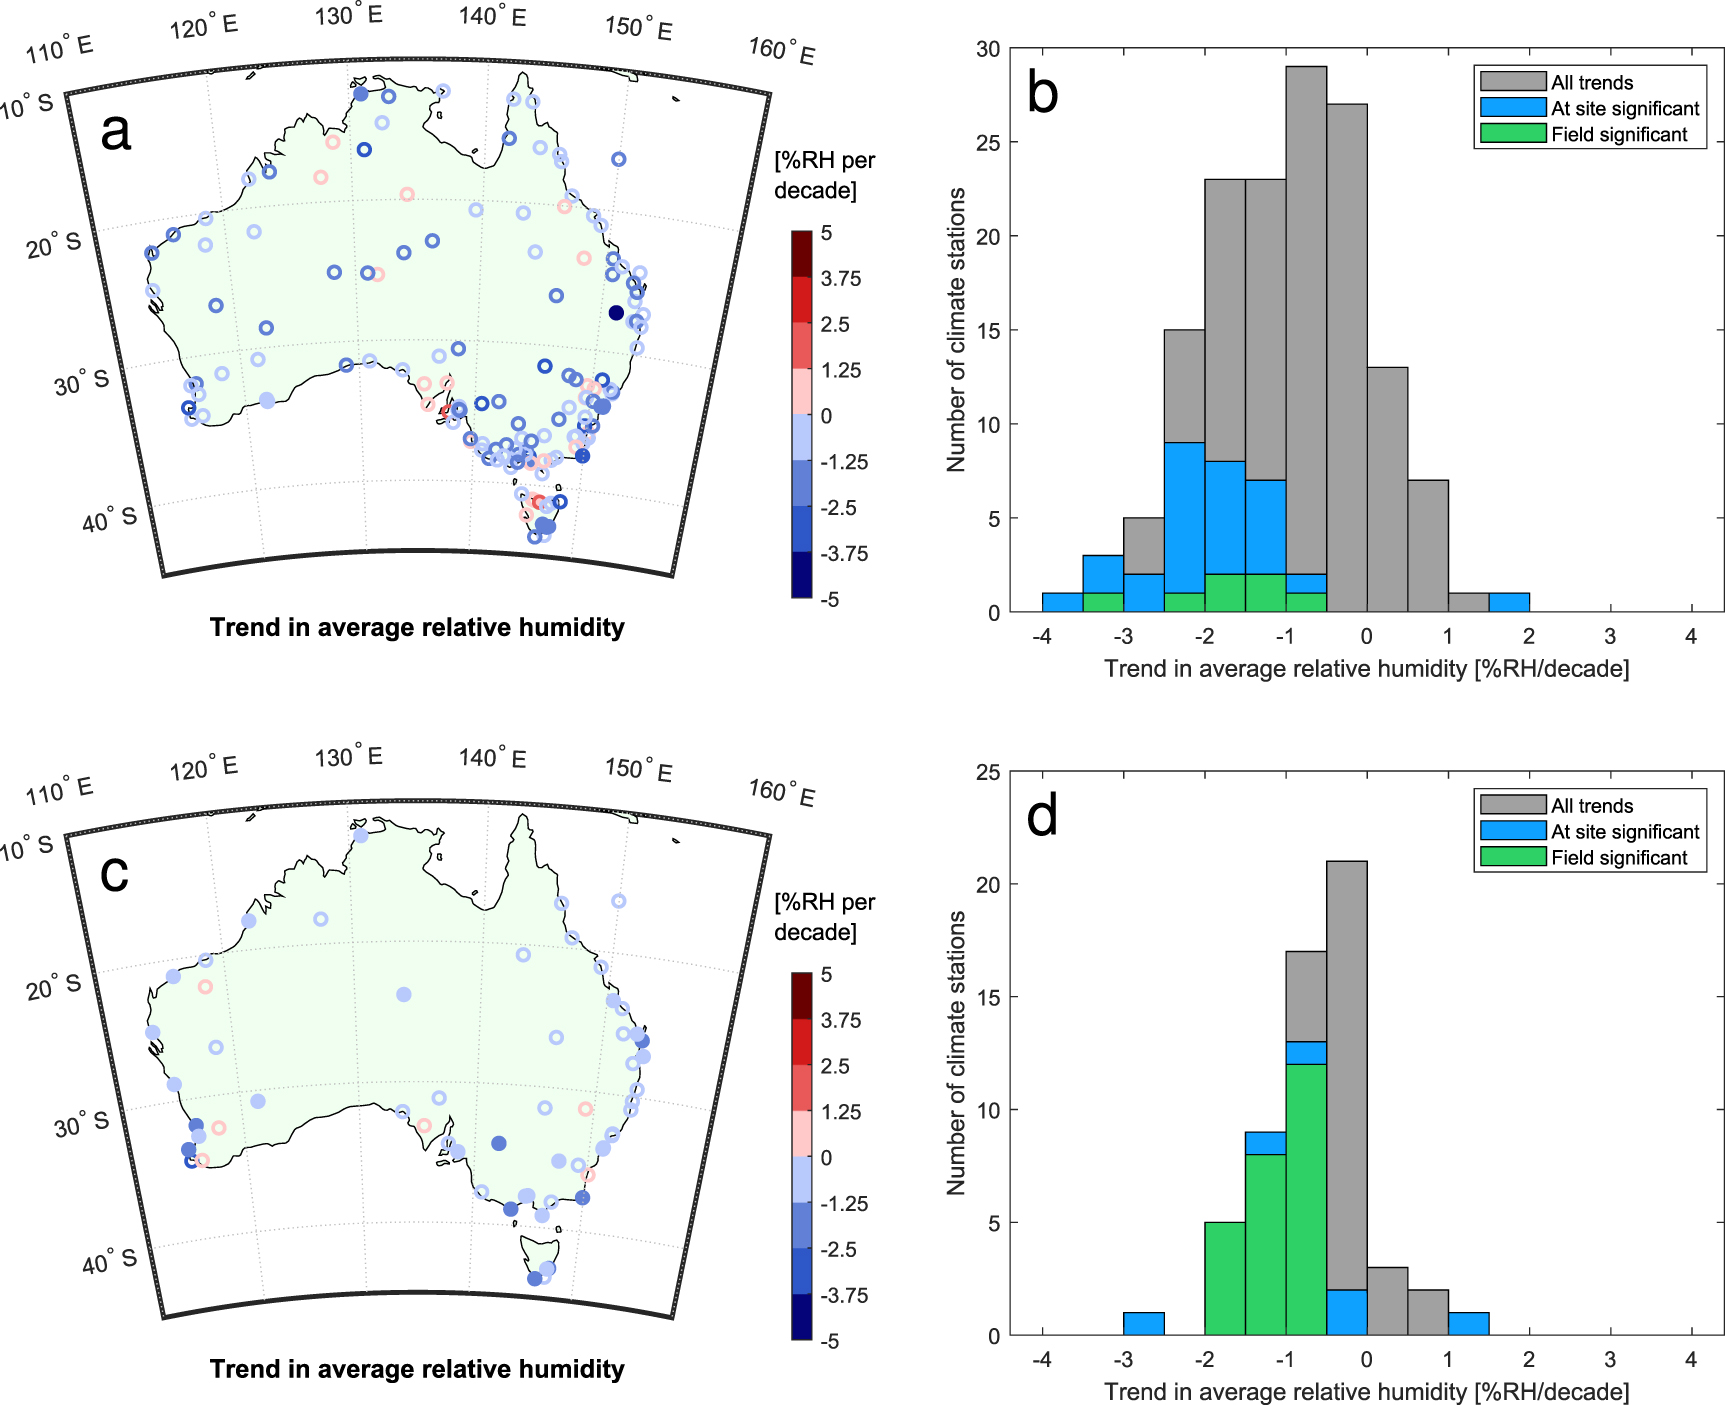
To ensure continental coverage, stations with eight observations per day were only able to be analyzed from 1988 onwards. Figure 2 shows the relative humidity trends using two observations per day over the periods 1988–2020 (figures 2(a) and (b)) and 1955–2020 (figures 2(c) and (d)). We note the Spearman correlation between the eight and two times a day series across all the sites analysed has a median value of 0.96 indicating strong correspondence of the time series.

Figure 2. Relative humidity trend for periods 1988–2020 and 1955–2020 using two observations per day. (a) Map of relative humidity trends over the period 1988–2020. (b) Histogram of relative humidity trends over the period 1988–2020. (c) Map of relative humidity trends over the period 1955–2020. (d) Histogram of relative humidity trends over the period 1955–2020. Filled circles in the maps indicate field significance. Histograms present the magnitude of the trend at all the sites with colour indicating statistical significance.
Download figure:
Standard image High-resolution imageThe results for 1988–2020 (figure 2(b)) show a similar distribution of trends to the analysis using eight values (figure 1(f)) suggesting that using two values per day, although reducing temporal data resolution, gives similar average daily relative humidity trends. The mean trend is −1.0%/decade. The majority (85%) of sites show negative trends, with 26% of these sites being at site statistically significant (figure 2(b)). Of the sites showing positive trends (15%), 1 of 22 sites is at site statistically significant. When comparing only the overlapping climate stations (stations with both 2 and 8 observations per day), the average relative humidity trend across Australia over the period 1988–2020 were −0.9% and −1.0% per decade when using 8 and 2 observations per day respectively.
The analysis is extended back to 1955 using two observations per day (figure 2(c)). Fewer stations were operating in the middle of the 20th century (Trewin 2013) and hence the number of stations is reduced. Trends in relative humidity are less strong (figure 2(d)) compared to the analysis starting in 1988 (figure 2(b)). However, both the map (figure 2(c)) and histogram (figure 2(d)) still present decreasing relative humidity, with an average trend of −0.6%/decade and 90% of sites showing negative trends, with 47% of these field significant. This reduced magnitude in the decreasing trend is consistent with the greatest warming occurring in the most recent decades. Figures 2(a) and (c) show no clear regions of positive or negative trends, suggesting that decreasing relative humidity is uniform across the continent.
Figure 3 shows a comparison of the distribution of trends, for both temperature and relative humidity, considering trends only from the stations included in both the 1955 and 1988 datasets. The median temperature trends for start years of 1988 and 1955 are 0.25 and 0.24 °C/decade respectively. This indicates that the strength of the temperature trend is not strongly influenced by the start year used. The median trend for relative humidity is −1.0 and −0.9%/decade for 1988 and 1955 respectively. There exists some variability associated with the precise magnitude of relative humidity change, but the robust increase in the temperature suggests the observed decreases in relative humidity are representative of the continental trends observed since 1955 due to climate change.

Figure 3. Boxplot of trends for start years of 1988 and 1955 for (a) temperature and (b) relative humidity. Trends use the interesecting subset of climate stations presented in figures 2(a) and (c). The boxplots present the median and extend to the 25th and the 75th percentile, with whiskers extending to the data point no more than 1.5 times the interquartile range.
Download figure:
Standard image High-resolution image3.3. Trend in relative humidity using rain days only
Reductions in relative humidity could be due to a decreasing frequency of rain days. Figure 4 shows trends calculated for rain days and all days for temperature and relative humidity. Trends were calculated for stations using both two (figure 2(a)) and eight observations (figure 1(e)) per day for days with more than 1 mm of rain only. The temperature trends on rain days show similar results to all days (figures 4(a) and (c)), with the average trend for eight observations per day being 0.33 °C/decade for rain days compared to 0.32 °C/decade for all days (figure 4(c)). Using eight observations per day (figure 4(d)), 77% of relative humidity trends on rain days are negative, 32% of these are significant and 22% of trends are positive, with none of these significant. The results using two observations per day (figure 4(b)) show 78% of relative humidity trends on rain days are negative, with 24% of them being significant, and 21% of trends are positive, with 2 (10%) of them being significant. Compared to the results in figure 1(e), where 80% of sites were negative, the trends are slightly less strongly negative but continue to show a reduction.

Figure 4. Boxplots of temperature and relative humidity trends for rain days compared to non-rain days for 1988–2020. (a) Temperature trends using two observations per day, (b) relative humidity trends using two observations per day, (c) temperature trends using eight observations per day, and (d) relative humidity trends using eight observations per day. The boxplots present the median and extend to the 25th and the 75th percentile, with whiskers extending to the data point no more than 1.5 times the interquartile range.
Download figure:
Standard image High-resolution imageThere is little evidence for differences in trend for either temperature or relative humidity, regardless of whether the analysis is performed using all days or just rain days. The average trend for relative humidity on rain days is −0.85 and −0.78%/decade for 8 and 2 observations per day respectively (figures 4(d) and (b)). Hence changes in annual relative humidity appear independent of the number of rain days.
3.4. Impact of the El Niño–Southern Oscillation
El Niño (positive Niño 3.4) means less rain days (Pui et al 2012), drier conditions, and lower average relative humidity, particularly for the east coast of Australia. There is a negative correlation between annual average relative humidity and Niño 3.4 (figure 5) suggesting trends in relative humidity could be affected by trends in ENSO. The median correlation of all sites analysis was −0.25 suggesting that the median amount of variance explained by ENSO variability is approximately 6%. A Mann–Kendall trend test (and linear regression) revealed no statistically significant trend in the Niño 3.4 index for the two periods, 1988–2020 and 1955–2020, considered here. The Theil–Sen slope trend in the Niño 3.4 index for 1955–2020 was 0.003/decade (p-value of 0.56) while the trend in the Niño 3.4 index for 1988–2020 was 0.002/decade (p-value of 0.96). Although possible future changes in ENSO may impact average relative humidity, the impact of ENSO on humidity changes is small and it is noted that future changes to ENSO are uncertain (Vecchi and Wittenberg 2010, Yeh et al 2018).

Figure 5. Spearman rank correlation of Niño 3.4 to relative humidity from 1955 to 2020 using two observations of relative humidity per day. Filled circles are statistically significant at the 5% level.
Download figure:
Standard image High-resolution image
4. Discussion
4.1. Relationship to water availability
Our results indicate that relative humidity in Australia is on average decreasing. It has been suggested that in water limited regions, relative humidity is likely to fall as temperature increases, as the absolute humidity is limited by a lack of moisture (Roderick et al 2019). This theory indicates that coastal regions should be more likely to have constant relative humidity and arid inland regions would have the strongest decreases in relative humidity as temperature increases. However, our results do not support this. Both inland and coastal regions show evidence of reductions in relative humidity. Our results are consistent with land areas warming at a greater rate than the ocean (Sherwood and Fu 2014) causing a decrease in the relative humidity of onshore airflow (Fasullo 2012, Byrne and O'Gorman 2018) as a saturated parcel of air above the ocean at a lower temperature would become sub-saturated as it heats up over land (Hardwick Jones et al 2010). It is worth noting that oceans contribute 85% of the moisture in the atmosphere (Bigg 2003). The reductions in relative humidity across Australia observed here also, in part, explain the increased rate of pan evaporation as found by Stephens et al (2018).
4.2. Comparison to previous studies
The data has been quality controlled by the Australian Bureau of Meteorology. We note that we did not attempt to perform any additional homogenization as statistical tests for non-climatic changes without any metadata are generally not effective and any adjustment of the time series could in fact introduce error. Visual inspection and Pettitt change point test of each of the time series did not reveal any systematic changes for example, due to instrumentation change. In their study of dew point temperature trends for 58 sites across Australia, Lucas (2010) calculated dew point temperature trends before and after homogenization. A dew point temperature trend of 0.117 ± 0.130 °C/decade over 1957–2003 was calculated post-homogenization, an increase of +0.12 °C/decade compared to pre-homogenized data, with 77% of stations showing a more positive trend. The climate stations used in Lucas (2010) make up 48% of the stations included in this study (figure 1(c)), therefore a shift of a similar magnitude could occur to the results of this study. If the results from Lucas (2010) were adopted, which we stress use a much shorter record, the +0.117 ± 0.130 °C/decade average dew point trend, combined with an average temperature change of +0.3 °C/decade would still result in a relative humidity trend of −0.45%/decade (using an average Australian temperature of 18.6 °C). Even using the more positive dew point temperature trends found in the Lucas (2010) study, the results here would still point towards a reduction in relative humidity.
4.3. Implications for future rainfall
A key consideration with respect to relative humidity changes is that lower relative humidity makes rainfall less likely to occur. Precipitation is only possible when relative humidity reaches 100%, which is often induced by air rising and cooling to the dew point temperature. When the average relative humidity is decreased, more cooling must occur to induce rainfall. Higher relative humidity has been suggested as a reason why more rainfall occurs in winter across northern Eurasia (Ye et al 2014) as the triggers required to induce precipitation are more easily and frequently met. This may mean that decreasing relative humidity over Australia may result in less frequent rainfall. As decreases in relative humidity increase the lifting condensation level, we could expect a shift towards less frequent (also resulting in more intense) rainfall events (Fasullo 2012). Indeed, over the study period, across southern Australia the number of rain days on average has decreased (figure S3) and a decrease in the frequency of long duration fronts and cyclones that produce rainfall has been observed along with an increase in the amount of rainfall from short-duration thunderstorms (Dey et al 2020, Pepler et al 2021). But in the north the number of rain days has increased (figure S3), consistent with increases in mean rainfall (Wasko et al 2021). Hence the interaction between changes in relative humidity and rainfall occurrence (and magnitude) is likely to be far more complicated than the relatively simple conceptualisation presented here.
5. Conclusions
This study investigated changes in temperature, relative humidity, and dew point temperature across Australia using data covering 1955–2020. The average trend in relative humidity for Australia was −0.6%/decade, −1.0%/decade and −0.8%/decade using the following datasets respectively; 1955–2020 and two observations per day, 1988–2020 and two observations per day, 1988–2020 and eight observations per day. The decrease in relative humidity is robust across multiple data handling methods including the number of daily readings used, data completeness requirements, and the analysis start year. The absolute humidity, measured by dew point temperature, was found to be relatively constant on average. It was found that relative humidity has decreased across both coastal and inland regions. As a large source of moisture is advection from the oceans, this suggests that the cause of the decrease in relative humidity is not necessarily a lack of moisture (specific humidity), but evaporation not increasing enough to keep pace with temperature increases. The finding that relative humidity is decreasing is important as assuming a constant relative humidity and extrapolating extreme rainfall intensity changes purely using temperature or absolute humidity associations may result in over-estimates of future extreme rainfall intensities. Decreases in relative humidity suggest increasing water scarcity for an already susceptible continent.
Acknowledgments
Conrad Wasko receives funding from The University of Melbourne McKenzie Postdoctoral Fellowship scheme and Australian Research Council (DE210100479, DP200101326). Data used in this study was obtained from the Australian Bureau of Meteorology at www.bom.gov.au/climate/data/stations/. The Niño 3.4 index is freely available from https://psl.noaa.gov/gcos_wgsp/Timeseries/Data/nino34.long.anom.data. Conrad Wasko acknowledges conversations with Chris Lucas and Johan Visser.
Data availability statement
The data generated and/or analysed during the current study are not publicly available for legal/ethical reasons but are available from the corresponding author on reasonable request.