

Abstract
Infiltration of stormwater is a widely used strategy to mitigate the flooding and environmental risks that come from urban runoff and conventional urban drainage. An understanding of the fate of this infiltrated water is required for rigorous design. Principal design objectives are typically to restore more natural hydrology in order to protect receiving waters from pollution and hydrologic change. Without such understanding there is also a risk of unforeseen impacts on nearby infrastructure and urban vegetation. We sought to understand the pathways and fate of water from a stormwater infiltration basin. To trace water, we used a combination of water table monitoring and isotopic composition analysis in the infiltration basin, as well as in rainfall, soil water, the shallow groundwater, and in vegetation upslope and downslope of the basin. We also measured tree water use directly using sap flow sensors. The infiltration basin was shown to increase the availability of water downslope, allowing trees to maintain elevated levels of water use during dry periods with high energy demand. In contrast, water limitation upslope saw substantial seasonal reductions in tree water use. The soil water isotopic composition demonstrated significant differences from upslope to downslope, with downslope water being more reflective of rainfall, while the upslope water used by the trees was more depleted. The results paint a picture of stormwater infiltration being a significant source of lateral flow, while trees are a significant sink of lateral flow emanating from the basin. This finding suggests that stormwater infiltration could be used as a strategy to support the health and growth of urban trees. Urban trees have demonstrated benefits for human health and comfort, particularly in a warming climate. It also suggests that stormwater infiltration may not always recharge groundwater and provide baseflow in receiving waters, being instead taken up by vegetation. These findings should be considered in the siting of stormwater infiltration systems, to ensure that the objectives they were designed for are actually met.
Export citation and abstract BibTeX RIS

Original content from this work may be used under the terms of the Creative Commons Attribution 4.0 license. Any further distribution of this work must maintain attribution to the author(s) and the title of the work, journal citation and DOI.
1. Introduction
Urbanization dramatically alters the water cycle. When deep-rooted vegetation is removed and native soils are sealed with impervious surfaces, rainfall loss via evapotranspiration to the atmosphere and infiltration into local soils is substantially reduced [1], while surface runoff increases significantly, posing a flood risk to society [2]. While such risk is commonly managed using conventional stormwater drainage systems (i.e. gutters, pipes, channels to efficiently convey runoff), doing so results in severe ecological degradation of receiving waters [3]. In fact, streams draining urban landscapes are ubiquitously degraded [4, 5], and mitigating this degradation has been a major focus over the last decade [6, 7].
In an effort to protect or restore the health of freshwater receiving waters, green infrastructure (GI) is emerging. GI aims to return more natural flow and water quality regimes by mimicking pre-urban water fluxes. The practice of stormwater infiltration is particularly important in addressing the loss of infiltration in urban areas [8].
Despite the rising popularity of stormwater infiltration, the practice has not been matched with research effort on the fate of this water [9]. This is concerning for several reasons. Firstly, attempts to restore the low-flow aspects of the flow regime may not result in detectable hydrologic outcomes [10]. Secondly, infiltrated stormwater could mobilize legacy pollutants in the soil and contaminate dry-weather streamflows [11], aggravating the 'urban stream syndrome' [12]. Finally, altered soil water dynamics could have implications for adjacent infrastructure [13] and potentially cause waterlogging stress for vegetation [14]. Conversely, the increase in available soil moisture could enhance the health and survival of urban vegetation, particularly trees, during dry periods [14].
Understanding the fate of infiltrated stormwater is difficult because of complex subsurface pathways and interactions [9]. While soil permeability and bedrock properties play a primary role in the degree of lateral subsurface flow [15, 16], interactions with downslope vegetation are also likely important [17], particularly where vegetation has enhanced access to subsurface water during periods when evaporative demand is greatest [18]. Deep-rooted vegetation could for example, consume infiltrated stormwater before it reaches the receiving water, countering the intended benefits of restoring low flows during dry weather periods. Conversely, such augmented local transpiration could provide microclimate benefits [19].
Increasing our understanding on the fate of infiltrated stormwater has important implications for the design and location of stormwater infiltration systems. In a first analysis of its type, we draw on techniques covering three distinct lines of evidence. We use groundwater hydrology to measure the response of the water table to infiltration and seasonal variations in climate. We use tree physiology to understand how tree water use responds to variations in the water table and soil water, while isotope hydrology allows us to compare the signature of water in the infiltration basin, soil water, the water table, and tree water, providing clear evidence of the source of downslope water, water used by trees, and its seasonal variation. Combined, these three lines of evidence allow us to track the fate of infiltrated stormwater from a large stormwater infiltration system. We aim to answer the following questions:
- (a)How do infiltration systems influence the depth from which water is used by downslope vegetation, and does this vary with season?
- (b)Does vegetation transpire at a greater rate when it has access to infiltrated stormwater?
- (c)What are the implications for the use of stormwater infiltration?
2. Materials and methods
2.1. Experimental design and site description
The study was conducted around a large, vegetated infiltration basin, with mature, deep-rooted forest upslope and downslope of it, using a combination of monitoring techniques to understand interactions between the infiltrated stormwater and the surrounding trees. As presented conceptually in figure 1, this monitoring comprised:
- (a)Continuous hydrometric monitoring of depth to water table, conducted in three zones: 1. within the infiltration basin (herein referred to as 'basin'), 2. upslope, to act as a reference, as it is unaffected by the basin, and 3. downslope, which acts as a treatment, hypothesized to be affected by the basin.
- (b)Sampling for isotopic composition in 1. shallow groundwater bores, 2. sapwood cores taken from trees upslope and downslope, 3. soil cores within 2 × DBH (diameter at breast height) of the sampled trees, 4. infiltration basin water and 5. rainfall. Analysis of isotopic composition aimed to provide insights into the sources of water being used by the trees (i.e. rainwater, soil water or groundwater). The isotopic composition (2H and 18O) sampling was conducted over three separate sampling campaigns: 29 November 2018 ('spring'), 21 February 2019 ('summer') and 16 May 2019 ('autumn'), with the exception of rainfall that was sampled monthly.
- (c)Continuous measurement of sap flow in the upslope and downslope trees was undertaken from 1 June 2018 to 31 May 2019 to characterize the temporal patterns of tree water use. Sap flow provides a direct measurement of the movement of water within a tree, and thus provides the most direct estimate of tree evapotranspiration. In doing so, it provides an indirect measure of tree water availability.

Figure 1. Conceptual representation of experimental design, showing upslope (reference), 'basin' and downslope (treatment) zones. Depth to water table is monitored continuously in five shallow bores (<3 m), located upslope (1), within (1) and downslope of the infiltration basin (3). Isotopic composition is measured during three separate campaigns (spring, summer, autumn) in all bores (except upslope, which remained dry throughout), basin water, tree cores (six upslope, six downslope), soil cores (three upslope, three downslope) and rainfall. Sap flow is measured within six trees in the upslope (3) and downslope (3) zones. Full details of the numbers of samples and sampling locations are given in the text and summarized in supplementary materials table S1 available online at stacks.iop.org/ERL/16/104014/mmedia.
Download figure:
Standard image High-resolution imageCombined, this monitoring programme allowed us to deduce the extent to which stormwater infiltrated from the basin became available to downslope vegetation and how that availability varied seasonally. All data used to produce this article are publicly available on the Open Science Framework at https://osf.io/4hysc/.
The study site and basin have been fully described [20], including its water balance (infiltration) and water quality treatment performance. Wicks Reserve Infiltration Basin is located near Melbourne, in South-Eastern Australia (Lat-37.857°, Long 145.321°). It was constructed in 2011 and has a surface area of 1800 m2, receiving stormwater from 5 ha of impervious surfaces, making up 15% of the total catchment area. Stormwater is filtered as it percolates down the 0.8 m deep filter media of the basin. The basin is densely planted with a mix of swamp grasses, sedges, reeds, rushes and shrubs. The basin's infiltrated water flows through the subsurface towards Dobsons Creek, a peri-urban stream ∼80 m downslope of the basin. The dominant trees upslope and downslope of the basin are mature Messmate (Eucalyptus obliqua) and Swamp Gum (Eucalyptus ovata), with a dense understory vegetation comprised of native shrubs and ferns.
2.2. Hydrometric monitoring
Rainfall depth was measured continuously using a Davis Instruments Tipping Bucket Rain Collector. Groundwater levels were monitored every 6 min using capacitance probes (Odyssey Capacitance Water Level recorder). Short periods of missing data due to battery failure were recorded. Probes were calibrated before and after deployment, with typical accuracy under field conditions of ±20 mm.
To monitor infiltrated stormwater and its interaction with the shallow water table, a network of monitoring bores was established in and around the basin (figure 1). A well within the infiltration basin (Basin) allowed water level measurement and water sampling. Downslope monitoring bores formed a transect 0 m (DS0), 7 m (DS7), 17 m (DS17) and 24 m (DS24) downslope (DS) from the edge of the basin. Several bores were also installed upslope of the basin, as a reference, unaffected by the basin, but remained dry, precluding water level monitoring or sampling for isotopic composition. Monitoring bores were 1.5–4 m deep and did not reach the full depth of underlying regolith, whose depth is not known, but soil coring to 5 m indicated very low hydraulic conductivity at this depth.
2.3. Isotope sample collection and analyses
The stable isotopes of water (2H and 18O) are well suited to trace the movement of water between storages or through its environs [21]. Water from the basin and its surroundings was therefore characterized using isotopic composition. Samples were collected from soil, surrounding trees (sapwood), rain, groundwater, and water within the filter media of the basin. Rainfall was sampled monthly over (1 June 2018–31 May 2019) in accordance with methods in the Global Network of Isotopes in Precipitation [22].
All water, soil, and plant samples were collected in 12 ml exetainer vials (Labco Limited, Product No. 737W). Water samples were filled completely to avoid air column whilst soil and plant samples were filled only up to ¾ of the vial following sampling protocols from the Global Institute for Water Security (GIWS). Sample vials were sealed immediately with parafilm to prevent leakage and evaporation. Duplicate samples were collected as part of the quality assurance and quality control procedure to assess the precision of field samples. The samples were transported to the laboratory in a cool box and stored at 4 °C before being shipped to the GIWS at the University of Saskatchewan, Canada, for 18O and 2H analysis, where all isotopic analysis occurred. The GIWS uses Los Gatos Research liquid and vapour water off-axis integrated-cavity output spectroscopy machines, with an accuracy of <±1.0‰ for δ2H and ±0.2‰ for δ18O. Isotopic compositions of are expressed in standard delta (δ) notation, in units of per-mille (‰), as the differences relative to Vienna Standard Mean Ocean Water [23].
Prior to groundwater sampling, each bore was pumped continuously to purge at least three casing-volumes of water. Samples were collected using a single-use syringe rinsed three times with sample water, filtered through a 45 µm syringe filter and stored in 12 ml exetainer vials. Samples were collected from the filter, bores DS0, DS7, DS17, DS24 and the rainfall collector.
Soil cores were collected from depths of 0.1 m, 0.3 m, 0.5 m, 0.7 m and 0.9 m from upslope and downslope of the basin. At each location, soil cores were taken around the base of the three trees instrumented with sap flow sensors, each tree representing a different size range (a) small (26–35 cm), (b) medium (36–45 cm), (c) Large (46–60 cm), which are representative of the composition of the forest. Individual trees within each category were selected randomly. Soil water was first extracted using Cryogenic Vacuum Extraction. All soil samples were weighed prior to extraction, samples (in vials) were frozen in liquid nitrogen for 20–25 s, and then evacuated down to 0.6 mbar. Extraction was conducted at 180 °C for 15 min. Post extraction, all samples were re-weighed and then placed in an oven for 24 h at 100 °C. Samples were then re-weighed and any weight loss was calculated for extraction efficiency. Soil water was then analysed for δ2H and δ18O.
Sapwood cores were collected at breast height from six trees upslope and six trees downslope of the basin. This included the three trees instrumented with sap flow sensors at each site, and an additional three individual trees at each site. The cores were initially collected using a 300 mm Haglof three threaded increment borer (more suited to softwood) and a core extractor. Subsequent cores were collected using an 11 mm hollow punch coring tool. Several cores were required to obtain a sufficient volume per tree. Water was extracted using cryogenic vacuum extraction following the same protocol as for soil samples. Plant water was then analysed for δ2H and δ18O.
2.4. Sap flow measurements
Two SFM1 sap flow sensors (ICT International) were installed on the north and south side of each of six trees (three upslope and three downslope) approximately 2–3 m from the ground. DBH of these trees were 30 cm (small), 42 cm (medium) and 53 cm (large) for the upslope trees, and 36 cm (small), 43 cm (medium) and 57 cm (large) for the downslope trees. Sap flow sensors utilized the heat ratio method [24] which calculates sap flux density (rate of movement of sap through the tree xylem, cm3 cm−2 h−1) from heat velocity (cm h−1). Heat velocity was calculated as the average ratio of temperature change between thermistors inserted in the tree xylem 5 mm above and below a central heater, following the emission of a heat pulse. To ascertain moisture content, sapwood was cored adjacent to the sensor and sapwood separated from the core by identifying the boundary between sapwood and heartwood with methyl orange dye. Sapwood was then weighed fresh, dried in an oven at 80 °C for three days and weighed dry. To correct for potential probe misalignment, climate data from a nearby Bureau of Meteorology climate station (Scoresby Station ID:086104) were filtered to identify conditions where sap flux density should equal zero [25] and data were linearly offset accordingly.
Due to failure of sensors installed on the north side of several trees, we used data from sensors installed on the south side of trees only. Periods of less than four hours with missing data were gap-filled using a linear interpolation. Days where at least one sensor had more than four hours of missing data were excluded. Two periods of missing sap flux data (August–September 2018 and April–May 2019) were due to failure of power supply to the sensor network. Daily sap flux density (JS) was calculated as the sum of hourly values. To compare the response of trees to seasonal changes in water availability, we further calculated a normalized sap flux as the proportion of maximum daily sap flux (JSmax) of each tree (JS /JSmax, %). Seasonal means were calculated for winter (June–August 2018), spring (September–November 2018), summer (December 2018–February 2019), and autumn (March–May 2019) to assess statistical differences among trees upslope and downslope from the basin in each season.
2.5. Data and statistical analyses
All statistical tests were conducted in MINITAB 17. To assess the effect of season and location on tree δ18O isotopes, sap flux, or normalized sap flux, both single and two-factor analyses of variance (ANOVA) were performed. Assumptions of normality were evaluated and determined to be satisfied after natural log transformation was applied to sap flux. To evaluate the nature of the differences between season and location for tree isotopes, statistically significant ANOVA was followed-up with Fisher's least significant difference (LSD) post-hoc tests at the 95% confidence interval. Despite a slight skew in the standardized residual plot for tree δ18O isotopes, Fisher's LSD results on raw data and square-root-transformed data were near-identical; we thus report only results based on the raw data.
3. Results
Figure 2 shows the weekly climatic conditions, and groundwater and sap flux responses for the study period. There is a clear seasonality in rainfall and potential evapotranspiration (PET). In winter, rainfall occurs every week and then becomes more variable over the summer (December–February), when about half the weeks have less than 5 mm, while several weeks have over 40 mm of rain. PET varies from around 0.5 mm d−1 in winter to nearly 10 mm d−1 at the peak in summer (December–February).
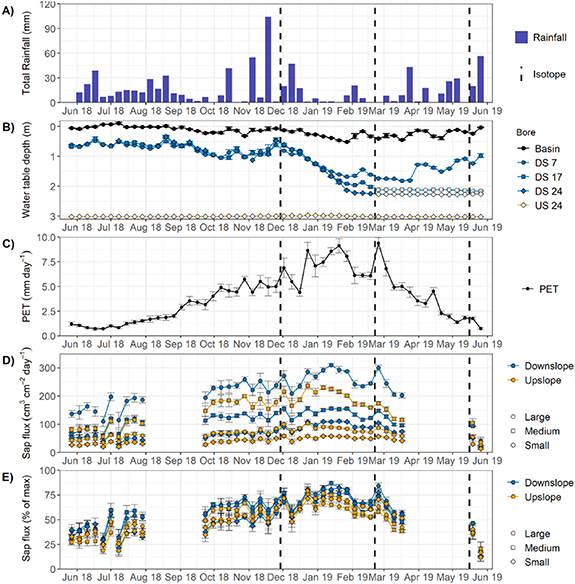
Figure 2. Weekly hydrometeorological conditions over the study period. (A) Total rainfall per week. (B) Mean depth to groundwater within and downslope (DS) of the infiltration basin per week. All bores upslope of the infiltration basin remained dry. Open circles indicate water levels below the sensor. (C) Mean potential evapotranspiration per week. (D) Mean daily sap flux measurements per week of a large, medium, and small tree upslope and downslope of the infiltration basin. (E) Mean daily sap flux per week normalized as a percentage of the maximum observed sap flux per tree. Error bars (B)–(E) show the standard error of mean daily values per week (n = 7).
Download figure:
Standard image High-resolution imageGroundwater tables were high during winter and early spring (June–September) and declined gradually over spring into early summer (December–January). A small response to December rainfall was followed by a rapid decline in water tables over summer (December–February) when PET rates were high. The water table in the monitoring bore 7 m downslope of the infiltration basin began to rise slowly in April, while water levels within the infiltration basin remained relatively high throughout the year, with only minor declines in summer (December–February), reflecting frequent stormwater inputs, driven by runoff from impervious areas even in small rainfall events.
Sap flux density (JS) tracked the seasonal PET pattern for all trees, but in a much-subdued manner. Weekly fluctuations in PET were reflected in JS. Over the study period, trees downslope of the infiltration basin had significantly (p = 0.03) higher JS (148 cm3 cm−2 d−1) than the upslope trees (93.6 cm3 cm−2 d−1). There is some evidence of decline in JS over January to March as the landscape dried, with most impact on the medium and large trees upslope of the infiltration basin.
Normalized sap flux per tree (figure 2(E)) differed significantly among seasons for all trees (p < 0.001). On average, normalized sap flux of the upslope trees (55%) was significantly less (p = 0.002) than that of downslope trees (63%). The exception was a short period (∼four weeks) in December 2018 where the normalized sap flux values were similar. This was a period when PET was high and soil water was likely still high, both upslope and downslope of the basin. In the prior three weeks period >170 mm of precipitation fell, with a further 80 mm during this period of similar normalized sap flow. Few other weeks exceeded 30 mm of precipitation. It was thus an unusual period of both high evaporative demand and water availability, both upslope and downslope of the infiltration basin.
Figure 3 shows stable isotope sample values for rainfall, soil water, tree water and groundwater. The global and Melbourne Meteoric Water Lines (MMWL) are also plotted. Note that the MMWL is for a site 30 km to the west of the study site and receives about 25% less rainfall. The rainfall samples plot above the MMWL, but within the observed scatter around (not shown) it. The isotopic signature of water in the filter was similar to rainfall.
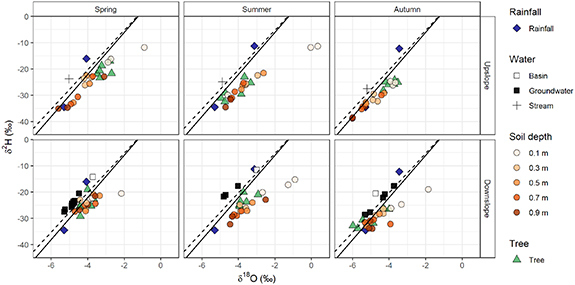
Figure 3. Isotope sample results for rainfall, soil water, tree water, and groundwater. The Melbourne Meteoric Water Line (dashed) and Global Meteoric Water Line (solid) are shown. Rows are for upslope and downslope sites respectively and Columns for different sampling occasions (spring, summer, autumn).
Download figure:
Standard image High-resolution imageGroundwater downslope of the infiltration basin was more depleted than rainfall, but still plots on or just above the MMWL. Soil water plots below the MMWL and showed an evaporation signature. There are differences in the soil water isotopic signature between the upslope and downslope sites. The shallow upslope samples tended to be more enriched than shallow downslope samples and deep samples were more depleted. Hence the downslope soil water samples tended to have a smaller range on each sampling occasion than did the upslope sites. Vegetation isotopic signatures differed between the upslope and downslope sites, but the differences change with sampling date.
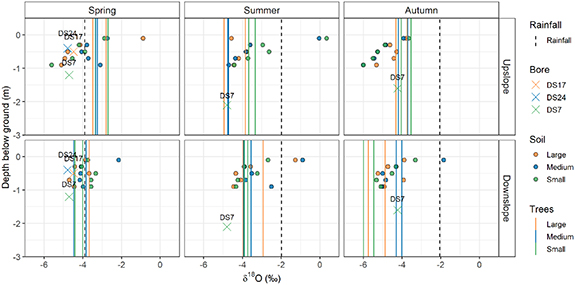
To further interpret the isotopic results and to examine the relationship between vegetation and soil water (and groundwater) isotopic samples, figure 4 plots soil water δ18O against depth, along with groundwater δ18O plotted at the depth to water table and rainfall δ18O plotted at the surface. Tree water δ18O is shown using vertical lines corresponding to the sap δ18O. Most of the time, a clear relationship between depth and soil water δ18O is evident. The exception is November 2018 for the downslope sites. Analysis of variance confirmed a statistically significant effect of both location and season on the isotopic composition of water within the trees (p < 0.001). The Fisher's LSD pairwise comparisons showed that tree isotopes differed significantly between the upslope and downslope sites during spring (November 2018) and autumn (May 2019), but not during summer (February 2019).
Figure 4. δ18O plotted against depth for upslope and downslope sites (rows) measured in spring, summer and autumn (columns). Soil samples (identified as being taken adjacent to the large, medium or small trees) are shown at the depth of sampling, groundwater samples are shown at depth-to-water table, rainfall samples are shown at zero depth and tree samples are shown as vertical lines. Colours allow tree sizes and corresponding soil samples to be identified. Soil samples were taken at trees instrumented with sap flow sensors (solid lines).
Download figure:
Standard image High-resolution image
Considering figures 3 and 4 together allows inference of the sources of water used by the trees. In November 2018 (spring), when the landscape was generally drying, upslope tree sap δ18O (−3 to −4‰) was very similar to shallow soil water (top 0.3 m of soil with −3 to −5‰), suggesting upslope trees were using shallow water. Downslope, however, while tree sap δ18O was around −4‰, there was little spread between rainfall, groundwater and soil water δ18O, and no clear relationship between soil water δ18O and depth, making it difficult to link downslope tree water use with a particular soil depth. Downslope tree water was less depleted than groundwater (δ18O = −5‰).
In February 2019 (summer), both upslope and downslope tree sap were more depleted than recent rainfall. Upslope tree sap δ18O was lower than in spring (September–November) and similar to or more depleted than δ18O of soil samples in the 0.5–1 m depth range, suggesting upslope trees were using deep water. Downslope tree sap δ18O (−3 to −4‰) was similar to shallower soil samples (at a depth of about 0.5 m), suggesting that downslope trees accessed water from shallower sources of water compared to upslope trees.
In May 2019 (autumn), following the extended dry period with PET exceeding rainfall, but with recent rain having occurred, upslope tree sap δ18O (−3.5 to −4.5‰) was very similar to shallow soil water (−4‰ at ∼0.1 m). Downslope trees, in contrast, had their sap δ18O (−4 to −6‰) consistent with the deeper layers of soil water (−4 to −5.5‰ at 0.5–1 m), and, in some cases, even more depleted than any of the sources sampled here. This suggests that upslope trees were using shallow water while downslope trees were using deeper water in autumn (March–May).
4. Discussion
4.1. Influence of infiltration basin on depth of water use by trees
This study revealed a significant impact of stormwater from a constructed infiltration basin on downstream water fluxes and on the water use of downstream vegetation. The trees upslope from the basin used shallow soil water during spring (November) 2018, following recent substantial rainfall and when the landscape was starting to dry. However, these trees moved to using deep soil water in February 2019 under dry conditions, before demonstrating a use of shallow soil water in May 2019, following a strong decline in PET and recent autumn (March–June) rainfalls (i.e. reduced water demand).
The downslope tree water use follows a distinctly different pattern. In spring (September–November), the depth of water use is unclear because there is little vertical change in isotopic composition. In February 2019, during much drier conditions, upslope trees are clearly accessing deeper water than downslope trees and upslope trees are accessing water at about 0.5 m. In May 2019, as water use reduces, the downslope trees use deeper water while upslope trees have changed back to using shallower water. A critical difference here is that the water table has started to rise downslope, suggesting water was likely more available at depth than at the surface, despite recent rain.
Together, these data suggest the trees are using the most available water under drier conditions. Both upslope and downslope of the basin, the residual deeper water is being used in February 2019's dry conditions. Recently replenished shallow soil water is used at the upslope site in the wetter May 2019 period, while lateral flow replenishing the water table from the infiltration basin provides water for use by downslope trees. Vertical water fluxes (i.e. from direct rainfall) are sufficient to explain the upslope behaviour, but lateral flow (i.e. water from the infiltration basin) is required to explain the downslope behaviour characterized by higher observed sap flux per tree.
In terms of lateral movement of water, the isotopic signatures in the soil water also provide evidence of different behaviour upslope and downslope of the basin. There are clearer relationships with depth at the upslope sites and the isotopic signature is more depleted upslope. At the end of the cool, wet season, after significant periods of high water table, the relationship between isotopic composition and depth has been obliterated downslope of the basin and is close to the basin's isotopic composition. This is most likely due to lateral flow of water from the infiltration basin overprinting the locally (i.e. direct rainfall) infiltrated water during the high water table period through winter–spring (June–November) of 2018.
4.2. Infiltration increases downslope tree transpiration
The infiltration basin allowed downslope vegetation to continue using shallow soil water during times when upslope soil water had become limiting. This is evidenced by contrasting water use by trees upslope and downslope of the basin. The sap flux data shows upslope trees are using less water (figure 2(D)) and, when normalized by the maximum observed sap flux per tree (figure 2(E)), the temporal pattern also suggests that low water availability likely controls tree water use for long periods at the upslope sites. This is evident both through winter when water tables were deep at the upslope sites and shallow downslope, and in summer–autumn (December–May) when water tables deepened, but were still present downslope of the basin (figure 2(B)). Together with the isotope data, this suggests that trees use water from deeper layers in the profile downslope of the basin (figure 4), confirming that the trees are accessing significantly more water due to lateral contributions from the infiltration basin.
4.3. Implications for the use of stormwater infiltration
Overall, these results paint a picture of both the infiltration basin being a significant source of water for lateral flow and the trees being a significant sink of water coming from the basin, particularly in summer (December–February). Water from the infiltration basin supports higher transpiration by downslope vegetation than would otherwise have occurred, thereby contributing to the maintenance of urban vegetation in a water-limited environment [26]. While this was not an objective in the original infiltration basin site selection, it nevertheless suggests that infiltration remote from streams could contribute significantly to such an objective, with subsequent benefits in terms of provision of shade [27], amelioration of the urban heat island [28] and the range of other social and psychological benefits provided by urban vegetation [29].
Conversely if the purpose of the infiltration basin were to contribute to stream baseflows, the hydrologic, isotopic and tree physiological evidence presented in this study suggests that the influence of vegetation will likely impede that objective, drawing on subsurface water originating from the infiltration basin. Indeed, water use of mature trees can be very large in such situations, where water availability is non-limiting. Tree water use will be substantially greater than the water use of grass or other low-level vegetation [30]. In this context, siting stormwater infiltration closer to the receiving stream, or where there were relatively few trees between the infiltration basin and the stream, would be more effective, at the expense of the broader landscape-scale and urban amenity benefits.
5. Conclusion
The fate of infiltrated water from stormwater infiltration systems is either ignored or simplistically assumed to contribute to recharge and subsequent baseflow. This work shows that in areas with low permeability, surrounding deep-rooted vegetation such as trees, can play a significant role in the water balance. It suggests that infiltration water balance models should account for evapotranspiration fluxes, with implications also for models which may then look at contributions to groundwater recharge, and for models that consider impacts of evapotranspiration on the local microclimate.
This work has important implications for the siting and design of stormwater infiltration systems. We contend that there is merit in designing such systems as broader infiltration precincts, deliberately considering the role and benefits of surrounding vegetation. These precincts will have other important community benefits, such as provision of well-watered greenspace, supporting attempts to mitigate the urban heat island and increase urban biodiversity.
Acknowledgments
This project was funded by the Australian Research Council Discovery Program (DP170102870). In a previous role, Fletcher received payment for his contribution to the engineering design of the Wicks Reserve Infiltration System. We benefited from the early advice and ongoing support of Jeffrey J McDonnell (University of Saskatchewan). The authors would also like to sincerely thank our late colleague, Justin Costelloe, for his contributions to the early stages of this project. This paper benefited substantially from the suggestions from three anonymous reviewers and the Editor.
Data availability statement
The data that support the findings of this study are openly available at the following URL/DOI: https://osf.io/4hysc/.