

Abstract
Achieving climate neutrality in the European Union (EU) by 2050 will require substantial efforts across all economic sectors, including agriculture. At the same time, an ambitious unilateral EU agricultural mitigation policy is likely to have adverse effects on the sector and may have limited efficiency at global scale due to emission leakage to non-EU regions. To analyse the competitiveness of the EU's agricultural sector and potential non-CO2 emission leakage conditional on mitigation efforts outside the EU, we apply three economic agricultural sector models. We find that an ambitious unilateral EU mitigation policy in line with efforts needed to achieve the 1.5 °C target globally strongly affects EU ruminant production and trade balance. However, since EU farmers rank among the most greenhouse gas efficient producers worldwide, if the rest of the world were to start pursuing agricultural mitigation efforts too, economic impacts of an ambitious domestic mitigation policy get buffered and EU livestock producers could even start to benefit from a globally coordinated mitigation policy.
Export citation and abstract BibTeX RIS

Original content from this work may be used under the terms of the Creative Commons Attribution 4.0 license. Any further distribution of this work must maintain attribution to the author(s) and the title of the work, journal citation and DOI.
1. Introduction
'Holding the increase in the global average temperature to well below 2 °C above pre-industrial levels and pursuing efforts to limit the temperature increase to 1.5 °C' as set out in the Paris Agreement, is one of the key goals of the European Commission (EC 2018). To achieve the 1.5 °C target, transformational reductions in greenhouse gas (GHG) emissions across all anthropogenic sources, as well as deployment of negative emission technologies, are required at unprecedented speed across world regions (IPCC 2018). Several countries have put forward national mitigation targets in their nationally determined contributions to the United Nations Framework Convention on Climate Change (UNFCCC). For example, Japan 'strives to achieve 'decarbonized society' as close as possible to 2050' 6 , New Zealand pledged to 'reduce net emissions of greenhouse gases (other than biogenic methane) to zero by 2050' 7 , and China aims 'to have CO2 emissions peak before 2030 and achieve carbon neutrality before 2060' 8 . Similarly, the European Union (EU) put forward in its Long Term Strategy (EC 2018) a plan to achieve climate neutrality by 2050 which was recently complemented by the Climate Target Plan (EC 2020b) that proposed increasing the 2030 EU emission reduction target from currently 40% (EC 2014) to at least 55% compared to 1990.
Achieving climate neutrality in the EU by 2050 will require substantial efforts across all economic sectors, including the EU agricultural sector which given its complex interactions with many, sometimes competing, policy objectives will face multiple challenges. While agriculture is anticipated to contribute to EU wide mitigation efforts through increased supply of energy crops for bioenergy and reduction of direct GHG emissions, in particular methane and nitrous oxides (EC 2018), the sector is also expected to sustain food production and nutrition security, advance towards more sustainable production systems, and decrease impact on biodiversity (EC 2020a).
Incentives to reduce agricultural GHG emissions will affect farmers' decisions and depending on the policy instrument and the overall ambition for the sector, impacts on farmers and markets may be smaller or larger (Grosjean et al 2018). For example, reduction in fertilizer application as suggested in the Farm to Fork Strategy (EC 2020a) may directly impact crop yields and production levels but also the adoption of mitigation technologies may increase costs (if not compensated for) resulting in an upward shift of the supply curve thereby decreasing overall production levels and increasing prices. Since agricultural markets are connected through international trade, unilateral EU mitigation policies may affect market and trade balances, thereby impacting other regions outside Europe. For example, the EU is a key exporter of pig and poultry meat, milk and cereals and importer of oil crops and vegetable oils, and consequently any change in domestic production and consumption levels will affect trade partners.
Even though the EU's agricultural sector is amongst the most GHG efficient ones worldwide (figure 1), a unilateral EU mitigation policy has been shown to have adverse effects on the sector and emission leakage could decrease overall efficiency of a unilateral EU mitigation policy at global scale (Frank et al 2015, Fellmann et al 2018, Himics et al 2018, Jansson et al 2020). Emission leakage in the context of this paper refers to the potential reallocation of agricultural production to regions outside the EU with less stringent emission regulations following the implementation of EU agricultural mitigation policies. This could potentially result in higher global total emissions. However, emission leakage is not an issue related only to EU policies, but in fact may reduce GHG efficiency of any regional or sectorial policies without comprehensive coverage (Golub et al 2013, Popp et al 2014, Frank et al 2017). Previous EU focused studies estimated that emission leakage related to EU agricultural mitigation policies could diminish the global effect of domestic emission reduction efforts by up to 35% (Frank et al 2015, Pérez-Domínguez and Fellmann 2015, Pérez Domínguez et al 2016, Himics et al 2020), and even higher when anticipating trade liberalization (Himics et al 2018).
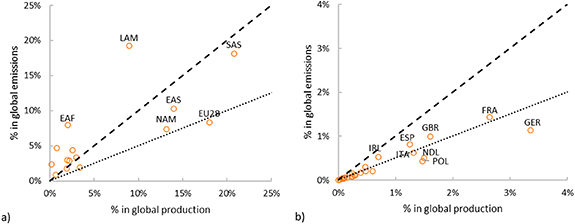
Figure 1. Regional livestock production and emission shares in global totals across world regions (a) and EU member states (b). Data is based on FAOSTAT for non-CO2 livestock emissions (enteric fermentation, manure management, manure applied and dropped) and production (beef, pig, poultry, milk, eggs) for the year 2017. Dashed line represents a 1:1 ratio, dotted line a 1:2 ratio of emission to production shares.
Download figure:
Standard image High-resolution imageYet these studies did not consider the impact of agricultural mitigation efforts outside of the EU on emission leakage rates and EU markets. This, however, can be an important to determine the impact of EU mitigation efforts on EU farmers. Several countries already included agriculture in their economy-wide mitigation target and pledged in their Nationally Determined Contributions to increase agricultural mitigation efforts. Yet very few adopted market-based instruments such as New Zealand which aims to reduce agricultural CH4 emissions by 10% (below 2017 level) in 2030 implementing a carbon price as off 2025 (Ben Henderson et al 2020, Leahy et al 2020). However, if in the future ambitious agricultural mitigation action is expanded to other regions in the rest of the world (ROW), EU farmers could potentially even benefit given their high GHG efficiency and thus, increase exports to regions that produce currently with high GHG intensity.
In this paper we extend recent literature by analysing the competitiveness of the EU's agricultural sector under stringent mitigation efforts and potential non-CO2 emission leakage inside and outside the EU conditional on different levels of mitigation ambition in the ROW. We apply a model ensemble of three agricultural sector models with global coverage and detailed representation of the EU which reduces the inherent uncertainty of single model projections by providing a range of plausible outcomes. Using two partial equilibrium and one general equilibrium model focused on the EU, allows to capture both sectoral impacts as well as economy wide spillover effects in detail and to provide a more robust estimates as compared to single model studies. The modelling suite has a comprehensive representation of EU agriculture mitigation technologies covering technical and structural options on the supply side as well as changes in activity levels in response to price changes (Frank et al 2019). Combined with the global coverage and trade representation this enables the models to explore the likely emission leakage for certain products and regions conditional on climate mitigation action outside the EU. First, we assess the impact of unilateral EU non-CO2 mitigation efforts in the agricultural sector on agricultural markets, commodities, and non-CO2 emissions in- and outside the EU. Then we quantify different levels of mitigation action outside Europe in combination with ambitious EU agricultural mitigation efforts.
2. Methods
The economic models applied in this study consist of two global partial equilibrium models (Common Agricultural Policy Regionalised Impact (CAPRI), Global Biosphere Management Model (GLOBIOM)) and one general equilibrium model (Modular Applied General Equilibrium Tool (MAGNET)). Table 1 provides an overview of main model characteristics followed by a brief description of each of the models applied.
Table 1. Differences in methods and hypothesis drivers across models.
| CAPRI | GLOBIOM | MAGNET | |
|---|---|---|---|
| Model type | Partial equilibrium | Partial equilibrium | Computable general equilibrium |
| Trade representation | Armington spatial equilibrium, heterogenous goods | Takayama-Judge spatial equilibrium, homogenous goods | Armington spatial equilibrium, heterogenous goods |
| Demand side representation | Explicit price and cross-price elasticities, income elasticities | Explicit price elasticities, income elasticities | Explicit price and income elasticities |
| Supply side representation | NUTS2 level non-linear programming models in the EU. Linear system of supply functions in the ROW | Spatially explicit Leontief production systems covering alternative production systems | Regional/country level multilevel nested constant elasticity of substitution production technology |
| Land representation | Explicit link to agri. activities and land use transition matrix in the EU, land supply and demand functions in the ROW, allocated to products | Explicit link to agri. and forestry activities and land use transition matrix | Land supply function and multilevel nested constant elasticity of transformation land allocation function. |
| Agricultural emissions | Product specific emission factors globally, consistent with activity-based accounting in EU, dynamic over time aligned to historic trends | Spatially explicit emission factors for the different production systems, dynamic over time aligned to historic trends | Product and region-specific emission factors (Baseyear, GTAP CO2 and non-CO2 database). Dynamic over time. |
| Mitigation options | Technical options; Structural options—changes in the composition of NUTS2 activity levels, feed mix or product mix; international trade; Changes in activity levels; | Technical options; Structural options—transition between different crop- and livestock management systems, composition of NUTS2 activity level or product mix; international trade; Changes in activity levels; | Technical options represented by marginal abatement cost curves driven by CO2 prices; Structural options—changes in composition of regional activity levels or product mix; international trade; Changes in activity levels; |
2.1. CAPRI
The CAPRI modelling system is a comparative-static partial equilibrium model for the agricultural sector developed for policy and market impact assessments from global to regional and farm type scale (Britz and Witzke 2012). The core of CAPRI is based on the linkage of a European-focused supply module and a global market module. The regional supply module consists of independent aggregate non-linear programming models combining a Leontief-technology for variable costs of the different production activities with a non-linear cost function which captures the effects of labour and capital on farmers' decisions. Each programming module optimizes income under constraints related to land availability, nutrient balances for cropping and animal activities, and policy restrictions. Prices are exogenous to the supply module and provided by the market module. The global market module is a spatial, non-stochastic global multi-commodity model for about 60 primary and processed agricultural products, covering about 80 countries in 40 trading blocks. It is defined by a system of behavioural equations representing agricultural supply, human and feed consumption, multilateral trade relations, feed energy and land as inputs, and the processing industry; all differentiated by commodity and geographical units. Agricultural land types of temporary and permanent cropland as well as fodder areas (i.e. fodder on arable land, as well as grass and grazing) have different land rental prices and land owners are responding to these rental prices according to a multinomial logit land supply system in the model version used in this study. Land types are allocated to single activities using yield elasticities to disaggregate the total supply response into contributions from yields and from areas. The shares of broad land types in the country area respond to rents in a multinomial logit system. Bilateral trade and attached prices are modelled based on the Armington approach. CAPRI endogenously calculates EU agricultural emissions for nitrous oxide and methane based on the inputs and outputs of production activities, taking specific technical GHG mitigation options into account. GHG emissions for the ROW are estimated on a commodity basis in the CAPRI market model (Pérez Domínguez et al 2016, 2020, Fellmann et al 2018).
2.2. GLOBIOM
The GLOBIOM (Havlík et al 2014) is a partial equilibrium model that covers the global agricultural and forestry sectors, including the bioenergy sector. Commodity markets and international trade are represented at the level of 58 economic regions (including EU28 individual member states) in the model version applied in this study (Frank et al 2015). Prices are endogenously determined at the regional level to establish market equilibrium to reconcile demand, domestic supply and international trade. For crops, livestock, and forest products, spatially explicit Leontief production functions covering alternative production systems are parameterized using biophysical models like Environmental Policy Integrated Model (Williams 1995), Global Forest Model (Kindermann et al 2008, Gusti 2010), or the RUMINANT model (Herrero et al 2013). For the EU, the model represents eight different livestock production systems, three tillage systems as well as alternative crop rotations for the EU (Frank et al 2015). For the present study, the supply side spatial resolution was aggregated to 2° (about 200 × 200 km at the equator) and Nomenclature of Territorial Units for Statistics (NUTS2) level for the EU. Land and other resources are allocated to the different production and processing activities to maximize a social welfare function which consists of the sum of producer and consumer surplus. The model includes six land cover types: cropland, grassland, short rotation plantations, managed forests, unmanaged forests, and other natural vegetation land. Depending on the relative profitability of primary, by-, and final products, the model allocates production activities and can switch from one land cover type to another. Spatially explicit land conversion over the simulation period is endogenously determined within the available land resources and conversion costs that is considered in the producer optimization behaviour. Land conversion possibilities are further restricted through biophysical land suitability and production potentials, and through a matrix of potential land cover transitions. GLOBIOM covers major GHG emissions (CO2, N2O, and CH4) from agricultural production, forestry, and other land use and different mitigation options for the land use sector. Detailed information on the parameterization of the different mitigation options for the agricultural sector is provided in Frank et al (2018). More information on the GLOBIOM can be accessed at https://iiasa.github.io/GLOBIOM/.
2.3. MAGNET
The MAGNET model is a multi-regional, multi-sectoral, applied general equilibrium model based on neo-classical microeconomic theory (Nowicki et al 2009, Woltjer and Kuiper 2014). It is an extended version of the standard Global Trade Analysis Project (GTAP) model (Hertel 1997). The core of MAGNET is an input–output model, which links industries in value added chains from primary goods, over continuously higher stages of intermediate processing, to the final assembly of goods and services for consumption. Primary production factors are employed within each economic region, and hence returns to land and capital are endogenously determined at equilibrium, i.e. the aggregate supply of each factor equals its demand. On the consumption side, the regional household is assumed to distribute income across savings and (government and private) consumption expenditures according to fixed budget shares. Private consumption expenditures are allocated across commodities according to a non-homothetic constant difference of elasticities (CDE) demand system and the government consumption according to Cobb-Douglas expenditure function.
The MAGNET model, in comparison to GTAP, uses a more general multilevel sector specific nested constant elasticity of substitution production function, allowing for substitution between primary production factors (land, labour, capital and natural resources) and intermediate production factors and for substitution between different intermediate input components (e.g. energy sources and animal feed components). MAGNET includes an improved treatment of agricultural sectors trying to better approximate physical constraints in the CGE context (like various imperfectly substitutable types of land, the land use allocation structure, a land supply function, substitution between various animal feed components (van Meijl et al 2006), agricultural policy (such as production quotas) and different land related payments (Nowicki et al 2009), and biofuel policy (capital-energy substitution, fossil fuels-biofuels substitution (Banse et al 2011). On the consumption side, a dynamic CDE expenditure function is implemented which allows for changes in income elasticities when purchasing power parity-corrected real gross domestic product (GDP) per capita changes. Segmentation and imperfect mobility between agriculture and non-agriculture labour and capital are introduced in the modelling of factors markets.
The model also incorporates emissions from the latest GTAP non-CO2 database (Irfanoglu and van der Mensbrugghe 2015), including methane (CH4) and nitrous oxide (N2O). This is complemented by CO2 emissions from the GTAP Energy-Environmental database (GTAP-E). Livestock non-CO2 emissions and Rice CH4 emissions are tied to the output variables of these respective sectors within the MAGNET model. Whereas N2O emissions from crop fertiliser use are tied to the fertiliser input variable in these sectors. In addition, data on the marginal abatement costs associated with practices and technologies that can be used to reduce GHG emissions are also incorporated (Henderson et al 2019) based on the US EPA (2013). They cover measures for lowering the main non-CO2 emission sources including methane from enteric fermentation by ruminants (i.e. cattle, sheep and goats), nitrous oxide and methane from livestock manure, methane emissions from paddy rice and nitrous oxide emissions from soil associated with fertiliser use by crops.
3. Scenario development
The baseline scenario represents a business-as-usual scenario for the EU and global agricultural sector without agricultural mitigation efforts. CAPRI and GLOBIOM use the macro-economic (EC 2016) and bioenergy projections of the EU Long Term Strategy (EC 2018) in their EU baseline while MAGNET uses the Shared Socio-economic Pathway 2 based on current policies without more tight environmental policies in the future Shared Socioeconomic Pathway (SSP2) (O'Neill et al 2014, Fricko et al 2016). Outside the EU, all models use their specific interpretation of SSP2 giving rise to some differences. Nonetheless the baseline scenario represents a scenario with continuation of current trends and medium challenges for mitigation and adaptation and is described and analysed in detail also in Bogonos et al (2020).
To assess the potential leakage effects and the efficiency with respect to emission savings if EU pursued alone or only partly followed by other countries the 1.5 °C efforts, we quantified several GHG mitigation scenarios. To emulate the potential contribution of EU agriculture to the 1.5 °C climate change mitigation target, a carbon price trajectory on non-CO2 (CH4 and N2O) emission from agriculture was implemented in the models corresponding to a 1.5 °C climate stabilization pathway based on Rogelj et al (2018). The carbon price starts at 10 USD tCO2eq−1 in 2030 and increases to 85 USD tCO2eq−1 in 2040, and 245 USD tCO2eq−1 in 2050. While the EU is assumed to pursue 1.5 °C compatible mitigation efforts emulated via the carbon price across all mitigation scenarios, mitigation efforts are varied in other regions outside the EU.
We quantify several levels of agricultural mitigation action taken outside the EU ranging from 0% effort taken in the ROW in the '00% buy-in' scenario up to 100% effort—'full buy-in' scenario which corresponds to achieving the 1.5 °C target at global scale. For example, 50% effort taken outside the EU meaning that only 50% of the carbon price needed to achieve the 1.5 °C target is implemented in the models in the ROW. Table 2 describes the scenario set-up and acronyms. In a sensitivity analysis, we explore the effects of a fragmentation of international trade by assuming a doubling of agricultural tariffs by 2030.
Table 2. Scenario matrix for the climate change mitigation assessment.
| Scenario name | EU mitigation effort | ROW mitigation effort |
|---|---|---|
| Baseline | No CC mitigation | No CC mitigation |
| 00% buy-in | 1.5 °C compatible—100% effort | No CC mitigation |
| 05% buy-in | 1.5 °C compatible—100% effort | 5% effort |
| 10% buy-in | 1.5 °C compatible—100% effort | 10% effort |
| 25% buy-in | 1.5 °C compatible—100% effort | 25% effort |
| 50% buy-in | 1.5 °C compatible—100% effort | 50% effort |
| 75% buy-in | 1.5 °C compatible—100% effort | 75% effort |
| Full buy-in | 1.5 °C compatible—100% effort | 100% effort |
The carbon price is implemented in the objective function of each model as a tax on agricultural non-CO2 emissions and incentivizes the uptake of emission reduction options (structural and technical options as well as changes in activity levels) as otherwise a cost per ton non-CO2 emitted needs to be paid (Frank et al 2019). Mitigation options are taken up as long as the economic benefits (avoided carbon price payments) outweigh the costs of adoption. While we refer to structural mitigation effects as more fundamental changes on the supply side including adjustment in international trade or changes in product composition or production system (Havlík et al 2014, Frank et al 2018), technical options refer to the uptake of mitigation technologies such as anaerobic digesters, feed supplements or nitrogen inhibitors (Beach et al 2015, Winiwarter et al 2018, Höglund-Isaksson et al 2020). The model represents also changes in activity levels in response to market prices.
4. Results
4.1. EU agricultural emissions outlook
In the baseline scenario, EU agricultural non-CO2 emissions (CH4 from enteric fermentation, manure management and rice cultivation, N2O from manure management, manure applied and dropped on soils, synthetic fertilizers and crop residues) are projected to remain rather stable until 2050 in CAPRI and GLOBIOM, whereas in MAGNET an increase past 2030 is observed related to methane emissions associated to ruminant beef production driven by increasing exports. By 2050, agricultural non-CO2 emissions are projected to range from around 400–420 MtCO2eq yr−1 (GLOBIOM, CAPRI) up to 460 MtCO2eq yr−1 (MAGNET) with the livestock sector accounting for around 80% (75% of which CH4 and 25% N2O) and crops for around 20% (95% of which N2O and 5% CH4) of the total emissions (figure 2) which is consistent with current shares reported by Food and Agriculture Organization Corporate Statistical Database (FAOSTAT) and UNFCCC. CAPRI and GLOBIOM are well in line with FAOSTAT and GAINS projections that both anticipate a decline of EU agricultural non-CO2 emissions to around 400 MtCO2eq yr−1 by 2050 (EC 2018).

Figure 2. Development of (a) agricultural non-CO2 emissions in the baseline scenario across models over time. Difference in emissions 2050–2010 (b) by product and (c) by driver. Non-CO2 emissions have been converted to CO2eq using global warming potentials from IPCC AR4 and scaled to FAOSTAT data in 2010. EN2O—nitrous oxide emissions from synthetic fertilizers, crop residues, manure applied and dropped to soils, and manure management, ECH4—methane emissions from enteric fermentation, manure management and rice cultivation. EMIS—total N2O and CH4 emissions. DRY—dairy milk, RUM—ruminant beef, NRM—non-ruminant meat and eggs, CGR—coarse grains, WHT—wheat, OSD—oilseeds, OCR—other crops. CRP—crops, LSP—livestock, PROD—change in production, EF—change in emission factor.
Download figure:
Standard image High-resolution imageEmissions developments are related to underlying projections in activity data and changes in emission intensity. For ruminant meat, a decline of around 7% in EU production is projected in CAPRI and GLOBIOM by 2050 following the continued decrease in domestic demand, whereas MAGNET projects +31% production growth by 2050 as compared to 2010. MAGNET results are mainly driven by exports to the ROW (mostly to African countries) caused by huge increase in demand outside the EU driven by population and substantial income growth in an SSP2 world without tighter environmental policies in the future. Production of milk (+9% to +28%), pig and poultry meat (+7% to +20%) is expected to grow across all models driven by increasing domestic and international demand. Since these changes in production levels are accompanied by increasing GHG efficiencies, net impacts on emissions are compensated and sometimes even offset. GHG efficiency increases for dairy in CAPRI (+18% milk, −7% beef) and GLOBIOM (+11% milk, +19% beef) result in an overall stabilization of livestock related non-CO2 emissions in these models despite the decrease in beef efficiency in CAPRI whereas livestock GHG efficiencies in MAGNET remain rather stable (−1% milk, +1% beef) as no carbon prices or other environmental constraints are implemented in the SSP2 scenario over time thus resulting in an increase in livestock emissions by 19% (figure 2(c)). GHG efficiencies related to crop production increase in CAPRI and GLOBIOM by around 11%–15% up to 32% in MAGNET causing on average across models a 11% decline of crop related N2O emissions by 2050 despite increases in EU production levels.
4.2. Impacts of a unilateral EU mitigation policy
To assess the impacts of a unilateral EU mitigation policy (00% buy-in scenario) where only the EU pursues ambitious agricultural mitigation efforts (carbon price of 245 USD tCO2eq−1 by 2050) compatible with the 1.5 °C target, we compare scenario results to the baseline scenario without mitigation efforts. This allows us to quantify the impacts in- and outside the EU and potential emission leakage effects to other world regions. The 00% buy-in scenario results on average across models in domestic EU agricultural non-CO2 emission reduction of 155 MtCO2eq yr−1 (−36%) compared to the baseline scenario in 2050. Across models, GLOBIOM shows the lowest EU non-CO2 emission savings (130 MtCO2eq yr−1, −32%), while CAPRI (165 MtCO2eq yr−1, −39%) and MAGNET (170 MtCO2eq yr−1, −37%) anticipate higher absolute agricultural GHG abatement (figure 3). The presented mitigation potentials are slightly more optimistic than results from the GAINS model as presented in the EU's Long Term Strategy (EC 2018), which show a mitigation potential of around 130 MtCO2eq yr−1 (−33%) from the adoption of technological options. This difference can be explained by the consideration of price feedbacks (of carbon pricing) on activity levels in the agricultural sector models as well as the different parameterization of technical mitigation options and in case of MAGNET with different baseline assumptions. All models applied in this study anticipate the highest abatement potential being realized in the livestock sector, which contributes on average 140 MtCO2eq yr−1 (90% of total GHG abatement) in 2050, mainly through ruminants (beef and milk contribute 75% of the total) while crops are estimated to have more limited emission reduction potentials.

Figure 3. Agricultural non-CO2 mitigation potentials in the EU across models and by (a) commodity group, (b) GHG source, and (c) mitigation wedge under an EU unilateral mitigation policy and 00% buy-in scenario. CGR—coarse grains, WHT—wheat, OSD—oilseeds, SGC—sugar crops, OCR—other crops, DRY—milk, RUM—ruminant beef, NRM—non-ruminant meat and eggs. CRP—crops, LSP—livestock, EN2O—N2O emissions, ECH4—CH4 emissions. TECH—technological mitigation options, STRC—structural mitigation options, PROD—activity level adjustment.
Download figure:
Standard image High-resolution imageAcross gases, the models project the highest mitigation coming from methane which provides around 65% of the total GHG abatement. This is more optimistic as compared to GAINS projections (EC 2018) which expects only around 40% of the total non-CO2 mitigation potential reduction to come from CH4. With respect to the mitigation option portfolio, technological options such as anaerobic digesters, feed supplements or precision farming, are identified across models as a key technology for non-CO2 savings, followed by changes in livestock production levels while structural options such as intensification in production systems, seem to be of more limited relevance for the EU.
The unilateral EU mitigation efforts adopted in the 00% buy-in scenario yield smaller emission savings at the global scale as compared to the EU internal mitigation effect. The reason is that domestic EU emission savings are partly compensated by additional emissions outside Europe as part of the EU production is reallocated to regions outside Europe. At the global scale emission leakage decreases domestic EU emissions savings on average by 40% across models. Hence, the 00% buy-in scenario achieves only average emissions savings of around 90 MtCO2eq yr−1 at global scale (75–100 MtCO2eq yr−1 across models).
Regional production reallocation and leakage effects in response to the unilateral mitigation policy vary across models (figure 4). Emission leakage is highest in MAGNET (56%) while it is more moderate in CAPRI (39%) and GLOBIOM (27%). Across models, emission leakage mostly occurs for beef while EU dairy related emission reductions are not compensated by increasing emissions in the ROW (except for some increase in Africa according to GLOBIOM). Differences in leakage rates can be mainly explained by different baseline trends. Since the EU is a large net beef exporter in MAGNET in the baseline scenario as compared to more modest net beef exports in CAPRI and GLOBIOM, this allows for higher substitution of EU beef exports and reallocation of domestic production to other world regions under a unilateral EU mitigation policy resulting in higher emission leakage.
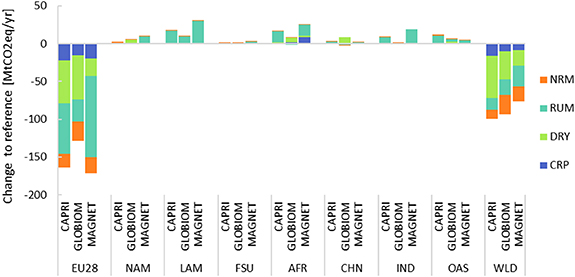
Figure 4. Change in agricultural GHG emissions in MtCO2eq yr−1 in the 00% buy in scenario in 2050 compared to the baseline scenario. EU28—European Union, NAM—North America, LAM—Central and South America, FSU—Former Soviet Union countries, AFR—Africa and Middle East, CHN—China, IND—India, OAS—Other Asia including Oceania, WLD—World. NRM—non ruminant meat and eggs, RUM—ruminant meat, DRY—milk, CRP—crops.
Download figure:
Standard image High-resolution imageFor beef, the models anticipate a stronger increase in emissions in Latin America induced by increasing exports to the EU and Africa induced by decreasing imports from the EU and limited emission leakage to regions like North America and Other Asia including Oceania with GHG efficient production systems. Results are in line with current trade patterns where Latin America is the main exporter of beef to the EU while around 25% of EU beef exports are currently exported to African countries (according to FAOSTAT). Across models, a fragmentation of international trade (doubling of tariffs) is found to decrease emission leakage and sustain higher emission savings of 85–110 MtCO2eq yr−1 at global scale.
As production costs of GHG intensive products increase for EU farmers and consequently beef production decreases on average by −20% in response to the unilateral EU mitigation policy (−18% to −24% across models), farmers in the ROW benefit. They become relatively more competitive compared to the EU since they are not targeted by the mitigation policy and increase their production to compensate for the drop in the EU. Consequently, EU is becoming a net beef importer, 40% of it coming from Latin America.
4.3. Impacts of ROW mitigation efforts on the EU and outside
Having quantified potential leakage effects in response to a unilateral EU agricultural mitigation policy, we now assess the impact of ROW mitigation efforts on EU farmers while the EU continues to pursue ambitious mitigation efforts. Figure 5 presents the economic impact (supply, prices, and production value) on EU producers with increasing ROW mitigation efforts (figures S2 and S3 available online at stacks.iop.org/ERL/16/104038/mmedia in the supplementary material provide additional details). ROW mitigation efforts are found to ease the impacts of a unilateral EU mitigation policy on EU farmers. Without any mitigation efforts in ROW in the 00% buy-in scenario, the models anticipate on average a strong decline for beef production (−20%), whereas impacts on oilseeds (−14%), coarse grains (−13%), wheat (−12%), milk (−9%) and non-ruminant production (−6%) are less pronounced. Agricultural prices increase in response to the carbon price, but so do production costs. Furthermore, the reduced production quantities are reflected in a lower production value across commodities as compared to the baseline scenario without mitigation efforts in 2050. This indicates that farmers will experience economic losses in response to the unilateral EU mitigation policy.
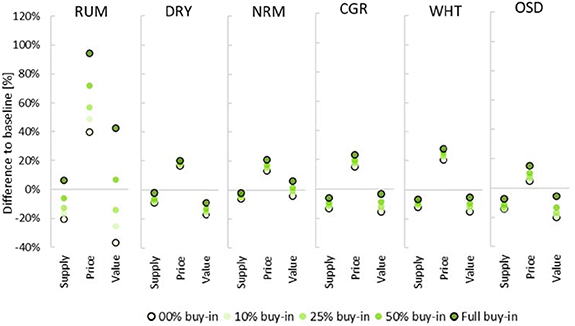
Figure 5. Average impact across models of different levels of ROW mitigation ambition on EU agricultural production, prices and production value corrected for carbon tax payments in 2050. RUM—ruminant beef, DRY—milk, NRM—non-ruminant meat and eggs, CGR—coarse grains, WHT—wheat, and OSD—oilseeds.
Download figure:
Standard image High-resolution imageHowever, once the ROW starts to pursue agricultural mitigation efforts next to the EU, European farmers are less affected as they can produce more GHG efficient food compared to other ROW regions (figure 6). As production costs for farmers outside the EU start to increase with increasing ROW mitigation efforts, in particular for those with high GHG intensity, EU farmers are able to regain market shares. Consequently, negative EU impacts across all product groups get buffered as compared to the unilateral EU mitigation policy. For beef and non-ruminants, the production value even exceeds the baseline levels if the ROW at least pursues 25% – 50% mitigation efforts (figure 5). Pursuing 1.5 °C compatible mitigation efforts globally (full buy-in scenario) would further decrease the economic impacts on EU producers. However, the less pronounced EU production decreases with increasing ROW mitigation efforts are also mirrored in the EU non-CO2 emission savings which decreases to 115 MtCO2eq yr−1 (−27%) on average across models in the full buy-in scenario.
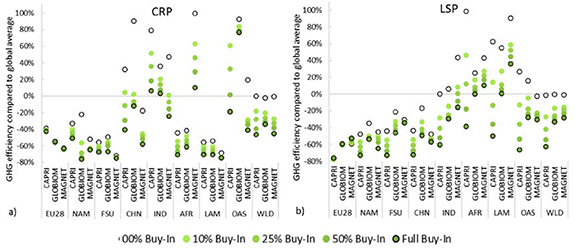
Figure 6. GHG efficiency of the (a) crop and (b) livestock sector across regions and models as compared to the global average in the baseline scenario in 2050. EU28—European Union before 2020, NAM—North America, LAM—Central and South America, FSU—Former Soviet Union countries, AFR—Africa and Middle East, CHN—China, IND—India, OAS—Other Asia, WLD—world.
Download figure:
Standard image High-resolution imageExtending the carbon price on agricultural emissions to the ROW drives GHG efficiency improvements also outside the EU. Especially regions with projected high GHG intensity in 2050 like India, Africa, Latin America, or Other Asia can already with moderate efforts substantially decrease their agricultural GHG intensity (figure 6) and consequently reduce non-CO2 emissions. For example, the 10% buy-in scenario (carbon price of 25 USD tCO2eq−1) allows to reduce the global GHG intensity for crops and livestock between 19% and 25% across models. At the same this allows to deliver already around 50% (1.6 GtCO2eq yr−1) of the total non-CO2 emission savings from the full buy-in scenario (3.3 GtCO2eq yr−1), in the 50% buy-in scenario even 85% (2.8 GtCO2eq yr−1). This shows that a substantial amount of the agricultural non-CO2 mitigation potential can already be realized at low economic costs. With increasing effort level, GHG efficiency increases and thus the marginal rate of additional emission savings decline (figure 6). At global scale, the ruminant sector is again one of the most important sources for GHG mitigation accounting for more than half (around 55%) of the total global GHG abatement, followed by the crop sector (around 25%) and dairy producers (around 15%).
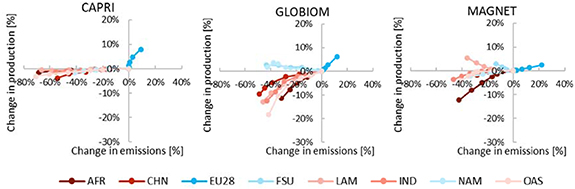
Figure 7 displays in relative terms the change in production and emissions levels for regions when moving from low to higher ROW mitigation efforts and illustrates the sensitivity of the supply and mitigation response in each model with respect to increasing mitigation efforts. Results show that farmers in developed regions like EU and North America are less impacted or may even start to benefit from a more ambitious mitigation policy as compared to regions of the Global South with less GHG efficient production systems such as India, Latin America, and African countries (figure 6). In these regions, agricultural prices tend to increase more drastically in response to the global carbon price when moving towards high mitigation efforts (full buy-in scenario). Thus, extending the mitigation policy to the ROW buffers not only impacts on EU producers but balances the impacts across world regions. Across models, CAPRI is shown to have the most inelastic supply side parameterization outside the EU as increasing ROW mitigation efforts results only in small agricultural production losses in these regions of up to −4% (−4% for crops and −10% for livestock products). In contrast, GLOBIOM (up to −24% agricultural production decrease) and MAGNET (up to −12% agricultural production decrease) show much more elastic supply side response to the agricultural mitigation policy.
Figure 7. Relative change in regional agricultural production levels and agricultural non-CO2 emissions with increasing ROW mitigation efforts (05% buy-in, 10% buy-in, 25% buy-in, 50% buy-in, and full buy-in scenarios) as compared to the 00% buy-in scenario where only the EU takes mitigation action. AGR—crop and livestock, CRP—crops, LSP—livestock. EU28—European Union, NAM—North America, LAM—Central and South America, FSU—Former Soviet Union countries, AFR—Africa and Middle East, CHN—China, IND—India, OAS—Other Asia.
Download figure:
Standard image High-resolution image
5. Conclusions and recommendations
We applied three global economic agriculture sector models (CAPRI, GLOBIOM, MAGNET) to assess the impacts of an ambitious unilateral EU agricultural mitigation policy and quantified several global mitigation scenarios where next to the EU, also regions outside Europe take action to reduce agricultural GHG emissions. We find that an ambitious unilateral EU mitigation policy in line with efforts needed to achieve the 1.5 °C target globally results in domestic non-CO2 emission savings from agriculture of around 155 MtCO2eq yr−1 on average across the three models (130–170 MtCO2eq yr−1 at 245 USD tCO2eq−1). EU emission savings are mainly related to the ruminant sector which contributes 75% of the total mitigation potential while crops and non-ruminants play a minor role.
At global scale EU agricultural non-CO2 emission savings are reduced to 90 MtCO2eq yr−1 (75–100 MtCO2eq yr−1) due to emission leakage effects (40%) that decrease the efficiency of the unilateral EU mitigation policy. As part of the EU production is reallocated to the ROW in response to the unilateral mitigation policy, agricultural non-CO2 emissions increase in the ROW and domestic EU emission savings are partly offset. Still, even an ambitious unilateral EU agricultural mitigation policy is found to deliver net emission savings at global scale. Our leakage estimates are slightly above other studies that found rates of 35% (25% EU emission reduction) (Pérez Domínguez et al 2016), 20% leakage (21% EU emission reduction) (Himics et al 2020) which is likely related to the higher EU mitigation ambition (−37% emission reduction). Results show that emission leakage is mostly caused by the reallocation of beef production (including beef from the dairy sector) and related emissions while EU milk emission savings are not compensated by increasing emissions outside the EU. Similarly, also Golub et al (2013) identify the livestock sector as key driver of agricultural emission leakage when applying regional mitigation schemes.
While EU livestock production is strongly affected by the carbon tax, regions outside the EU benefit and can increase production related to increasing competitiveness. However, if the ROW pursues mitigation efforts next to the EU, impacts on EU farmers are much less pronounced as also farmers outside the EU are included in the carbon pricing scheme. Since EU farmers rank among the most GHG efficient producers at global scale, with increasing mitigation efforts in the ROW, EU farmers remain competitive even under an ambitious domestic mitigation policy and could even benefit. For example, in the 50% buy-in scenario, the economic value of production of beef and non-ruminant producers is projected to even exceed baseline levels without EU mitigation efforts. Similarly, also other developed regions like North America with highly GHG efficient livestock production systems could benefit while GHG intensive livestock producers especially in Latin America, India and Africa would lose competitiveness and market shares. As we focus in our analysis on agricultural non-CO2 emissions, considering CO2 effects induced by the mitigation policy could further accentuate these regional effects which highlights the importance of considering distributional issues of agricultural GHG mitigation policies. Given differences in GHG mitigation efficiencies and economic prospects across world regions, accompanying distributional policies such as climate finance policies, could help to alleviate the risk of mitigation induced food security or poverty issues (Golub et al 2013, Hasegawa et al 2018, van Meijl et al 2018, Soergel et al 2021).
With respect to global emission savings, already adopting modest mitigation efforts in the ROW could lead to significant global emissions savings in agriculture mainly from ruminants and rice production. The 10% buy-in scenario is shown to achieve already 50% of the total GHG mitigation potential as compared to the full buy-in scenario and the 50% buy-in scenario even 85% of the potential. This confirms the finding in other studies (Beach et al 2015, Winiwarter et al 2018, Frank et al 2019, Harmsen et al 2019, Höglund-Isaksson et al 2020) that a substantial part of the agricultural non-CO2 mitigation potential can be achieved already at relatively low carbon prices.
Acknowledgments
This study has received funding from the European Union's Horizon 2020 research and innovation programme under the SUPREMA (Grant Agreement No. 773499), ENGAGE (Grant Agreement No. 821471), NAVIGATE (Grant Agreement No. 821124), and MINDSTEP (Grant Agreement No. 817566) projects.
Data availability
The data that support the findings of this study are available upon reasonable request from the authors.
Footnotes
- 6
- 7
- 8