

Abstract
Significant global investments are being made into smart urban mobility technologies but there is limited evidence of the potential co-benefits for reducing carbon emissions, environmental pollutants and human health impacts at scale and over the long-term. We use conservative estimates of vehicle electrification and grid decarbonisation to focus specifically on information and communication technology (ICT) interventions. In doing so, we develop a smart mobility framework focusing on more efficient road networks and driving behaviour enabled by rapid ICT deployment. Our scenarios suggest that a combination of ambitious policy measures aimed at smoothing traffic speeds as well as improving driver behaviour in urban areas could reduce carbon emissions for cars ∼29% saving ∼7 MtCO2 and for vans ∼33% saving ∼3 MtCO2 by 2050. Potential reductions in nitrogen oxides and particulate matter 2.5 for cars are ∼22% and vans ∼10% and ∼16% respectively. We use human toxicological classification of air pollution (HCA) to assess the potential damage on human health and our scenarios suggest an upper range of ∼23% and ∼30% reductions in HCA by 2050 for cars and vans respectively. Using conservative cost values, we estimate damage costs could be avoided from car emissions range from ∼£42–£130 million and vans ∼£89–£163 million per year. However, our baseline projections indicate that emissions and damage costs avoided from passenger cars could be partially offset by growing demand for urban van delivery and freight services that are currently outpacing improved fuel and emissions performance of the vehicle stock. This may reflect broader lifestyle and consumer trends towards on-line shopping, food and delivery services, which warrants further investigation.
Export citation and abstract BibTeX RIS

Original content from this work may be used under the terms of the Creative Commons Attribution 4.0 license. Any further distribution of this work must maintain attribution to the author(s) and the title of the work, journal citation and DOI.
1. Introduction
Cities aim to mitigate negative impacts of urban transport on human health, environment and climate change [1]. Transportation accounts for ∼25% of global greenhouse gas (GHG) emissions, with passenger vehicles responsible for ∼70% of that total in industrialised nations. Vehicles are also major sources of energy related local air pollution including particulate matter (PM), sulphur oxides (SOx ) nitrogen oxides (NOx ) and hydrocarbons (HCs), and final energy consumption in transport is projected to increase 50% by 2035 [2]. There are strong feedbacks between road network efficiency, and emissions. Inefficient networks can lower vehicle speeds resulting in congestion and higher local air pollution causing externalities upon human health and environment [1, 3]. These externalities calculated as damage costs, are not reflected in the market price of vehicle use and energy consumption [4, 5]. The potential damage costs arising from use of vehicles in close proximity to dense urban populations is an important policy consideration.
Research has focused on fuel efficiency and alternative fuelled vehicles to mitigate climate change [6], transport network companies to reduce congestion [7], big data to detect vehicle flows [8] and improve driver behaviour simulations [9], the role of active travel in reducing carbon emissions via mode substitution in cities [10, 11], and policy mechanisms and economic incentives to reduce transport emissions [12–14]. However, the transition to sustainable transport systems will also require optimising the use of existing transport infrastructure and managing demand [15]. Significant global investments have been made for smart mobility leveraging information and communication technologies (ICTs) to provide travellers with real-time journey information and multimodal transport options, while optimizing road network flow to avoid congestion and lower emissions [16]. However, most ICT deployments have been at the local project-based level with limited evidence of how large-scale deployment of ICT investments will impact upon long-term urban climate mitigation strategies [17, 18]. We therefore estimate the potential co-benefits of smart mobility technologies to reduce carbon and environmental emissions (PM, NOX , HC) and the resulting damage costs using the UK as a case study. In doing so, we use conservative estimates of vehicle electrification and grid decarbonisation to focus specifically on ICT based carbon interventions. Important follow up work should explore the carbon mitigation potential of more ambitious vehicle electrification combined with ICT deployment.
1.1. Smart urban mobility framework
Transport energy use and vehicle emissions are a product of (a) driver behaviour involving how efficiently the vehicle is driven (stop/starts, acceleration), which influences road fuel consumption [19–22], (b) vehicle technology performance measured by fuel efficiency [6, 12, 23], and (c) network efficiency relates to the operations and management of road networks and vehicle fleets in cities [7, 13, 15, 24]. ICT deployment that enables smart mobility planning can impact each of these domains with feedbacks on total urban transport system performance [16–18] (figure 1).
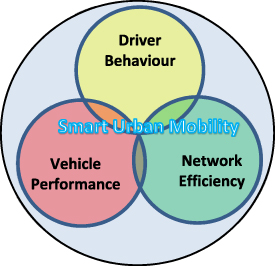
Figure 1. Smart urban mobility framework using Venn diagram depicting overlap and feedback between each domain (network efficiency, vehicle performance, driver behaviour) which influences urban systems level performance measured by energy, environmental and carbon emissions and associated damage costs from urban road transport.
Download figure:
Standard image High-resolution imageImproved efficiency of road networks, which can be defined as less total transportation energy used or lower rates of congestion can involve ICT measures for traffic management such as automated traffic light signalling, and road pricing (congestion charging, tolls) [3, 17, 18]. These measures can influence vehicle mode choice and performance, and driving behaviour through economic incentives (congestion charging) [13, 14]. ICT can also influence driving behaviour directly through on-board vehicle systems such as eco-driving measures, intelligent speed adaptation, satellite navigation, pay as you go driving, and vehicle system enforcement technologies [2, 3, 16–18]. Interactions between measures that improve road network flow, efficient driver behaviour and vehicle performance all influence transport related carbon and environmental emissions [5, 13, 25].
Below we provide an empirical review of the reported energy and environmental impacts of improved urban road network flow and driving behaviour change to inform scenario development and our modelling case study of the UK.
1.1.1. Road network flow
We summarize evidence on the impact of automated traffic and speed control systems on road network flow. The US Department for Transport reports that advanced traffic light control systems deployed in city pilot programmes across North America had improvements in vehicle mean speed ∼5%–25% resulting in CO2 emission reductions ∼2%–12% [26]. An EU wide study estimated that traffic signal controls deployed across the EU27 could reduce road traffic CO2 emissions by ∼5%–15% [27]. However, pilot studies do not account for large-scale and long-term traffic impacts, and estimates are based on arbitrary assumptions on the frequency and duration of vehicle speed changes and resulting emission reductions. Improvements in road network flow also improve air quality by reducing vehicle emissions harmful to human health. In North America, deployment of advanced traffic control signals in urban centres reported 13% reductions in fuel consumption and related carbon dioxide (CO2). In the US traffic signal retiming programmes report delay reductions of ∼5%–20% and fuel savings of ∼10%–15% [25, 28, 29]. In Europe, deployments of speed control systems have also reported emission reductions of HC by ∼4%–7% and NOx by ∼8%–11% [24]. However, estimates of efficiency improvements tend to vary greatly based on the location, time of day, and amount of traffic [24]. The variation in reported impacts often due to arbitrary assumptions and short-term monitoring highlights the need for improved monitoring and assessment methods.
1.1.2. Driver behaviour change
Here we summarize evidence on the impact of both conventional eco-driving programmes and the use of on-board systems to change driving behaviour. Eco-driving programmes coach drivers to improve fuel efficiency and reduce emissions by avoiding abrupt acceleration or sudden breaking [19, 30]. Programmes in Asia and Europe report driving related fuel efficiency improvements of ∼5%–17% within three years from initial training [19, 30–32]. However, after three years drivers tended back to old driving habits with efficiency improvements halved suggesting decreasing marginal benefits from training programmes [20]. On-board vehicle technologies can potentially maintain driver efficiency improvements over time by providing continual feedback to the driver and not allow reversion back to previous driving habits [21]. On-board vehicle instrumentation could facilitate functions such as real-time fuel economy readouts, automated lane changes, and communicating with surrounding vehicles and infrastructure to harmonize vehicle speeds could limit unnecessary acceleration/deceleration and avoid collisions. Simulation studies have found the combination of these measures reduced vehicle fuel consumption by ∼10%–20% [22] and CO2 emissions by ∼17% [33].
1.2. Need for systems level analysis
There is increasing need to meet global climate mitigation policy to reduce transport related carbon emissions and environmental impacts. ICT enabled smart urban transport systems can potentially contribute to that goal but evidence has been assessed non-systematically based on deployment of different technologies at a project level with limited impact monitoring over time. Consequently, there is a wide range of reported impacts. There is need for a systems wide assessment of the potential energy and environmental impacts from ICT deployment over the next 30 years to help meet climate policy targets. We use the evidence base reviewed above to parameterize scenarios out to 2050, and computational simulations to case-study the system wide effects of large-scale urban ICT technology deployment in the UK.
2. Methods
2.1. UK transport carbon model (UKTCM)
We develop quantified scenarios of ICT investment for urban road network infrastructure, and on-board vehicle technology assisted eco-driving for cars and vans in urban areas. The modelling of these scenarios involves (a) framing and development of a reference case and three alternative ICT scenarios; (b) the published UKTCM [23, 34] is used to simulate the implications of each scenario including urban traffic speeds, energy consumption and GHG emissions, local air quality pollution (NOx and PM2.5), and damage costs of externalities up to 2050. The UKTCM is a disaggregated bottom-up model of transport energy use and life cycle GHG emissions. It provides annual projections of transport supply and demand for passenger and freight and all motorised modes of transport, and calculates the corresponding energy use, life-cycle emissions and environmental impacts on an annual time step. The model includes >700 vehicle technology categories, including alternative-fuelled vehicles e.g. hybrid electric cars. Vehicle technologies are defined as a typical representative of a combination of transport type (passenger or freight), vehicle type (e.g. motorcycle, car, heavy goods vehicles - HGV, train), vehicle size (e.g. small car, van, heavy truck, intercity rail), fuel type (e.g. gasoline, diesel, E85, electricity), vintage (e.g. a 2015–19 generation internal combustion engine vehicle (ICV) car or a Euro VIII 2020–24 generation ICV van) and hybridisation (conventional ICV, hybrid electric vehicle - HEV, or plug-in hybrid electric vehicle - PHEV). Vintaging is used to simulate changes in performance, efficiencies, consumer preferences, costs and taxes over time. See [23, 34, 35] for full technical details and figure 2 in SI (available online at stacks.iop.org/ERL/16/114023/mmedia) for model schematic of UKTCM as well as previously developed scenario work [23]. We summarize key modules of the UKTCM deployed for this study below.
The UKTCM is designed to quantify future scenarios to explore technological, fiscal, regulatory, vehicle use/ownership and behavioural change transport interventions. For example, UKTCM was used to assess long-term scenarios of low carbon fiscal policies and their effects on transport demand, vehicle stock evolution, and lifecycle GHG emissions in the UK [34, 35]. Within the UKTCM modelling framework we are able to simulate ICT impacts on urban network flow and sustained eco-driving behaviour through endogenous modelling of (a) energy use and emissions by integrating over mean speed-distribution curves and mean speed-emissions curves; and (b) future take-up of more efficient driving behaviour using on-road fuel consumption and emissions scaling factors. Note for this paper we exclude any changes in overall traffic demand as a result of changes in vehicles speeds or more efficient driving.
2.1.1. Energy use, speed distributions and emission curves
UKTCM computes fuel and energy consumption (in volume and energy units) as well as pollutant emissions (CO2, NOX , PM10, etc) arising from vehicle operation by using the established speed-emissions factor method. UKTCM's ability to model the combined effects of different demand segments, dynamically evolving vehicle fleet compositions, different sets of emission factors, traffic characteristics, cold starts, fuel quality and driver behaviour made it relevant for this analysis. For this work we calculated energy consumption and emissions by integrating (a) mean speed distribution curves for cars and vans in urban areas over (b) vehicle technology specific speed emissions curves developed in previous vehicle testing programmes and emissions inventories [36–38]. This is summarized below.
Vehicle speed has a major influence on exhaust emissions. The model uses mean speed distributions  (S), which is a frequency distribution function of mean speed for vehicle type j and road class k, with the current distribution based on observed distributions of 'free flow' and 'average congested' speeds taken from UK national statistics [39, 40]. Future speed distributions can be changed dynamically to simulate effects of changing road specific speed limits (and effectiveness of enforcement) as well as aggregate congestion effects. Speed dependence of 'hot' emissions factors for all road vehicle types is derived by polynomial regression up to a maximum degree of 9th order as shown in equation (1),
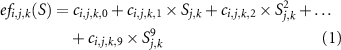
where  (S) is energy use or emissions factor for pollutant i, vehicle technology j, road class k and mean speed S; is mean speed for vehicle technology j and road class k; and,
  are polynomial coefficients x based on vehicle testing programmes and emissions inventories [36–38] for pollutant i, vehicle technology j and road class k. By integrating speed distribution curves over emission curves, we get a set of energy use and emissions factors for each pollutant i, vehicle technology j and road class k, as shown in equation (2),
where  is energy use or emissions factor for pollutant i, vehicle technology j and road class k and
  (S) are mean speed distribution curves for vehicle technology j and road class k.
Another important consideration is the evolving vehicle technology stock specifically electrification of the vehicle fleet and grid decarbonisation. While we account for these in our scenarios we acknowledge our estimates are conservative given more recent ambitious UK policies. Figure 2 shows our assumptions for carbon grid intensity for UK transport.

Figure 2. Carbon grid intensity of electricity for UK transport from 2010 to 2050 measured in grams of carbon dioxide per kilowatt hour (gCO2 (kWh)−1).
Download figure:
Standard image High-resolution image2.1.2. Environmental damage cost valuation
There are a variety of damage types from transport related airborne emissions that can negatively affect upon human health, buildings (e.g. by soiling, corrosion etc.), accidents, fatalities, injuries and global warming [18]. External costs of damages are determined based on evaluation of marginal external costs and benefits, which were estimated using the Impact Pathway Approach (IPA) developed previously in European research [41–43] and is commonly used in transport modelling and appraisal [44–47]. Table 1 shows average damage costs to human health from direct NOX and PM2.5 emissions by population density. The full IPA modelling is relatively resource and time intensive. To support decision making, damage costs per ton of emissions were developed by the UK Department for Environment, Food and Rural Affairs for use by analysts. These damage costs were derived from the full IPA analysis, providing a proportionate approach to valuing of the impacts of changes in air quality. The UKTCM Reference Guide [34] describes the functional relationships and data used in detail.
Table 1. Damage costs per tonne (2015 prices) for NOX and PM2.5 by population density.
| NOX damage costs (£/ton) b | PM2.5 damage costs (£/ton) | |||||
|---|---|---|---|---|---|---|
| Population/building density | Low(a) | Central | High(a) | Low(a) | Central | High(a) |
| High ('transport inner conurbation') | 20 455 | 51 137 | 81 820 | 110 590 | 141 248 | 160 507 |
| Medium ('transport average') | 8417 | 21 044 | 33 670 | 45 510 | 58 125 | 66 052 |
| Low ('rural') | 2610 | 6524 | 10 438 | 14 108 | 18 020 | 20 476 |
Source: [48, 49]. Notes:a The central sensitivities reflect uncertainties around the lag between exposure and the health impact. The sensitivity for NOX also reflects the uncertainty around the link between NO2 exposure and mortality. b NOX damage costs if PM2.5 is also valued (per ton, 2015 prices).
2.2. Model calibration, data and scenario assumptions
For the analysis presented in this paper the UKTCM databases were updated to the latest historic data (a coherent UK dataset was available for 2012) and projections into the future of key modelling inputs, including midpoint government estimates of economic, demographic, transport demand, energy efficiency and vehicle technology data. The model has been calibrated to UK national statistics [50] for the years 2012–2020 (see SI). In order to explore different possible futures to 2050 of the effects of ICT on network flow and eco-driving on urban transport emissions, four core scenarios have been developed. None of the scenarios should be seen as a forecast or prediction, but instead the scenarios allow different possible development and investment strategies to be explored and compared.
2.2.1. Reference scenario (REF)
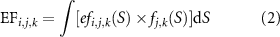
The underlying assumption is that development and investment plans for ICT enabled urban infrastructure and vehicle technology continues along recent trends i.e. moderate investment in ICT to optimise traffic flows [3, 18, 24, 26, 32], and virtually no investment at scale for on-board ICT vehicle technology [19–22]. In this scenario, urban traffic in the UK increases largely due to economic and population growth, which increases pressure on road infrastructure resulting in more congestion [23, 35]. This effect is simulated by a widening of urban traffic peaks from 8 h in 2015 to 16 h over the 24 h period in 2050, corresponding to a 50% increase in congestion by 2050 [39]. To derive the REF speed profiles, we first derived urban free flow speeds based on UK urban speed profile statistics for 30 mph (70%) and 40 mph (30%) roads in 2015 [40]; Second, urban congested traffic speeds were derived from average vehicle speeds (flow-weighted) during the weekday morning peak on locally managed 'A roads' taking the average of a selection of cities, larger urban areas and Unitary Authorities [39, 40]. Third, the urban speed profile for 2015 is then derived by computing the weighted average of 'free flow' (weighting of 2/3 = 16 h/24 h for off-peak and inter-peak) and 'city A roads' (weighting of 1/3 = 8 h/24 h for peak AM, peak PM and midday peak) [50]. Finally, for future years, and in the absence of road building and ICT measures to optimise traffic flows, we assumed in the REF scenario that urban road congestion gradually worsens over time. This is simulated by widening the above peaks of high traffic volumes by 21% by 2030 and 50% by 2050. Figure 3 shows the resulting reference case speed profiles for cars in 2015, 2020, 2025, 2030 and 2050; and table 2 in SI gives the underlying data.
Figure 3. Mean speed profiles for cars in the reference case scenario for 2015, 2020, 2030 and 2050.
Download figure:
Standard image High-resolution image2.2.2. Road network scenario (ICT)
This scenario assumes large-scale investment and deployment of traffic light signal coordination systems (ICT) to optimize vehicle flow on the road network. ICT is rapidly taken up for urban road networks to optimise the use of existing road infrastructure. ICT deployment is modelled as a logistic function with initial rapid exponential growth and saturation over time. Here we see how ICT deployment affects road network flow by simulating change in mean vehicle speeds and resulting emissions. We tested three variants of ICT scenarios ('Central', with sensitivities 'Low' and 'High') that assume different take up and 'success' rates of future ICT measures. The key assumptions were: (a) different diffusion rates of take up of 'ICT measures' over the next 10–15 years, depending on scenario variant, with start of fast growth (>10%) in 2018 and saturating at 20% (Low), 60% (Central) and 100% (High); (b) the main impact of the ICT measures is that mean speeds on urban roads will be higher than in the REF case, with 20% (Low), 60% (Central) and 100% (High) of road traffic seeing 'free flow' speeds by 2035 at the latest. Conversely, 80% (Low), 40% (Central) and 0% (High) of traffic will be untouched by the measures by 2035 (i.e. as in the REF case). The parameters for ICT take up and the resulting S-curves are shown in table 2 and figure 4.
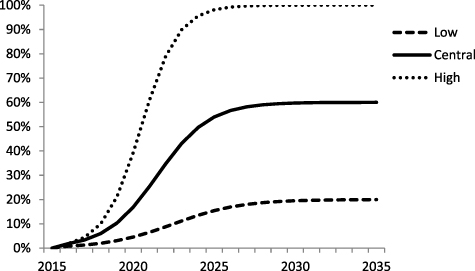
Figure 4. ICT take up S-curves for low, central and high up take of ICT measures.
Download figure:
Standard image High-resolution imageTable 2. ICT take up, S-curve parameterisation.
| ICT take up | ICT Low | ICT Central | ICT High |
|---|---|---|---|
| Saturation percentage (max. share of urban traffic affected by ICT measures) | 20% | 60% | 100% |
| Start of fast growth (10% of saturation % of urban traffic affected in this year) | 2018 | 2018 | 2018 |
| Takeover time (years) (time, in years, between 10% and 90% of relative take up) | 9 | 7 | 5 |
The underlying ICT speed distributions are shown in figure 5 for cars for Low (on left), Central (in middle) and High (on right) variants. These distributions were taken as inputs to the UKTCM modelling of energy use and emissions.
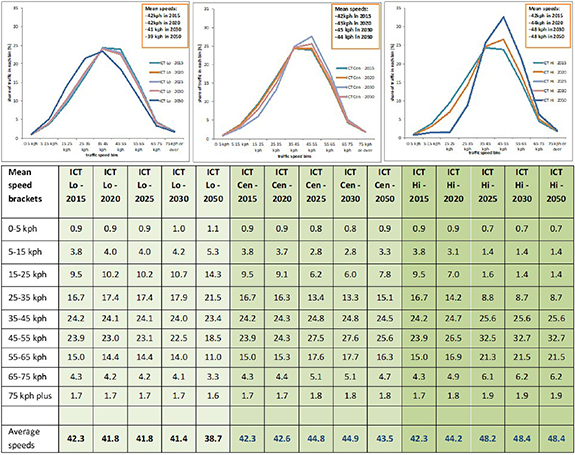
Figure 5. ICT speed distributions and mean speeds for cars: low (on left), central (in middle), high (on right) scenario variants.
Download figure:
Standard image High-resolution image2.2.3. Eco-driving scenario (ECO)
This scenario assumes large scale deployment of in-car instrumentation for driver assistance and improved driving behaviour from 2015 onwards. There are continued incentives to practice eco-driving as the cost of motoring increases and speed enforcement penalties are steep. Speeding (and inefficient driving behaviour) becomes socially unacceptable as it is seen as wasteful. In any given year a certain proportion of drivers (includes new car drivers) are practicing eco-driving with an average 10% improvement in fuel efficiency for each mile affected (this is about the median of the evidence base, so considered a realistic estimate and our 'Central' value). Low, High/Low and High values of 5%, 15% and 20% were tested for sensitivity around the Central estimate. About 20% is within the reported range, and 5% is at the lower end of the evidence base. However, not all drivers are practicing eco-driving, and even for those who are, not every mile they drive is affected. We assumed 75% (Central), 50% (Low) and 100% (High) of mileage done by new drivers are affected by driving more efficiently; a maximum of 70% (Central), 40% (Low), 85% (High-Central) and 100% (High) for existing private drivers; and a maximum 75% (Central), 50% (Low), 90% (High-Central) and 100% (High) for existing business drivers.
Assuming car mileage is proportionate to the number of drivers (as shown in table 3), we can make an assumption about the proportion of mileage affected as the technique works through the driver fleet and becomes habit (see table 4 for parameterisation of the diffusion S curves, and figure 6 for the actual S curves of the mileages affected by eco-driving (in %) for private and business drivers). See figure 7 for total mileage affected by eco-driving by scenario variant. Business uptake of eco-driving is expected to be quicker as it is easier to integrate training programmes and instrumentation. This is a false divide in reality as business drivers are also private drivers, but the financial incentives for economical use of fuel when driving for business are assumed greater. Table 5 shows the resultant time series (curtailed after 2025 for space reasons; the series continues out to 2050). Penetration through light goods vehicle (LGV) fleet is expected to mirror that of car business travel.
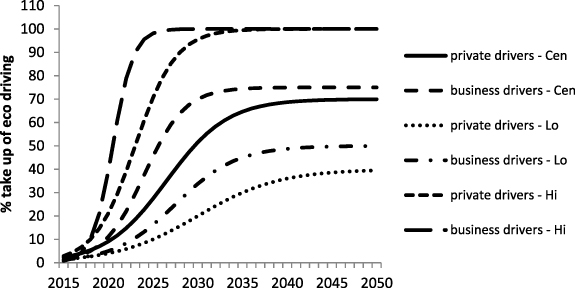
Figure 6. Proportion of mileage affected by eco-driving (in %) for private and business drivers (NB: Hi/Lo variant omitted from this graph for clarity).
Download figure:
Standard image High-resolution image
Figure 7. Total mileage affected by eco-driving (in %), by scenario variant.
Download figure:
Standard image High-resolution imageTable 3. Number of drivers in each category.
| New drivers 2012 (A) | 707 000 |
| Total drivers 2012 (B) | 35 800 000 |
| Proportion new drivers (A/B) | 2.0% |
| Private mileage, all drivers | 89% |
| Business mileage, all drivers | 11% |
Table 4. Proportion of driving by car affected by eco-driving programme, by scenario variant.
| ECO Low | ECO Central | ECO Hi/Cen | ECO High | ||||||
|---|---|---|---|---|---|---|---|---|---|
| Eco-driving take up | Private | Business | Private | Business | Private | Business | Private | Business | |
| Saturation percentage | Share of vkm affected by ECO | 40% | 50% | 70% | 75% | 85% | 90% | 100% | 100% |
| Start of fast growth | 10% of saturation % of vkm affected in this year | 2020 | 2020 | 2019 | 2019 | 2018 | 2018 | 2018 | 2018 |
| Takeover time (years) | Time between 10% and 90% of take up at saturation | 20 | 15 | 15 | 10 | 10 | 5 | 10 | 5 |
| Efficiency gain | Improvement per km driven (%) | 5% | 5% | 10% | 10% | 15% | 15% | 20% | 20% |
Note: Values for LGVs as for business drivers. Variant 'High-Central' sits between High and Central (not shown).
Table 5. Car eco driving take up rates up to 2025a (Low, Central and High only).
| Proportion of mileage affected by eco-driving (%) | 2015 | 2016 | 2017 | 2018 | 2019 | 2020 | 2021 | 2022 | 2023 | 2024 | 2025 | |
|---|---|---|---|---|---|---|---|---|---|---|---|---|
| Central | New drivers—Cen | 75 | 75 | 75 | 75 | 75 | 75 | 75 | 75 | 75 | 75 | 75 |
| Private drivers—Cen | 2 | 3 | 4 | 5 | 7 | 9 | 12 | 15 | 18 | 23 | 27 | |
| Business drivers—Cen | 1 | 2 | 3 | 5 | 8 | 11 | 16 | 22 | 29 | 38 | 46 | |
| Total % mileage affected | 3.6 | 4.4 | 5.4 | 6.7 | 8.4 | 10.6 | 13.3 | 16.7 | 20.7 | 25.3 | 30.3 | |
| 10% efficiency gain | Scaling/Central | 0.996 | 0.996 | 0.995 | 0.993 | 0.992 | 0.989 | 0.987 | 0.983 | 0.979 | 0.975 | 0.970 |
| Low % | New drivers—Lo | 50 | 50 | 50 | 50 | 50 | 50 | 50 | 50 | 50 | 50 | 50 |
| Private drivers—Lo | 1 | 2 | 2 | 3 | 3 | 4 | 5 | 6 | 7 | 8 | 10 | |
| Business drivers—Lo | 1 | 2 | 2 | 3 | 4 | 5 | 6 | 8 | 11 | 13 | 16 | |
| Total % mileage affected | 2.4 | 2.7 | 3.1 | 3.6 | 4.2 | 5.0 | 5.9 | 7.0 | 8.3 | 9.8 | 11.4 | |
| 5% efficiency gain | Scaling factor/Low | 0.999 | 0.999 | 0.998 | 0.998 | 0.998 | 0.998 | 0.997 | 0.997 | 0.996 | 0.995 | 0.994 |
| High % | New drivers—Hi | 100 | 100 | 100 | 100 | 100 | 100 | 100 | 100 | 100 | 100 | 100 |
| Private drivers—Hi | 3 | 4 | 7 | 10 | 15 | 21 | 29 | 39 | 50 | 61 | 71 | |
| Business drivers—Hi | 1 | 2 | 4 | 10 | 21 | 39 | 61 | 79 | 90 | 96 | 98 | |
| Total % mileage affected | 4.5 | 6.0 | 8.2 | 11.7 | 17.0 | 24.6 | 34.1 | 44.6 | 55.2 | 65.3 | 74.2 | |
| 20% efficiency gain | Scaling factor/High | 0.991 | 0.988 | 0.984 | 0.977 | 0.966 | 0.951 | 0.932 | 0.911 | 0.890 | 0.869 | 0.852 |
a Notes: Data shown only up to 2025. The series continues to 2050. Variant 'High-Central' sits between High and Central (not shown).
2.2.4. Scenario variants/sensitivity analysis
The integrated scenario (ICT + ECO) explores the potential impacts of large-scale deployment targeting both urban network infrastructure and vehicles. The integrated modelling approach avoids double counting of ICT effects. For example, if individual emissions reductions by 'measure A' and 'measure B' were 10% and 10% respectively, then 'double counting' would mean the total effect of both measures would be a 20% reduction. Integrated parameterisation in the model ensures that the total effect of measure B is reduced by measure A and vice versa e.g. A (0.9) × B (0.9) = 0.81% ∼ 19% reduction overall. This ensures that we did not simply add the effects, such that the effect of one measure reduces the potential of the other measure. Table gives an overview of the scenario variants. This included four 'core' scenarios and eight 'sensitivity' scenario 'variants' around the 'core' scenarios (table 6). The core scenarios are:
Table 6. Overview of scenario variants.
| ECO | ||||
|---|---|---|---|---|
| REF | ECO Low | ECO Central | ECO High | |
| ICT | ICT Low | ICT + ECO Low | — | — |
| ICT Central | — | ICT + ECO Central | — | |
| ICT High | — | — | ICT + ECO High | |
- (a)REF: reference (or 'business-as-usual') scenario for comparison;
- (b)ICT Cen: as above, central;
- (c)ECO Cen: as above, central;
- (d)ICT + ECO Cen: integrated ICT and ECO package, central.
The scenario variants are:
- (e)ICT Lo, ICT Hi: as described above;
- (f)ECO Lo, ECO Hi-Cen, ECO Hi: as above;
- (g)ICT + ECO Lo, ICT + ECO Hi-Cen, ICT + ECO Hi: as above.
3. Results and discussion
3.1. Carbon emissions mitigation potential
Figure 8 show the resulting GHG emissions reported as CO2-equivalent for cars (panels (A)–(C)) and vans (panels (D)–(F)) respectively. For cars, the REF shows gradually decreasing GHG emissions, largely due to improved fuel and emissions performance of the vehicle stock that has outpaced traffic growth. When compared to the REF case, the 'core' ICT and ECO scenarios gave similar reductions in GHG emissions from urban car travel. This was mirrored in the sensitivity runs (figure 9), with the High ECO scenario being the exception achieving the largest reductions of the single measure variants. Most reductions were achieved during the deployment years up to 2030, with relative savings slowly diminishing as cars become technically more efficient. For vans, the results of the REF case showed gradually increasing GHG emissions largely due to growing demand for urban freight that outpaces improved fuel and emissions performance of the vehicle stock. When compared to the REF case the 'core' ICT and ECO scenarios gave similar reductions in GHG emissions with the High ECO scenario variant achieving the largest single measure reductions of 20%.

Figure 8. Historical and projected carbon emissions for passenger cars: (A) ICT, (B) ECO driving, and (C) integrated, ICT + ECO deployment scenarios; and vans: (D) ICT, (E) ECO driving, and (F) integrated, ICT + ECO deployment scenarios in the UK, 2010–2050. Notes: shaded areas indicate sensitivity range between low and high variants; REF = reference case; ICT = road network; ECO = driving behaviour; ICT + ECO integrated deployment.
Download figure:
Standard image High-resolution image
Figure 9. Change in urban passenger vehicle CO2-equivalent emissions for each scenario variant for (A) cars and (B) vans, compared to reference case for 2020, 2030, and 2050. Notes: REF = reference case; ICT = road network; ECO = driving behaviour; ICT + ECO integrated deployment.
Download figure:
Standard image High-resolution imageFigure 9(A) shows the sensitivity analysis for cars, showing ECO could reach an upper GHG emissions reduction potential of 20% compared to 12% for improved road network flow (ICT). Figure 9(B) shows the sensitivity analysis for vans indicating an upper savings from improved road network flow of 9% by 2050 and no more savings from eco-driving due to an increase in the LGV fleet. Sensitivity analysis for the integrated (ICT + ECO) scenario suggests that a combination of ambitious policy measures aimed at smoothing traffic speeds as well as improving driver behaviour in urban areas could reduce emissions for cars 29% saving 7 MtCO2-eq; and for vans, 33% emissions saving ∼3 MtCO2-eq by 2050.
3.2. Environmental emissions mitigation potential
Alongside global GHG emissions, it is also important to consider the local environmental emission effects of ICT deployment. Figure 10 shows change in vehicle emitted (A) nitrous oxides (NOx ) and (B) particulate matter (PM2.5) for cars and vans. We found that in the REF case NOX and PM2.5 emissions decrease significantly until the mid to late 2020s, briefly stabilise, but then increase at a moderate rate from the 2030s onwards. This is largely due to the assumption that there will be no significant tightening of European NOX and PM emissions standards beyond the EURO6 standard. The rise after 2030 simply reflects the increase in traffic levels.
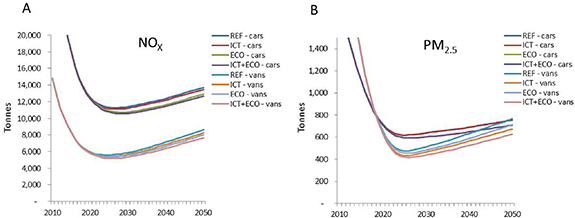
Figure 10. Change in vehicle emissions and alternative scenarios for (A) nitrous oxides (NOx ) and (B) particulate matter (PM2.5) from 2010 to 2050 in the UK. Notes: REF = reference case; ICT = road network; ECO = driving behaviour; ICT + ECO integrated deployment.
Download figure:
Standard image High-resolution imageFigure 11 summarizes the NOX emissions reductions potential for cars (panel A) and vans (panel B) from the reference case, indicating that NOX emissions from ICT scenarios decreased little overall achieving ∼1% (Low 0%, High 2%) reductions by 2050. This was mainly due to the flat NOX speed-emissions curves for cars at urban speeds since NOX emission curves increase with higher average speeds but are fairly flat at lower average speeds. For vans, while contributing only 15% to total traffic in urban areas, NOX emissions from vans were 32% of the total in 2015, rising to 38% in 2050. This is largely due to the much higher diesel share in the vehicle stock for vans (∼100% in 2015) when compared to cars (about 41% in 2015). The ICT scenarios also has little impact on NOX emissions from vans ∼3% (Low 1%, High 5%) reductions by 2050. This was also mainly due to the flat NOX speed-emissions curves for vans at urban speeds.
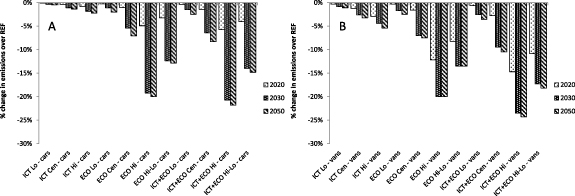
Figure 11. Summary of NOX emission reductions in alternative scenarios from reference case for (A) cars and (B) vans in 2020, 2030 and 2050.
Download figure:
Standard image High-resolution imageFigure 11 shows that in contrast, for cars and vans, NOX emissions in the ECO scenarios were lower than the REF by ∼7% (Low 2%, High 20%) in 2050; and, that the integrated ICT + ECO policy package, which achieves reductions of up to ∼8% (Low 2%, High 22%) by 2050 is largely driven by savings from more efficient driving behaviour. This suggests that in order to achieve maximum savings of about a fifth of urban NOX emissions we should focus on ambitious measures aimed at improving driver behaviour in urban areas. ICT measures aimed at improving speeds, on the other hand, may contribute relatively little.
Figure 12 summarizes the PM2.5 emissions reduction potential for cars (panel A) and vans (panel B) from the reference case. Our modelling suggests that improving mean car speeds in urban areas (ICT scenarios) does not reduce PM2.5 emissions significantly, reflecting the low emission rates for gasoline cars and the relatively flat PM2.5 emissions curves at urban speeds (figure 12(A)). In contrast, PM2.5 emissions in the more efficient driver behaviour (ECO) scenarios were modelled to be lower than REF by 7% (Low 2%, High 20%) in 2050. These are in line with the other pollutants and fuel savings above. The combined ICT + ECO packages for cars mirrored the results of the ECO scenarios. For vans, while contributing only 15% to total traffic in urban areas, PM2.5 emissions from vans were 55% of the total in 2015. This is largely due to the much higher diesel share in the vehicle stock for vans (∼100% in 2015) when compared to cars (about 41% in 2015). Figure 12(B) shows that PM2.5 emissions in the ICT scenarios decreased 9% (Low 3%, High 15%); and 7% (Low 2%, High 20%) for the ECO scenario by 2050, which reflects the above reductions in fuel use and CO2eq emissions. The integrated ICT + ECO scenarios for Vans achieve 16% (Low 5%, High 32%) reductions by 2050. This suggests that the highest savings of about a third of urban PM2.5 emissions could potentially be achieved by a combination of ambitious measures aimed at smoothing and increasing traffic speeds as well as improving the behavioural efficiency of urban driving.

Figure 12. Summary of PM2.5 emission reductions in alternative scenarios from reference case for (A) cars and (B) vans in 2020, 2030 and 2050.
Download figure:
Standard image High-resolution image3.3. Human toxicological classification of air pollution (HCA)
The HCA refers to the damage caused to human health (e.g. chronic morbidity, acute mortality) and is expressed in mass of SO2 equivalent (SO2-eq). The NOX weighting factor was assumed to be 0.65 [51, 52]. Figure 13(A) shows that in the REF case the HCA from car traffic decreases significantly until the late 2020s but then increases at a low rate from the 2030s onwards. As mentioned above, this reflects the assumption that there will be no further tightening of European NOX , SOX and other toxicological pollutant emission standards beyond the EURO6 standard. The rise after 2030 reflects the increase in traffic levels. The integrated ICT + ECO package is largely driven by savings from more efficient driving behaviour, showing reductions over the reference case of ∼9% (Low 3%, High 23%) by 2050. This suggests that in order to achieve maximum reductions of about a quarter of urban HCA impacts we should focus on ambitious measures aimed at improving driver behaviour in urban areas. ICT measures aimed at improving speeds may contribute relatively little.
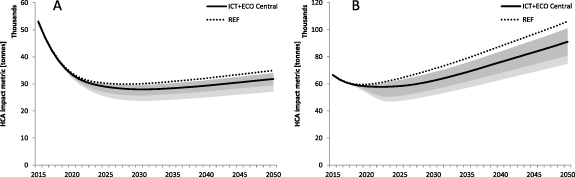
Figure 13. Human toxicological classification of air pollution from urban traffic for (A) cars and (B) vans and range of combined ICT + ECO scenarios vs. reference case from 2015 to 2050.
Download figure:
Standard image High-resolution imageAgain, while contributing only 15% to total traffic in urban areas, HCA impacts from vans were 56% of the total in 2015, rising to a massive 75% in 2050. This is due to the much higher diesel share in the vehicle stock for vans (∼100% in 2015) and relatively high traffic growth for vans. Figure 13(B) shows HCA impacts for van traffic for the combined ICT + ECO scenarios, with reductions over REF of 14% (Low 5%, High 30%) by 2050. Both ICT and ECO measures weighed in equally this time, suggesting that in order to achieve maximum savings of 30% of urban HCA impacts from vans we should focus on a combination of ambitious measures aimed at improving driver behaviour and ICT measures aimed at improving speeds.
3.4. Damage cost valuation
Figure 14 shows that for cars, our results suggest significant damage costs from urban traffic, currently between £640 million (Low cost value) and £1970 million (High cost value). Following the trend of pollutant emissions the costs decrease, plateau off but then increase again. By 2050, the combined ICT + ECO Central scenario suggests potential savings between £42 million (Low damage cost value) and £130 million per year (High value), with the High scenario showing substantial savings between £111 million (Low damage cost value) and £348 million a year (High value). Figure 15 shows for vans, we found significant damage costs from urban traffic, currently between £537 million (Low cost value) and £1229 million (High cost value). These values are comparable with cars, reflecting the high share of diesels in the van fleet. As with pollutant emissions and HCA impacts, the costs decrease with tightening EU standards, then plateau off briefly before increasing at a moderate rate to 2050. By 2050, the combined ICT + ECO Central scenario saved between £89 million (Low damage cost value) and £163 million a year (High value), with the High scenario showing substantial savings of between £189 million (Low damage cost value) and £366 million per year (High value). These figures are comparable to cars so ICT and ECO policy should focus equally on cars and vans.

Figure 14. External damage costs of air pollution from car traffic to human health, and range of combined ICT + ECO scenarios vs. REF for (A) low damage costs and (B) high damage costs from 2015 to 2050.
Download figure:
Standard image High-resolution image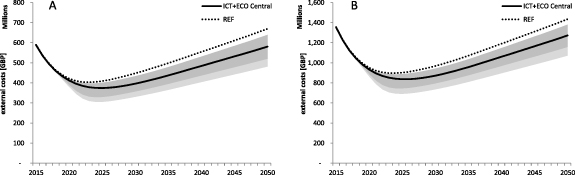
Figure 15. External damage costs of air pollution from van traffic to human health, and range of combined ICT + ECO scenarios vs. REF for (A) low damage cost and (B) high damage costs from 2015 to 2050.
Download figure:
Standard image High-resolution image
4. Conclusions
Our baseline results indicate that for passenger cars, total emissions decline due to increasing engine efficiency gains due to European car CO2 legislation, but there are increasing emissions from vans reflecting growth in urban delivery services (on-line shopping, food delivery, etc), which will likely increase over time due to population growth, migration to cities, and lifestyle change [53, 54]. The current study did not explore potential high penetrations of electric vehicles along with additional mitigation benefits from broader demand side management (DSM) measures including real time information feedback to influence journey planning, mode choice and vehicle trip replacements [55]. However, our results indicate that potential carbon savings (∼29%) from ambitious ICT interventions are non-trivial, when compared to carbon reductions (∼36%) from aggressive road transport electrification scenarios [6, 56]. But when considering well-to-wheel carbon reductions from vehicle electrification and grid decarbonisation the savings potential is much higher (∼40%–75%) [2, 13].
Nevertheless, as much of the future vehicle fleet growth will occur in emerging economies, there is an opportunity for smart urban mobility measures to optimise the use of existing infrastructure, and reduce or shift demand, rather than invest heavily into fossil fuel-based road capacity expansion, which will lock carbon and scarce resources into a current mobility system that is not sustainable. There are important implications for combined policy measures targeting ICT mobility DSM and incentivising electric vehicle uptake that should be explored in further research.
Our aim is to also help provide some evidence that co-benefits including improved human health and air quality should be taken into account in standard cost-benefit analysis when evaluating the financial viability of smart urban mobility measures. However, it is also important that measures to improve traffic flow do not induce greater demand through more frequent or longer distance driving. It will be important to manage demand for vehicle driving in coordination with available road space. For example, congestion-based road pricing and other incentives to improve and sustain eco-driving behaviour should be part of a broader smart urban mobility strategy. Finally, different combinations of ICT measures should be piloted and systematic longer-term impact monitoring should be conducted before deploying at the urban scale.
Acknowledgments
Support from the Natural Sciences and Engineering Research Council (NSERC) Canada Research Chair (MT) is gratefully acknowledged. CB is supported by UK Research and Innovation (UKRI) under the UK Energy Research Centre (UKERC, Grant No. EP/S029575/1) and the Centre for Research into Energy Demand Solutions (CREDS, Grant No. EP/R035288/1).
Data availability statement
All data that support the findings of this study are included within the article (and any supplementary files).