

Abstract
Production cost models (PCMs) simulate dispatch of generators across a large power grid and are used widely by planners to study the reliability of electricity supply. As energy systems transition away from the thermoelectric technologies that have traditionally balanced electricity supply and demand, hydropower and its representation in PCMs is of increasing importance. A limitation of PCMs applied to continental power grids with diverse generation portfolios is that hydropower generation is simulated without full consideration of complex river dynamics, leading to possible misrepresentation of grid flexibility and performance. In addition, data used in PCMs may reflect outdated operating policies. In this paper we propose a hydropower generation feasibility test for PCMs. The approach uses a detailed hydropower model to determine whether the hourly hydropower schedule from a PCM with simplified monthly parameterization can be attained after accounting for realistic river dynamics and operating policies, such as spill requirements and general water movement and balance through a cascade reservoir system. We perform this hydropower generation test for the 'Big 10' hydropower system on the Columbia River (part of the Western Interconnect of the United States), revealing 9% overestimation of available hydropower generation in a PCM solution in an average hydrologic year. Our evaluation provides insight on the cost and opportunities for better representing hydropower in PCMs.
Export citation and abstract BibTeX RIS

Original content from this work may be used under the terms of the Creative Commons Attribution 4.0 license. Any further distribution of this work must maintain attribution to the author(s) and the title of the work, journal citation and DOI.
1. Introduction
Grid operators, utilities, and researchers use production cost models (PCMs) to simulate the power grid and study its reliability (Oikonomou et al 2022). A common formulation of a PCM has two components: unit commitment and economic dispatch of generation. Unit commitment refers to the discrete decisions of when individual thermal power units are generating or turned off. Economic dispatch refers to the generation level for individual power units at an hourly time step to most efficiently meet variable load and reserve requirements over a pre-specified time horizon at minimum total system cost. System cost includes the sum of start-up and operating (fuel) costs of various generating units mobilized in the simulation. Hydropower presents a challenge for power grid modelers. Without fuel costs and capable of ramping up and down output within minutes, hydroelectric generators, in theory, could be dispatched readily to smooth out sharp variations in load and help maintain reliable electricity service throughout the grid. The challenge is that, in reality, available hydropower generation depends on river flows, which depend on weather and on the operations of upstream dams, and on operating rules to meet conflicting management objectives, such as required spill for fish passage and maintenance of flood pools in reservoirs (Key et al 2012, Stoll et al 2017).
Although these processes and objectives can be approximated in PCMs (Ibanez et al 2014, Maceiral et al 2018), the scale and structure of a power grid model used for day-ahead applications and reliability studies are rarely amenable to including detailed hydropower generation with localized river operations (Voisin et al 2020a, Oikonomou et al 2022). Instead, PCM constraints include a predefined operating range and energy availability. The seasonal aspect of hydropower often leads to a monthly estimate of these values based on observations for a specific year (Dennis et al 2011). This approach is adopted in various commercial and academic PCMs (e.g. GridView, Promod IV, PLEXOS, UPLAN, AURORA, GO).
The limitations of this approach to capturing the behavior of coordinated and cascading hydropower fleets are well documented (Ibanez et al 2014, Stoll et al 2017, Voisin et al 2020a). There are many potential sources of error: observed generation not reflecting current generation capability, monthly estimates for constraints, lagged flows between reservoirs, and environmental constraints. Together, these sources of error and others may lead the PCM to under-constrain and/or over-constrain hydropower generation within the model.
The costs of misrepresenting hydropower could be nontrivial. PCMs play an important role in a growing research field addressing the performance and reliability of the power grid under external events and emergent trends, including the impacts of climate change and droughts, increased penetration of renewable power, emergence of smart-grid technologies and distributed generation and storage, widespread adoption of battery-powered vehicles, and regulatory changes such as carbon taxes (e.g. Yang et al 2017, Tarroja et al 2019, Turner et al 2019, Lopes et al 2020, Qin et al 2020, Voisin et al 2020b, Chowdhury et al 2021, Hill et al 2021). Under-constrained hydropower representation could mask vulnerabilities in the grid and perhaps lead to overconfidence in its capabilities for meeting load during outages or extreme events. Conversely, studies that employ fixed (exogenous) hourly hydropower dispatch in the PCM (another common approach—as documented in Oikonomou et al 2022) are liable to underplay the actual flexibility of hydropower, potentially leading to simulated vulnerabilities that would be managed easily by hydropower in reality. Given the key role a flexible hydropower fleet can play in sustaining future grid performance, understanding the limitations of hydropower representation in PCMs is a key research priority (Harby et al 2019).
This study introduces a practical and effective method for evaluating PCM hydropower dispatches for a set of interconnected hydropower plants through a common river system (watershed) within a larger power grid with a diverse generation portfolio. The evaluation is performed by trying to match the PCM hydropower dispatches with a separate detailed river routing—reservoir operations—hydropower model for those plants.
We demonstrate this method by evaluating the feasibility of large-scale simulated hydropower dispatch produced by a typical PCM, GridView (GV), for a key hydropower fleet of the U.S. Western Interconnection. This evaluation exercise, which we refer to as a 'feasibility test,' asks whether hydropower generation simulated by a grid-scale PCM is feasible, meaning consistent with the local hydraulic conditions and water-related operating constraints and objectives. We conduct the feasibility test on the 'Big 10' hydropower plants on the Columbia and Lower Snake Rivers in the NorthWestern United States.
2. Methods
2.1. Overview, domain, and tools
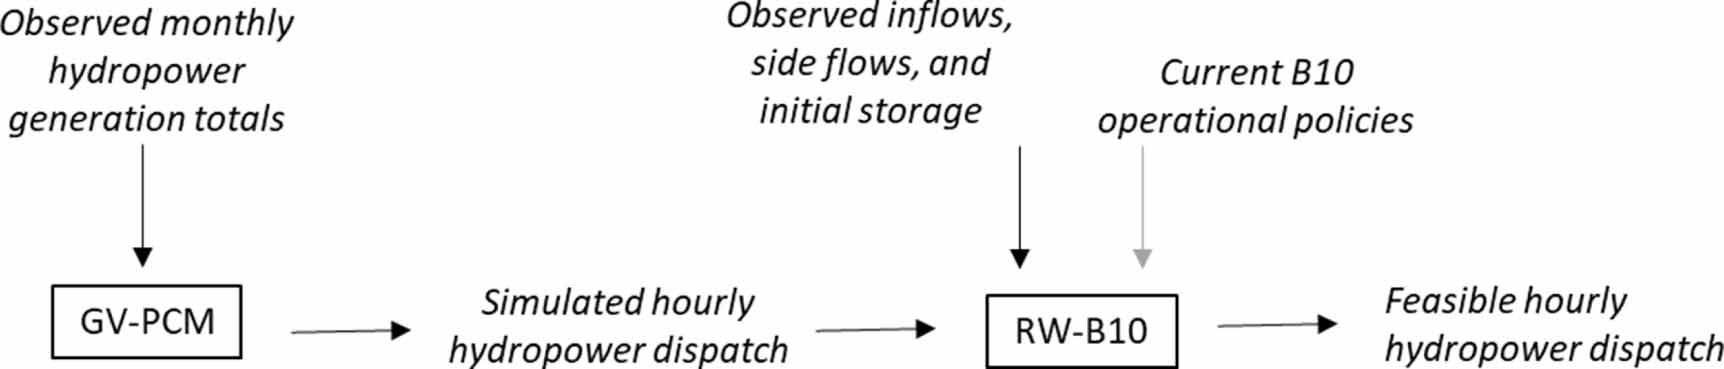
Our approach for evaluating hydropower dispatches in a PCM is to drive a detailed hydropower system optimization model with the hourly generation simulated by the PCM. The PCM produces hourly generation for all power plants on the grid, including the hydropower plants studied. The detailed hydropower model accounts for important water-related constraints that are not directly considered or are over-simplified in the PCM, including water balances, river routing and other physical, water-related and power generation characteristics as well as water-related and power-related operating constraints. To perform this exercise, we formulate the objective in the detailed hydropower model to target the PCM generation simulated for each plant in the system. For a given plant, a feasibility error is registered whenever the detailed hydropower model cannot meet the generation schedule from the PCM. The hydropower model is constrained to minimize unrequired spill prior to trying to match PCM generation. The study is conducted using the GV PCM (Yang et al 2003) model of the Western Interconnection and a RiverWare® model (Zagona et al 2001) of the Big 10 system (figure 1).

Figure 1. Model Sequence: GV-PCM is the GridView model of the Western Interconnection. RW-B10 is a RiverWare model of the Big 10 hydropower system. RiverWare is tasked to match GridView hydropower plant dispatch while meeting environmental regulations and other priority water uses.
Download figure:
Standard image High-resolution image2.1.1. The Big 10 hydropower system
The Big 10 includes a fairly large storage project in the Mid-Columbia (Grand Coulee—largest power plant in the United States by nameplate capacity) and nine large run-of-river hydropower plants in the Columbia and Snake Rivers (figure 2). The combined nameplate capacity of the ten projects represents ∼40% of total conventional hydropower capacity of the Western Interconnection. The system of cascading reservoirs operates as a coordinated system, featuring extensive nonpower requirements, including seasonally varying spill and forebay elevation requirements. Grand Coulee is the only plant in the Big 10 with significant reservoir storage capacity, but it is fed by larger upstream reservoir storage. It is drafted and filled on a seasonal basis for flood control and other water-related purposes. The other nine reservoirs operate as run-of-river on a daily basis but have enough storage capacity to allow for shaping of generation within the day. Given the limited storage capacity in the other reservoirs, the releases from Grand Coulee control the amount of water in the Lower Columbia River at a daily timescale, and are often driven by water-related requirements at downstream projects (Leonard et al 2015).
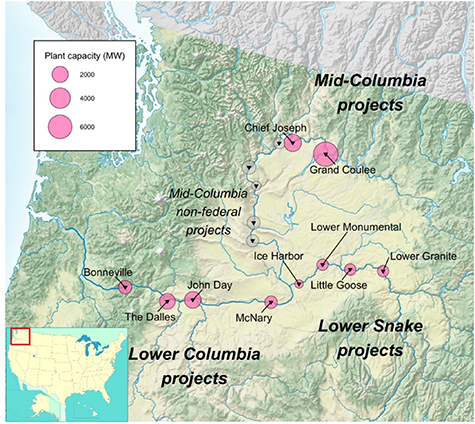
Figure 2. BPA 'Big 10' hydroelectric power plants of the Columbia River Basin. Non-federal projects (grey) are excluded in this study. The storage capacity of the five projects is relatively small, so on a daily basis, the outflow from the project at the downstream end of the Mid-C nonfederal projects approximately equals the outflow from Chief Joseph plus any intervening local inflows. In this study, these five projects are represented as a single, composite reservoir where outflow equals inflow at a daily timescale with a constant hourly flow within each day.
Download figure:
Standard image High-resolution image2.1.2. PCM model: GV-PCM
The PCM adopted in this study is a GV model of the Western Interconnect. GV is a unit commitment economic dispatch model commercialized by ABB Hitachi that minimizes the power system operating costs of meeting electricity demand and reserve requirements while respecting system-level and unit-level constraints. Operating costs account for generating units' variable costs, including fuel costs and start-up/down costs. In GV, units are dispatched at an hourly time step according to their variable cost, subject to minimum up/down times and ramp rate constraints. Hydropower generation at each plant is constrained by minimum and maximum generation capacity, monthly energy targets, and ramp rate constraints. Hydropower generation is modeled with a combination of proportional load following and hydrothermal co-optimization with the rest of the grid (Dennis et al 2011). This is representative of most commercial operational PCMs (Dennis et al 2011, Oikonomou et al 2022).
In this study, GV is set up with the WECC 2028 Anchor dataset (WECC 2019), which contains a projection of fuel prices, new generation, generation retirements, transmission assets, and load growth in the ten-year planning horizon. The Anchor dataset represents 2009 observed monthly hydropower for all hydropower plants in the Western Interconnect. (For this study we made a minor enhancement to replace isolated 2008 values in the original set with 2009 values so that the set consistently used 2009 values.) Use of 2009 hydrology means that monthly energy targets for hydropower plants are equal to observed monthly generation for the year 2009. The objectives of this dataset were to represent hydropower monthly energy targets that were as close to average as possible. The monthly hydropower targets were provided by the utilities themselves. Using a single year of hydrologic conditions is the practice-to-date as many other scenarios are then evaluated as part of reliability studies. The year 2009 is considered a qualitatively average hydrological year across the Western Interconnect as measured by flow at the Dalles, OR and Sacramento, CA and by hydropower generation across California and the Pacific Northwest. This monthly representation is a commonly adopted approach in PCM studies to represent hydrological conditions for a particular year and to keep total monthly hydropower dispatch within a realistic bound (Oikonomou et al 2022). We refer to this GV setup as 'GV-PCM' for the remainder of this paper.
2.1.3. Detailed hydropower model: RiverWare (RW-B10)
The detailed hydropower model adopted for our study is an RW optimization model of the Big 10 hydropower system using contemporary river operating policies. RW is a general river, reservoir, and hydropower modeling tool that is used widely by water management agencies and hydropower utilities, as well as federal, state and municipal agencies, NGOs, and researchers (Zagona et al 2001). The RW Big 10 Model used for this study is similar to the day-ahead scheduling model used operationally by Bonneville Power Administration (BPA) with minor changes to facilitate this study. We hereafter refer to this set up as RW-B10. The timestep size of the model is one hour—consistent with GV-PCM.
RW-B10 represents all of the operational detail needed for water operations, specifically the realistic movement of water between projects, and up-to-date local regulatory requirements (BPA, 2020). In this study, RW-B10 reservoir storages are initialized with observed storage for the start of 2009 and then forced with observed reservoir inflows consistent with the 2009 hydrological year. Reservoir inflows include the observed inflow time series for dams at the head of the system (Grand Coulee on the Columbia; Lower Granite on the Snake) and calculated side flows (unregulated tributary flows) for downstream dams. The simulated travel times in the model for routing of water from one hydropower project to the next range from 1 h to 11 h and are based on BPA's operational experience and are embedded in BPA's models that they use for hourly operations.
In our study, reservoir elevations are constrained to match the historical end of week forebay elevations, and these constraints serve two purposes. First, they give the RW-B10 optimization reasonable foresight comparable to operational forecasting, but not perfect foresight. Second, the elevation constraints capture seasonal operations at Grand Coulee, such as drawdown for flood control. The constraints have minimal impact on the other projects given their limited storage capacity. A potential objection to these constraints is that it is unreasonable to compare the RW-B10 with weekly elevation constraints which effectively constrain weekly energy while the GV-PCM has only monthly energy targets. However, the weekly targets reflect historical operational variations within the month to meet high priority constraints. To the extent that the weekly allocation of energy is not met by GV-PCM it is an argument for moving from monthly energy budgets to weekly budgets in the PCM.
Local regulatory constraints in RW-B10 include non-powered water release requirements to support juvenile fish passage. These 'fish spill' requirements apply to the eight Lower Snake and Lower Columbia projects from early April through August in three separate operational seasons: spring spill, summer spill, late summer spill. The spill requirements in the model reflect the regulations for the year 2020, which require significantly more spill for fish passage than was required in the historical data from 2009—resulting in less hydropower.
RW-B10 utilizes RW's optimization solver (Eschenbach et al 2001), which employs a preemptive linear goal programming solution. The operating policy of the basin is formulated as a set of prioritized goals. One type of goal contains a set of soft constraints. For example, elevation limits, flow limits or the spill requirements described earlier are expressed as soft constraints. When the goal contains soft constraints, RW derives an objective function to maximize the satisfaction of these constraints. Alternatively, a goal can contain an objective function (to be maximized or minimized). The optimization solves a linear program at each priority. Each solution is a global solution, solving for all variables at all timesteps simultaneously. After each priority, RW effectively locks-in the objective function before advancing to the next priority. In this way higher priority operating policies are not compromised for the sake of lower priority policies. RW provides an analysis tool that reports which constraints are binding in an optimization solution, specifically which policies contribute to the PCM generation being infeasible in the RW solution.
2.2. Experimental set-up for a hydropower feasibility test
For water operations, RW is typically set up to optimize generation under soft environmental and other water uses constraints. Our hydropower feasibility test is designed to identify periods of hydropower generation in GV-PCM that are not feasible once the more realistic constraints included in RW-B10 are considered. Feasibility error is evaluated by running RW-B10 with soft constraints to match the generation from GV-PCM at each project (p) and at each hour (h)

For this study, RW-B10 is formulated such that the constraints to match the target generation from GV-PCM are at a lower priority than all water-related constraints. If it is not possible to fully satisfy the water-related constraints and meet the target generation together, the solution will deviate from GV-PCM generation in order to meet the higher-priority water-related constraints. As a result of this formulation, all feasibility error is represented by deviations from GV-PCM generation. In theory, these deviations can take two forms: over-generation (PCM generation is too high) and under-generation (PCM generation is too low) (equation (2))
Our results contain both over-generation and under-generation. However, in this study the latter happens to be comparatively negligible and so we focus solely on feasibility error as defined by PCM over-generation.
2.3. Sources of feasibility errors other than 2020 spill policy
The results of the experiment described above inform on the total feasibility error of GV-PCM relative to a detailed hydropower model (RW-B10) that includes realistic water balance, water storage and transport between dams, and up-to-date policy constraints. These results, however, do not provide quantitative evidence on the relative importance of different causes of feasibility error.
Investigation of the initial results revealed that a spill policy change that was not reflected in the PCM input data was a major source of error in PCM results. The 2020 spill policies included in RW-B10 require significantly more spill for fish passage than was required in 2009—meaning the 2009 monthly hydropower generation targets used to constrain GV-PCM likely request too much energy from the Lower Columbia and Lower Snake plants during spring months. It is important to note that there was no a-priori reason to expect that the PCM data was lacking any significant policy change. Only the use of a detailed water model was able to determine a policy change was not reflected in the PCM data and to pinpoint it to a change in spill policy. With this posterior knowledge, future PCM runs for this area could use data that reflected the spill policy change by using data only from years after the change was made. (The PCM cannot directly model spill policy.)
These initial results led us to extend our initial RW experiment to perform an additional simulation of RW-B10 designed to isolate the influence of the 2020 spill policies on feasibility error. We determine the impact of spill policy on feasibility error by running RW-B10 with observed 2009 hourly generation as the target. Any feasibility error arising from this experiment can be attributed to two sources: 2020 spill policy and error in RW-B10 representation of the hydropower. Any feasibility error in the GV-PCM experiment that is residual to this may be assumed to arise due to other limitations of the PCM discussed in the following sections.
3. Results and discussion
3.1. Hydropower feasibility error in the Big 10
Comparing GV-PCM generation against RW-B10 generation reveals substantial feasibility error (figure 3). Over the full simulation period of one year, the total non-feasible generation exposed by RW-B10 is approximately 6000 GWh—9% of hydropower generation in GV-PCM for the Big 10 projects. This feasibility error is distributed non-uniformly throughout the year, with the three-month spring period April through June accounting for almost two-thirds of total annual feasibility error. Approximately 20% of GV-PCM hydropower generation in April and May is infeasible in RW-B10. Lowest relative (and absolute) feasibility error occurs in September—which is also the month of lowest total hydropower generation in both models. January, in contrast, features high overall generation and low feasibility error.

Figure 3. Big 10 aggregated generation for GV-PCM (production cost model) and RW-B10 (detailed hydropower model). Feasibility error is given as % overgeneration, GV-PCM (grey) relative to RW-B10 (blue).
Download figure:
Standard image High-resolution imageFeasibility error is also distributed non-uniformly across plants in the Big 10 system (figure 4). Grand Coulee is the largest plant analyzed, contributing ∼30% of total Big 10 generation in GV-PCM. However, Grand Coulee contributes only 16% of total feasibility error. The eight run-of-river plants in the Lower Snake and Lower Columbia account for 78% of feasibility error. In the Lower Columbia (∼42% of total feasibility error) we observe a clear contrast between spring (April, May, June) and the remainder of the year. Winter GV-PCM generation is relatively high, but—in the most part—matched in RW-B10. In contrast, the high and relatively stable daily GV-PCM generation through spring cannot be sustained in RW-B10.
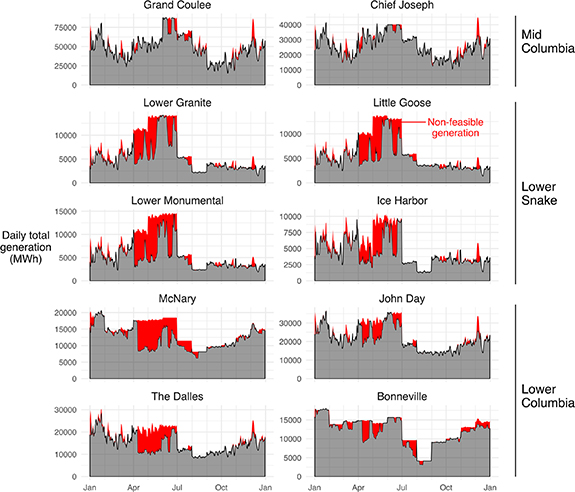
Figure 4. Daily totals of RW-B10 generation (grey) and feasibility error (red) highlighting over-generation by GV-PCM.
Download figure:
Standard image High-resolution image3.2. Causes of feasibility error and implications for PCM studies
A significant portion of GV-PCM feasibility error arises because RW-B10 includes contemporary spill policies. Our additional RW-B10 simulation using observed 2009 generation (section 2.3) allows us to estimate the contribution of increased fish spill requirements on total feasibility error. We find that two-thirds of total feasibility error is caused by contemporary spill policy (primary cause) and RW-B10 error (figure 5).

Figure 5. Feasibility Error. Each bar displays the total feasibility error (over-generation) in GV-PCM. The grey component shows the feasibility error primarily attributable to 2009 vs. 2020 spill policy. The red bar shows feasibility error due to all remaining sources of error in the PCM.
Download figure:
Standard image High-resolution image
It is common for the water-related requirements of a hydropower system to change over time due to updated biological opinions, environmental assessments, or other updates to legal obligations. When such a significant policy shift occurs, it warrants an adjustment to the parameters in the PCM (energy totals, minimum and maximum generation) for the affected hydropower projects. In the case of the modifications to Big 10 spill requirements, it may be possible to convert the additional spill flow required to the corresponding reduction in energy and maximum generation to provide a reasonable representation of the updated operating limits. The appropriate adjustments for other policy changes would be specific to the nature of the policy modification and would vary by river system.
The residual feasibility error after accounting for the effects of spill policy equals approximately 3% of total GV-PCM Big 10 generation (red portion of feasibility error in figure 5). This residual error is due to the interaction of river system dynamics and policy constraints at a finer time scale, such as minimum and maximum flow, reservoir elevation limits, spill requirements, and lag times, that are not captured by GV-PCM. One cause of much of this error is the distribution of energy within each month by the PCM, which cannot account for the finer time scale interactions of river system dynamics and policy. One example of constraints at a finer time scale is a daytime maximum flow limit of 120 kcfs (3398 m3 s−1) at Bonneville dam, at the downstream end of the system, to support chum salmon spawning in November and December. Due to the limited storage capacity at the Lower Columbia projects, this effectively limits flows, and subsequently generation, throughout the cascading system. Figure 4 shows very high GV-PCM generation for a period in early December (about one week) at most of the projects, much of which is infeasible in RW-B10 due to the Bonneville flow limits, then relatively low generation the following week. The total generation across the two weeks may be feasible, but the constraints in RW-B10 would require it to be more evenly distributed. In other cases, the opposite may occur. The PCM generation distribution may be relatively constant across a month, whereas rapidly evolving flow conditions, such as during spring runoff, may require generation to be concentrated in shorter time periods. Possible reasons for inability of RW-B10 to match observed generation during months outside spring include planned and forced unit outage, special operations, other one-time considerations, and responses to real time information like flow forecasts or hydropower curtailment needs to integrate wind generation resources.
While the chum spawning flow limits are specific to Bonneville, many hydropower projects have similar flow restrictions for specific days or times of day that restrict generation in those time periods. Other possible reasons for residual inability of RW-B10 to match observed generation during months outside spring include planned and forced unit outage, special operations, other one-time considerations, and responses to real time information like flow forecasts or hydropower curtailment needs to integrate wind generation resources.
3.3. Limitations for generalizing results on feasibility error
There are two other potential PCM deficiencies—not observed in our study—which could cause feasibility error in a PCM representation of a cascade hydropower system: monthly parameters and lag times between reservoirs with limited storage. The prospect of these deficiencies means that our finding of approximately 9% feasibility error in this system could be small relative to other systems or PCM configurations that have these additional deficiencies.
The first deficiency is the monthly specification of parameters (minimum, maximum, and total generation) that constrain the PCM scheduling of hydropower may allow too much latitude for the PCM to move a single project's generation within a month. For example, a project that has adequate storage available and high flexibility in the timing of generation could shift generation by days or weeks within a month while a downstream project relying on water from the upstream project may not have that flexibility. To illustrate, in the Big 10 system the Lower Columbia projects do not have sufficient storage to shift significant energy across weeks. Their generation is limited primarily by what is released from Grand Coulee and, to a lesser extent, what comes from the Snake River. In other words, allowing the Lower Columbia projects to generate in a way that is inconsistent with releases at Grand Coulee would over-estimate their operational flexibility. The GV_PCM in this study constrained projects to load following at an hourly level. This prevented substantial load shifting at an hourly level and therefore prevented inconsistent shifts of energy for projects at larger time scales. Specifically, the issue is avoided for the Big 10 in GV-PCM because load following behavior coded into the GV–PCM scheduling for the Big 10 dams forces them to ramp up and down in unison at the hourly time scale—guaranteeing that consistency across plants is preserved at longer time scales. If the load following behavior were removed from our study, as may be the case for other PCM models, an even larger feasibility error would occur.
The second deficiency can occur as a result of extreme and correlated peaking by individual plants, including extreme load following, which can lead to infeasibility at short time scales due to lag times needed to deliver water between plants with limited storage. The water generated on peak by one plant may not arrive until much later at a downstream plant, but the PCM does not recognize this physical water conveyance constraint; instead, the PCM is allowed to dispatch all resources in the cascade system at maximum generating capacity at the same time, resulting in unrealistic flexibility when the generation at a downstream plant is constrained due to lack of water, and may only reach maximum after a time lag following generation and release at an upstream plant. This potential issue is avoided in GV-PCM through the imposition of tight constraints on maximum and minimum hourly generation at each plant. This prevents the problem because less extreme generation leads to smaller water storage requirements. The trade-off is that these plants may often be over-constrained—leading to an underestimation of the operational flexibility of the system in the PCM.
The major source of feasibility error (over generation) in our study is the updated spill policy. This inconsistency between PCM generating targets and realistic, up-to-date operations applies to any PCM study for which (a) historical, plant-level generation profiles for a particular year are used for energy targets (whether monthly or sub-monthly), and (b) the operations at those plants have changed since the historical year adopted in the PCM study. The policies that changed in our specific case study relate to spill requirements, but there are other possible constraints on a river system that could impinge on hydropower generation (e.g. environmental flows, flood control, recreation, new water demands, new infrastructure). For the BPA Columbia River System projects (including the ten studied here), a new environmental impact statement has been issued that is leading to development of new monthly hydropower targets (USACE 2020). Its impact on monthly hydropower generation targets and further onto power flow modeling has also been evaluated, albeit not from a power grid reliability perspective. Further testing of the impact of updated river and reservoir policies at higher resolution would be required to gain more insight into the associated impacts on feasibility error and PCM performance. However, our results demonstrate that reservoir policies can be a major source of feasibility error (over and under generation) in a PCM. Updating reservoir policies across a large fleet of hydropower plants (such as the ∼500 hydropower plants serving the U.S. Western Interconnect) presents a significant challenge for PCM users. The PCMs do not directly model water policies and instead must rely on historical data for operation of the hydropower plants. The PCM users generally do not know when policy changes have taken place that may cause the historical data to incorrectly characterize the capability of the data to reflect hydropower operations.
Another potential source of feasibility error is related to the selection of 2009 as the year used to project hydrology into the future decade. As explained in section 2.1.2, this study has adopted the common WECC 2028 Anchor dataset projection practice of selecting the year in the past decade that is closest to average with respect to hydropower generation; this year will also likely reflect hydrologic conditions that are closest to average over the Western Interconnect. Selection of a different year would likely result in different feasibility error results, and likely that the results would be greater feasibility errors since more extreme hydrologic conditions in either direction result in greater constraints on the system. Our purpose is to investigate the results for the typical application of this PCM methodology.
4. Conclusions
Detailed modeling of multi-purpose reservoirs with river operations models can measure feasibility errors in standard power grid operations modeling PCM of hydropower generation. In our experiment over the Big 10 projects of the Columbia River Basin, we estimated that 9% of the generation—based on average hydrologic conditions—dispatched by a PCM was infeasible. The largest single cause of feasibility error in the PCM in this case study, accounting for two-thirds of the feasibility error, is updated river regulations—namely increased spill requirements at several dams. The other one-third is associated with the oversimplified representation of hydropower in the PCM, which could be partially addressed with a representation of sub-monthly water management. One implication of our analysis is that PCMs that adopt historical monthly generation totals are potentially fallible if one wishes to represent the availability and flexibility of hydropower under contemporary policies. In our case study, changes in spill requirements caused feasibility error, but there are other possible constraints on a river system that could change over time and could impinge on hydropower generation (e.g. environmental flows, flood control, recreation, new water demands, new infrastructure). For the federal hydropower projects, new environmental policies are already being considered to develop new monthly hydropower targets. Modification of the PCM inputs to reflect policy changes and other insights from a detailed water model has the potential to greatly improve PCM modeling of hydropower capability and thus PCM results in general. Alternatively, a simplified representation with weekly hydropower potential and flexibility could reduce feasibility error without the need for detailed river system models applied across a large grid. Going to sub-weekly time scales would require data supporting clear patterns.
Acknowledgments
The research was supported by the HydroWIRES Initiative of US Department of Energy—Water Power Technologies Office (WPTO) Grant 75563. The RiverWare modeling portion of the study was configured and executed by the Center for Advanced Decisions Support for Water and Environmental Systems (CADSWES) at the University of Colorado Boulder. The GridView WECC 2028 simulations were conducted by Pacific Northwest National Laboratory (PNNL). This work was co-authored by the Pacific Northwest National Laboratory, managed by Battelle (Contract No. DE-AC05-76RL01830) for the U.S. Department of Energy.
Data availability statement
Updated versions of RiverWare are released on a regular basis. The RiverWare 8.3.2 Patch Release (released 2 September 2021) was used for this study. Details about RiverWare can be found in the RiverWare User's Guide at https://riverware.org/HelpSystem/index.html.
The data generated and/or analyzed during the current study are not publicly available for legal/ethical reasons but are available from the corresponding author on reasonable request.