

Abstract
Hydropower is an important source of renewable, low-carbon energy. Global and regional energy systems, including hydropower, may evolve in a variety of ways under different scenarios. Representation of hydropower in global multisector models is often simplified at the country or regional level. Some models assume a fixed hydropower supply, which is not affected by economic drivers or competition with other electricity generation sources. Here, we implement an endogenous model of hydropower expansion in the Global Change Analysis Model, including a representation of hydropower potential at the river basin level to project future hydropower production across river basins and explore hydropower's role in evolving energy systems both regionally and globally, under alternative scenarios. Each scenario utilizes the new endogenous hydropower implementation but makes different assumptions about future low-carbon transitions, technology costs, and energy demand. Our study suggests there is ample potential for hydropower to expand in the future to help meet growing demand for electricity driven by socioeconomic growth, electrification of end-use sectors, or other factors. However, hydropower expansion will be constrained by resource availability, resource location, and cost in ways that limit its growth relative to other technologies. As a result, all scenarios show a generally decreasing share of hydroelectricity over total electricity generation at the global level. Hydropower expansion varies across regions, and across basins within regions, due to differences in resource potential, cost, current utilization, and other factors. In sum, our scenarios entail hydropower generation growth between 36% and 119% in 2050, compared to 2015, globally.
Export citation and abstract BibTeX RIS
1. Introduction
Hydropower is currently the world's largest source of renewable power generation, accounting for 16% of the world's total electricity supply in 2019. In comparison, electricity production from all other renewable sources accounts for 10% of the world's total in 2019 (International Energy Agency 2022). Hydropower production is not evenly distributed across the globe; China, Brazil, Canada, and the USA accounted for 52% of the world's total hydropower capacity (56% of generation) in 2020 (US Energy Information Administration 2021). Sub-nationally, China's Yangtze River basin has the largest hydropower capacity, which continues to expand and will contain approximately 18% of the world's total hydropower capacity in the foreseeable future (Zarfl et al 2015, Brinkerink and Deane 2020). The role of hydropower in energy systems also varies regionally. For example, Norway received 92% of its electricity from hydroelectric sources in 2020, whereas in the top four hydropower capacity countries, the value ranges from 7% in the USA to 66% in Brazil (US Energy Information Administration 2021).
In addition to the prominent role of hydropower in many energy systems, the greenhouse gas (GHG) emissions from hydropower are relatively low compared to other energy sources such as fossil fuels (IPCC 2014). Despite the debate around the significance of GHG emissions from reservoirs such as methane from decomposition of organic matter in flooded areas and underestimated emissions from tropical dams (Fearnside 2015), the Intergovernmental Panel on Climate Change (IPCC) noted hydropower's low global carbon footprint in its Fifth Assessment Report, stating that only wind and nuclear power have lower median lifecycle GHG emissions than hydropower (IPCC 2014).
Future hydropower expansion could be driven by various factors such as the cost and performance of alternative generation technologies, end-use electrification, growing energy demand, or decarbonization. Global and regional energy systems, including hydropower expansion, may also evolve in a variety of ways under alternate futures. Current and future global hydropower generation and capacity expansion can be simulated using a variety of modeling approaches, three of which we discuss here. One approach, not explored here, is to focus explicitly on modeling hydropower. This typically involves producing climate- and cost-driven estimates of potential or actual historical and future hydropower generation based on physical and economic details like hydroclimatology, topography, and dam site locations or suitability (Turner and Voisin 2022). This approach has the potential to represent hydropower with high fidelity, but lacks immediate connection to the broader electricity system, and its interactions with the water and agriculture sectors. A second approach, also not explored here, is to deploy a model focused only on the electricity system. Models in this category can have different foci, including daily or sub-daily operations (e.g. Brinkerink et al 2021) or long-term capacity expansion planning (e.g. Niet et al 2021). However, applications of this approach at national or power grid scale have thus far been more common than global scale applications, and they do not capture the dynamic interaction between the electricity system and end-uses that consume electric power.
A third approach, and our focus in this paper, is to use a global, integrated multi-sector model. There are several such models that fall into this category, typically representing the main features of interlinked human and earth systems and their long-term future co-evolution at aggregate spatial and temporal scales. This approach has several advantages, including being designed to operate at global scale, ability to explore how the electricity sector evolves through interaction and competition with other sectors (e.g. water and agriculture), and the ability to leverage outputs from climate-driven hydropower modeling exercises (e.g. hydropower potential and cost). A key challenge with using global integrated multisector models to explore hydropower futures has been that they sometimes assume a fixed trajectory of hydropower supply due to challenges with modeling hydropower at aggregate spatial and temporal scales (Arbuckle et al 2021). That is, future hydropower production is defined exogenously and therefore does not dynamically compete with other electricity generation sources or interact with other socio-economic, technical, or policy drivers (e.g. energy demand, technological improvement, and decarbonization). Our study seeks to advance the representation of hydropower in global multisector models by endogenously representing hydropower within the model.
Table 1 provides an overview of several integrated multisector models and their representations of hydropower. Several models represent hydropower exogenously in their latest official versions that are available to the public. However, a few studies have modified the official versions and represented hydropower endogenously to study the role of hydropower along with other renewable energy sources in energy systems evolution. For example, Gernaat et al (2021) studied the effects of climate change on renewable energy supply; the authors integrated cost-supply curves for hydropower and other renewables in 26 regions into the Integrated Model to Assess the Global Environment (IMAGE; table 1) using 30 year average hydropower resource potentials with and without climate change. Arbuckle et al (2021) implemented endogenous hydropower expansion in a regional version of the Global Change Analysis Model (GCAM; table 1), i.e. GCAM-Canada; the authors modeled hydropower resources at the country level and studied the effects of project cost overruns on hydropower generation in Canada.
Table 1. Global integrated multisector models and their representations of hydropower in their publicly available official versions.
| Model | Modeling approach | Endogenous hydropower | Spatial resolution of hydropower resource potential | Citation |
|---|---|---|---|---|
| AIM | Recursive dynamic, partial equilibrium | No | — | Hanaoka et al (2015) |
| GCAM v5.3 | Recursive dynamic, partial equilibrium | No | — | Calvin et al (2019) |
| IMAGE | Recursive dynamic, partial equilibrium | No | — | Stehfest et al (2014) |
| WITCH | Intertemporal optimization, general equilibrium | No | — | de Cian et al (2009) |
| MERGE | Intertemporal optimization, partial equilibrium | Yes | 10 regions | Marcucci and Turton (2012) |
| MESSAGE | Intertemporal optimization, general equilibrium | Yes | Global | Krey et al (2020) |
| POLES | Recursive dynamic, partial equilibrium | Yes | Global | Després et al (2018) |
| REMIND | Intertemporal optimization, general equilibrium | Yes | 11 regions | Luderer et al (2015) |
| TIAM-UCL (TIMES) | Intertemporal optimization, partial equilibrium | Yes | 16 regions | Pye et al (2020) |
| GCAM* | Recursive dynamic, partial equilibrium | Yes | 32 region × 235 river basin level | This study |
a Hydropower production is an endogenous variable in the model and therefore dynamically competes with other electricity generation sources or interacts with other socio-economic, technical, or policy drivers.
Other integrated multisector models already have hydropower endogenously represented in their official versions (table 1); however, to our knowledge, no studies applying these models were focused on hydropower expansion. Additionally, the hydropower representations in these models are often simplified at the country or regional level (table 1). As the remaining hydropower resource potential for future expansion can vary within a region, representation of hydropower endogenously at a finer spatial scale (e.g. river basin scale) can more accurately capture the dynamics of hydropower expansion.
In this study, we implement an endogenous model of hydropower expansion in GCAM (GCAM*, table 1), including a representation of hydropower potential at the river basin scale to estimate the impact of demand, policy, and technology drivers on future hydropower production across river basins and hydropower's role in evolving energy systems both regionally and globally. To our knowledge, no study has yet modeled hydropower endogenously at the basin scale in global integrated multisector models. Our study advances the understanding of future hydropower expansion by combining (a) competition between hydropower and other electricity generation technologies (which hydropower-centric studies fail to capture); (b) dynamic interaction between the electric power sector, other energy supply sectors, and energy end-use sectors (beyond the scope of power-sector modeling); and (c) a more accurate representation of hydropower at the river basin scale (a gap in other integrated multisector modeling studies). Further, our work sets the stage for many important lines of future research, particularly given hydropower's intersection with multiple sectors and systems. For instance, hydropower expansion could support water use for irrigation, affect regional teleconnections through electricity and agricultural trade, and offer an option to store energy in the form of water. Beyond electric power and water storage, hydroelectric dams provide other important services such as flood control, recreation, and navigation. Future work could consider quantifying these benefits as well as the negative externalities such as impacts to fisheries and displacement of indigenous populations and agriculture, although these impacts are highly-site specific.
Here, we address the following questions:
- (a)How might hydropower production expand in the future?
- (b)How might hydropower expansion vary geographically, at regional and river-basin scales? What are the key drivers of this regional variation?
- (c)How might different demand, policy, and technology drivers impact this expansion?
We analyze the temporal pathways and spatial patterns of hydropower expansion across global, regional, and basin scales, focusing on hydropower resource potential and competition between hydroelectricity and other power generation sources.
In the following sections, we first present our method on modeling basin-scale hydropower expansion in GCAM. (A comparison of the updated hydropower outputs to the default fixed output in GCAM and other integrated multisector models' hydropower outputs can be found in the supplementary materials.) We then present the results under several alternate scenarios of future energy-system drivers. Lastly, we discuss potential future work.
2. Method
2.1. Global Change Analysis Model (GCAM)
We incorporated endogenous hydropower in GCAM version 5.3 (publicly available at https://github.com/JGCRI/gcam-core/releases/tag/gcam-v5.3). GCAM represents integrated economy, energy, agriculture/land, water, and climate systems and runs at 5 year time steps through 2100. There are 32 geopolitical regions modeled for economic and energy systems (table S1), 235 basins for water systems, and 384 regions for land systems. Hydropower production is exogenously defined at the 32 geopolitical regional level in the default GCAM v5.3 (table 1), with historical production based on the World Energy Balances data set (International Energy Agency 2019) and future production generally consistent with the long-term economic potential identified by International Hydropower Association et al (2000). In addition to hydropower, several other depletable (e.g. coal, oil, natural gas) and renewable (e.g. solar, wind, biomass, geothermal) resources are available for generating electricity. Most resources have several power plant technology options that compete for market share based on their technological characteristics.
Electricity competes with other energy carriers (e.g. refined liquids, gas, coal, biomass, hydrogen) for the provision of energy services in building, industry, and transportation end-use sectors. Socioeconomic drivers (population and gross domestic product (GDP)) set the scale for demand for these end-use services. Within global commodity markets (e.g. primary fuels, agricultural goods), energy transformation sectors, and end-uses, competition occurs on the basis of relative costs using a probabilistic logit formulation reflecting a distribution of realized costs (Clarke and Edmonds 1993). Historical outcomes are used to calibrate parameters which capture characteristics like preferences and infrastructure which are not explicitly modeled but nevertheless impact technology choice historically and into the future. GCAM solves for market equilibrium (i.e. the price where supply equals demand) of all markets (other energy, water, land, emissions) simultaneously.
2.2. Implementation of endogenous hydropower in GCAM
In our endogenous hydropower module for GCAM, hydropower technologies are represented at the water basin level within each GCAM region (i.e. the 32 geopolitical regions). That is, hydropower technologies are created for each water basin that lies partially or completely within a GCAM region, resulting in a total of 293 intersected regions (geopolitical region + basin combinations). In these region and basin intersections (hereafter referred to as 'region-basin'), we calibrate the model to historical hydropower production and allow for future hydropower expansion according to supply curves for hydropower resource potential. Within the electricity sector in each GCAM region, hydropower competes against other fuels to meet demand for power. Hydropower production in each GCAM region is further subdivided among the water basins within that respective region. Within each region, hydropower expansion competes among basins given costs and remaining resource potential. The overall implementation of endogenous hydropower is consistent with Arbuckle et al (2021), where endogenous hydropower is implemented for Canada in a version of GCAM, although the current approach is more spatially detailed (at the water-basin scale).
2.3. Input data
Below we briefly describe the key data sources and processing for creating our endogenous hydropower module in GCAM. For more details, please refer to the supplementary materials.
To incorporate hydropower potential at the region-basin level for consideration of future hydropower expansion, we use Zhou et al (2015)'s estimates of exploitable hydropower resource potential and resource cost at the site level, group them in each region-basin intersection according to their geolocations, and derive hydropower resource curves at the region-basin level 3 . This data has a complete global coverage, which is more extensive than other global hydropower resource potential data (e.g. Gernaat et al 2017—available only between 56° S and 60° N).
To calculate region-basin level historical hydropower production, we utilize installed capacity and capacity factor data at the dam level from the PLEXOS-World dataset (Brinkerink and Deane 2020), calculate the associated hydropower generation, and aggregate to the region-basin level. This was performed for each historical model period (e.g. 1975, 1990, 2005, 2010, 2015), given each dam's commissioning year from the World Resources Institute Global Power Plant Database (Global Energy Observatory et al 2018). We then use the calculated hydropower generation at the region-basin level as scalars to disaggregate the country-level historical hydropower production from International Energy Agency (2019), which is the original input data in GCAM v5.3. The 15 year average capacity factor at the dam level in PLEXOS-World, which uses country-level historical data from the International Renewable Energy Agency (2019) as a benchmark, is utilized to levelize capital and fixed operation and maintenance costs for hydropower under average conditions (e.g. average climate conditions). Information on hydropower technology costs is available in supplementary note 1.4.
To ensure capacity expansion is in line with anticipated growth in the near term, we restrain hydropower from expanding in region-basins with no dam under construction in the corresponding time period based on the Future Hydropower Reservoirs and Dams Database (FHReD with available dam completion year through 2028; Zarfl et al 2015). Additionally, we add the future hydropower capacity that is under construction from FHReD to the historical capacity from PLEXOS-World and then compare the combined capacity to the maximum hydropower resource potential in the resource supply curves. If the combined capacity is greater than the original maximum hydropower resource potential, we upscale the resource supply curves proportionally, to ensure that the resource supply curves cover the anticipated capacity additions in the near term. This adjustment is necessary because our study uses the most restrictive definition of hydropower potential in Zhou et al (2015)—'exploitable potential'—which excludes hydropower potential on protected lands. Thus, some region-basins have more existing or planned hydropower capacity than indicated in the original resource supply curves, as some sites fall in areas considered protected but are nevertheless being developed (e.g. Thieme et al 2020). Although the exploitable potential incorporated in this study excludes areas protected for their environmental or cultural values, we do not explicitly consider externalities, such as impacts to fisheries (Yoshida et al 2020), relocation of indigenous people (Trussart et al 2002), emerging efforts of environmental compensation and mitigation (Almeida Prado et al 2016), in the cost of hydropower expansion, which could reduce the magnitude and speed of hydropower expansion in the future. Finally, our modeling approach focuses on spatially detailed hydropower potentials and costs, but does not consider other factors that could impact future hydropower expansion, such as government policies or societal acceptance or resistance of new hydropower projects.
2.4. Scenarios
We explore hydropower expansion and its role in evolving energy systems under four scenarios (table 2). Each scenario utilizes the new endogenous hydropower implementation but is subject to different emission policy, technology cost, and energy demand drivers. The reference scenario (i.e. Ref) is intended to illustrate the global to region-basin level hydropower expansion and its variation geographically (i.e. Questions 1 and 2 in the Introduction section), and the other three scenarios are intended to demonstrate the expansion under policy, technology, and demand drivers compared to the reference (Question 3). Transition represents a global transition to a low-carbon energy system by 2050, an emission-related policy driven scenario. AdvTech represents advanced technological costs of several non-hydropower renewable power generation sources that are lower than the costs under Ref, a cost-improvement technology driven scenario. HighGrowth represents high growth in global GDP; despite lower population than the Ref, it is a high energy demand driven scenario.
Table 2. Scenarios.
| Scenario | Description |
|---|---|
| Ref | Default GCAM reference scenario with endogenous hydropower |
| Transition | Illustrative low-carbon transition scenario in which global CO2 emissions (from both the energy and terrestrial land use change systems) are constrained to reach net-zero in 2050. |
| AdvTech | Scenario with rapid technological advancements in solar, wind, and geothermal technologies such that their costs drop rapidly consistent with the Annual Technology Baseline 2019 'Low' case (Vimmerstedt 2019, National Renewable Energy Laboratory 2019). |
| HighGrowth | Scenario with population and GDP growth consistent with Shared Socioeconomic Pathway 5 |
a The fossil-fueled development pathway, along which population is 18% lower and GDP is 91% higher than the Ref globally by 2100.
These four scenarios were chosen to demonstrate this new model capability and key dynamics of the model rather than to evaluate specific policy, technology, or socioeconomic outcomes, although our model is readily applicable to extensive scenario analysis. Additionally, the scenarios in this study are simulated in 5 year time steps. Although this implicitly omits issues related to interannual and seasonal variability, our modeling is intended to capture the long-term trend of hydropower expansion. Future work could explore issues surrounding climate change impacts on water availability, and therefore hydropower production (e.g. Turner et al 2017, Voisin et al 2020, Turner and Voisin 2022), in more detail—particularly within the context of multisectoral models such as GCAM.
3. Results
In this section, we explore hydropower expansion at the global, regional, and region-basin level, respectively. Our scenarios extend to the end of the century (2100), although many of the regional and region-basin level results focus on outcomes in 2050 to explore geographic patterns of hydropower expansion over a more proximate time frame.
3.1. Future hydropower expansion at the global level
Globally, our results suggest both significant potential for hydropower expansion and limitations to hydropower expansion that prevent it from keeping pace with the overall growth of the power system. At the global level, total electricity generation in our Ref scenario roughly doubles in 2050 relative to 2015 (the final historical year for GCAM v5.3) (figure 1). Over the same period, hydropower production increases by 53%, with the share of hydropower in total electricity generation decreasing from 16% in 2015 to 12% in 2050 (figure 1).

Figure 1. Global results of (a) total electricity generation, (b) hydroelectricity generation, and (c) share of hydroelectricity over total electricity generation over 2015–2100. Note that y-axes are on different scales.
Download figure:
Standard image High-resolution imageHow hydropower production expands is affected by its competition with other power generation sources, which varies under different scenarios, and hydropower's own limited potential, which makes hydropower more and more expensive as the potential is exploited. Global total electricity and hydropower generation are higher under Transition and HighGrowth than Ref. Hydroelectricity generation and generation shares are higher in Transition than HighGrowth, indicating that incentives for low-carbon electricity to reduce emissions (Transition) 4 is a more powerful driver of hydropower expansion than total electricity demand increases (HighGrowth). The AdvTech scenario has the lowest hydroelectricity generation and hydropower share across scenarios (figure 1), suggesting that technological breakthroughs in competing technologies can limit demand for hydropower expansion. While hydropower expands significantly across our scenarios (36%–119% in 2050 relative to 2015), the share of hydropower in the electricity mix is lower in 2050 than 2015 under all scenarios (figure 1), suggesting that hydropower is not competitive as other technologies due to its limited resource potential and increasing costs as deployment expands.
While the amount of hydropower expansion varies widely across our scenarios, these hydropower expansion pathways are within the range of other recent studies at the global level. Supplementary figure S1 shows our four GCAM scenarios, along with GCAM's previous exogenously specified hydropower pathway (ExHydro), compared with scenarios from the US Energy Information Administration's 2021 International Energy Outlook (IEO), the International Energy Association's 2021 World Energy Outlook (WEO), and all scenarios from the IPCC database for scenarios considered in its Special Report on the impacts of global warming of 1.5 °C (IPCC SR15). Compared to the IEO and WEO, GCAM's near-term hydropower growth is slower, due to our conservative assumptions about new hydropower over the next decade, with hydropower expansion through 2030 limited to regions and basins where there are currently dams under construction. The IEO projects lower hydropower growth than the WEO; the IEO scenarios generally fall between the level of hydropower production in GCAM's AdvTech and Ref scenarios. The WEO anticipates greater hydropower production to 2050; GCAM's HighGrowth Scenario is consistent with the lower hydro WEO scenarios, while the Transition scenario has similar levels of hydropower as the highest WEO scenario. GCAM's Ref, HighGrowth, and AdvTech scenarios are all well within the range of the IPCC SR15 scenarios through 2100; the Transition scenario (which entails a global warming of 1.8 °C by 2050) is within the IPCC SR15 range by 2050, but has hydropower production exceeding all but a handful of scenarios from the SR15 database by 2100.
3.2. Future hydropower expansion at the regional level
The global trends we observed in terms of scenarios' impact on hydropower production are mostly consistent at the regional level. Transition leads to the largest hydropower expansion, followed by HighGrowth, Ref, and then AdvTech in all regions except for the European Free Trade Association (EFTA—consists of Iceland, Norway, and Switzerland), which has slightly larger hydropower expansion under HighGrowth than Transition (figures 2 and S2).
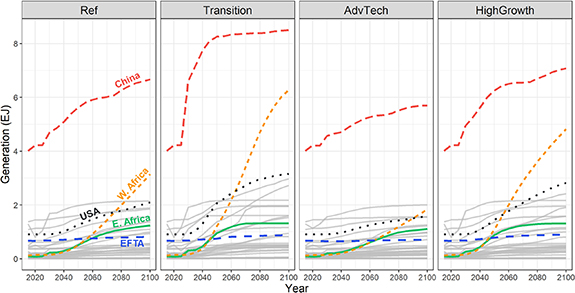
Figure 2. Regional results of hydroelectricity generation over 2015–2100 across scenarios. All regions are plotted with China, USA, Western Africa, Eastern Africa, and EFTA highlighted in different colors and line types, while all other regions are in grey solid lines.
Download figure:
Standard image High-resolution imageHowever, there are some temporal hydropower expansion differences across regions. For example, China is projected to account for most of the near-term global expansion under all scenarios (figure 2), driven by steady population and economic growth (and thus electricity demand growth) in the near-term. Nevertheless, during the second half of the century, the rate of hydropower expansion becomes the greatest in Western Africa as China's population wanes and economic growth decelerates while Western Africa's GDP grows exponentially over the second half of century (figure S3).
The spatial hydropower expansion also varies widely across regions, with absolute and relative growth in hydropower expansion by 2050 relative to 2015 ranging 0.001–1.6 EJ and 5%–434%, respectively, under Ref. Figure 3 shows the change in hydroelectricity generation in 2050 across our four scenarios. The largest hydropower expansion under Ref, in terms of absolute changes in 2050, is projected to occur in China, Brazil, and India. In China and India, hydropower expansion is driven by overall increases in electricity demand (figure S4) as rapid economic growth is expected over the next three decades (figure S3). Brazil's total electricity growth is more limited (figure S4), but it is a hydropower heavy country, where hydropower accounts for a larger share of new electricity generation met by hydropower than in India or China (figure S5). In contrast, the lowest hydropower expansion is projected to occur in South Africa, South Korea, and Eastern Europe, where population and GDP are relatively low (figure S3) and hydropower only contributes a small portion in total electricity generation (figures S5 and S6).

Figure 3. Hydropower expansion in terms of the absolute and percent changes in hydroelectricity generation (EJ) in 2050 compared to the base-year hydroelectricity generation in 2015 at the regional level. Absolute changes are visualized in colored bars corresponding to the top horizontal axis; percent changes are in point shapes corresponding to the bottom horizontal axis. Note that the regions on the vertical axis are plotted in descending order by the absolute changes under Ref.
Download figure:
Standard image High-resolution imageSome regions have smaller absolute hydropower growth than China, Brazil, and India, but nevertheless experience drastic increases in hydropower generation relative to their historical baseline (figure 3). For example, Eastern and Western Africa represent the greatest percent increase in electricity generation across scenarios, because both regions have a low electricity demand in 2015 and a rapid growth of the demand over 2015–2050 (figure S4). In addition, Western Africa has significant unexploited hydropower potential, while Eastern Africa has a relatively high share of hydroelectricity over the total electricity in the base year (figure S6). Therefore, both see large growth in hydropower across all scenarios.
Broadly, hydropower expansion at the regional level is influenced by the amount of remaining resource potential, hydropower costs, and overall electricity demand. Those patterns vary greatly across regions (figure 4). For example, China and Russia have similar levels of hydropower potential (figure 4), but very different resource quality and energy contexts. China has high and rapidly growing electricity demand as well as relatively low-cost hydropower resources. China is presently building large hydropower dams such as the Baihetan Dam in the Yangtze River basin to help meet growing electricity demand, and is projected to continue doing so in the future. In contrast, Russia has more than enough hydropower potential to meet all its electricity demand in 2050 under Ref. (For China, hydropower potential could only cover 25% of demand in 2050). However, Russia's projected hydroelectricity generation in 2050 (Ref) accounts for only 13% of its total electricity generation, utilizing less than 9% of its hydropower potential. A major portion of Russia's hydropower potential is in remote areas or areas which are more difficult (expensive) to exploit (see more details in section 3.3), and the country has ample and inexpensive natural gas resources. Additionally, Russia's electricity demand does not grow as quickly, meaning it does not need to build as much new capacity (hydropower or others) as China. These factors have prevented Russia from developing much hydropower historically, and limit future hydropower development in the region in our scenarios as well.
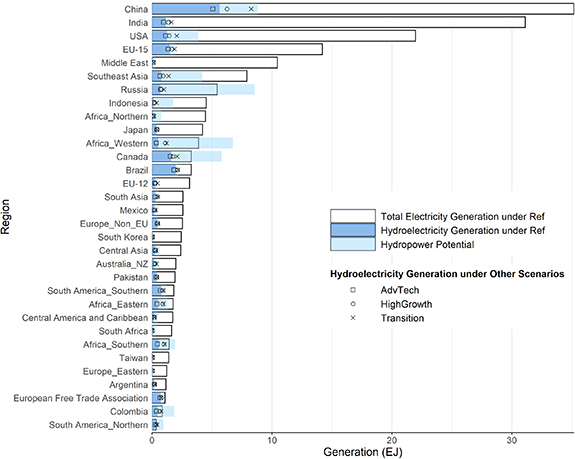
Figure 4. Regional results of total electricity generation and hydroelectricity generation in 2050 vs the maximum hydropower resource potential. Total electricity generation is shown for the Ref scenario in bars, while hydroelectricity generation is shown for all scenarios with Ref scenario in bars and other scenarios in point shapes. In supplementary materials, we evaluate physical constraints on projected hydropower expansion in the future in order to perform a quality check on the input hydropower potential and the associated hydropower production results, with additional discussion on hydropower potential in the USA.
Download figure:
Standard image High-resolution imageContrary to China and Russia, which have substantial unexploited hydropower resources, some regions have limited remaining hydropower potential. Out of these regions, some are associated with considerable total hydropower potential, but have already exploited most of their potential with high shares of hydropower in their electricity mix historically. For example, EFTA has already utilized 74% of its hydropower potential with 85% of its electricity coming from hydropower as of 2015; hydropower production increases slightly in 2050 under Ref, with 80% of hydropower potential exploited and 68% of its electricity coming from hydropower (figure 4).
3.3. Future hydropower expansion at the region-basin level
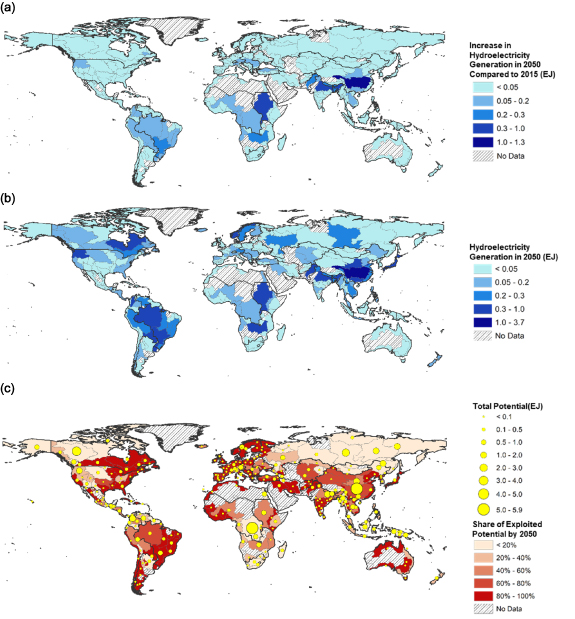
One of the main contributions of our study is representing and exploring hydropower potential (a key determinant of hydropower expansion) sub-regionally at the water basin level. Figure 5 shows the total hydropower potential across region-basins and highlights the ones with highly exploited potential as projected in 2050 under Ref. Correspondingly, region-basins with relatively large hydroelectricity generation in 2050 under Ref and the ones with large increases in the generation compared to 2015 are highlighted in figure 5 as well. Much of the global hydropower growth over the next three decades is driven by a few key basins. The top five hydropower expansion region-basins are the Yangtze River basin in China, the Ganges–Brahmaputra basin in India, the Nile basin in Eastern Africa, the Zambezi basin in Southern Africa, and the Indus basin in Pakistan (figure 5(a)), which in total contribute 36% of the global total hydropower expansion in 2050 under Ref compared to 2015.
Figure 5. (a) The increase of hydroelectricity generation in 2050 under Ref compared to the base-year generation in 2015, (b) the total hydroelectricity generation in 2050 under Ref, and (c) the corresponding share of exploited over total hydropower potential by 2050, across region-basins globally. Note that 'No data' means the region-basin has no historical hydropower production, no near-term dams under construction, and no hydropower potential as indicated in the data sources. The GCAM regions are bounded by thick black outlines.
Download figure:
Standard image High-resolution image
Region-basins that are projected to produce the top five largest amount of hydroelectricity in 2050 under Ref include the Yangtze River basin in China, the La Plata basin in Brazil, the Ganges–Brahmaputra basin in India, the Scandinavia North Coast in EFTA, and the Huang He basin in China (figure 5(b)), which in total contribute to 29% of the global total hydroelectricity generation.
Among all region-basins, the Yangtze River basin in China is projected to have both the largest hydropower expansion and the largest hydroelectricity generation in 2050 under Ref. It is the only region-basin that is projected to expand and produce hydropower above 1 EJ in 2050 under Ref, while all other region-basins are expanding and producing below 1 EJ.
Within each region, hydropower expansion competes among basins given costs and remaining resource potential. For instance, within China, most of the hydroelectricity generations are from basins in the south (figure 5(b)). Among them, the Yangtze River basin has the largest hydropower potential (figure 5(c)) and a relatively flat resource supply curve with generally lower costs than other competing basins (figure S7). In addition, the hydropower exploitation is around 50% (2.4 EJ) in the base year in the Yangtze River basin, leaving considerable remaining potential to expand in the future periods (figure S7). In contrast, the China Coast is already at the edge of full exploitation in the base year and therefore little hydropower expansion is expected from this basin (figure S7). As a result, the Yangtze River basin contributes to almost 50% of the regional total hydropower expansion in 2050 under Ref.
Those top five expanding and producing basins are associated with relatively large hydropower potential; however, the level of resource exploitation varies. For example, the Yangtze River basin is projected to have 73% of its potential being exploited in 2050 under Ref. The La Plata basin in Brazil, the Scandinavia North Coast in EFTA, and the Indus basin in Pakistan are projected to have over 90% potential being exploited. On the lower side, the Pacific Northwest basin in the USA and the Huang He basin in China are projected to have 29% and 41% potential being exploited, respectively, in 2050 under Ref. In general, most basins in Europe, basins in the Middle East, Southern India, and some basins in the eastern USA are projected to have over 80% of their respective hydropower potential being exploited by 2050 under Ref (figure 5(c)).
Several basins have great hydropower potential but low exploitation percentage due to high costs associated with remoteness of the area or overall low regional demand for electricity. Notable basins include the Mackenzie in Canada, several basins in Russia (Yenisei, Lena, Amur, and Siberia West Coast), and the Congo basin in Western Africa. These basins are among the top eight basins with the largest hydropower potential while having an exploitation percentage below 20% (ranging from 1% to 12%) in 2050. The basins in Canada and Russia tend to encompass remote, low population density areas, where there is relatively low electricity demand and a lack of infrastructure to support hydropower project development as well as transmission lines to transport the electricity to larger demand centers. Thus, it is relatively expensive to exploit the massive hydropower resources in these basins. For the Congo basin in Western Africa, as the region has a low share of hydroelectricity historically and its hydropower expands slowly with a gradual increase of total electricity demand before 2050 (figure S4). As its economy booms in the second half of the century, the exploitation percentage of hydropower potential in the Congo basin in Western Africa reaches 40% in 2100 under Ref. Compared to the Yangtze River basin, the Congo basin in Western Africa has even larger remaining hydropower potential and a lower cost per unit of generation than the Yangtze River basin, but the power demand in Western Africa in 2050 is lower and thus limits hydropower utilization in the Congo basin.
4. Discussion
Our study suggests that there is ample potential for hydropower to expand in the future to help meet growing demand for electricity driven by socioeconomic growth, electrification of end-use sectors, or other factors. Globally, our scenarios entail hydropower growth between 36% (AdvTech) and 119% (Transition) in 2050, compared to 2015. However, we also find that hydropower's share of total electricity generation decreases across all scenarios relative to historical levels, indicating that while significant untapped hydropower potential exists, there are limitations to hydropower's growth both in terms of resource availability and/or economic competitiveness. In other words, hydropower can continue to play an important role in meeting increased demand for electricity globally but will be constrained by resource availability, resource location, and cost in ways that limit its growth relative to other technologies.
Hydropower resources are not ubiquitous; total resource potential ranges from 0.02 EJ yr−1 in Taiwan to 8.8 EJ yr−1 in China. Further, some regions have more fully exploited their resource bases historically, while other regions have potential that is largely untapped. The extent to which these untapped resources are exploited in the future varies according to the price and accessibility of that resource and future economics, including total electricity demand and the cost of competing technologies.
Our study contributes to the literature on the role of hydropower in future energy systems by analyzing future hydropower expansion under various economic circumstances in a dynamic, global, integrated, multisector model, with detailed resource representation at the water basin level. Our results demonstrate the importance of understanding both hydropower resource potential and costs at a spatially resolved level, as well as hydropower's competition with other power sector technologies and its interaction with end-use sectors.
Nevertheless, there are several important dynamics that we could not explore in this study which are ripe areas for future research. Our modeling approach does not consider other factors that could impact future hydropower expansion, such as government policy, societal acceptance or resistance, and availability of project financing mechanisms; future work could attempt to better reflect these regional differences in policy, social preferences, and other enabling or limiting conditions. Future climate change is expected to impact precipitation and snowmelt patterns and thus availability of runoff for hydropower (Wasti et al 2022). Integrating climate change into a dynamic, multisector framework like the one employed in this study would permit the analysis of future hydropower generation considering both economic capacity expansion and changes (increases or decreases) in water availability at a spatially resolved scale; these forces could be counterbalancing in some regions and complementary in others. Additionally, GCAM's representation of annual electricity generation makes it difficult to capture some important dynamics related to the economics of building and operating hydropower power plants, including its operational flexibility and seasonal variability which influence its capacity and energy value. Future work could extend the endogenous hydropower capability developed here to GCAM-USA dispatch (Binsted et al 2022), a version of GCAM with state-level detail in the United States and a more detailed power sector which divides annual electricity demand into 25 sub-annual segments, in order to explore these intra-annual dynamics in a long-term, global, multi-sector context.
Our study also contributes to the literature on strategic basin-scale hydropower planning (Almeida et al 2022), which seeks to better understand the future role of hydropower by identifying more sustainable hydropower portfolios that best balance multiple objectives (e.g. trading off hydropower production and ecological damages). These studies may effectively capture within-basin dynamics, such as regional hydrology and ecological impacts, but may miss the broader, long-term forces, both within and outside of the basin, that could shape the role of hydropower in the power sector, such as advancement of solar and wind technology, demand growth, and decarbonization goals (Schmitt et al 2019). Our study offers globally contextualized scenarios and insights into the potential future role of hydropower in sensitive river basins such as the Mekong, Amazon, and Congo (Ziv et al 2012, Winemiller et al 2016, Schmitt et al 2021, Flecker et al 2022).
Future research could build on our work to explicitly connect hydropower production with water availability to explore how changing water availability impacts future hydropower production in a multisector context (e.g. Turner et al 2019). Hydroelectric dams store water for use by other sectors (including in dryer seasons) (Biemans et al 2011) and potential energy for producing electricity in times of high demand (Collins et al 2017), creating interesting questions about the interaction of hydropower, water supply, and the evolving electric grid in the context of seasonal and interannual climate variability. Energy storage via hydroelectric dams for use in times of higher electricity demand may be of increasing importance. Particularly, there are many interesting questions to explore about the interaction of operationally flexible and fast-acting hydropower, and its future expansion, with an evolving electric grid (particularly one with higher penetration of intermittent technologies such as wind and solar). Other potential areas for future research include how reservoir sedimentation and dam decommissioning interact with future hydropower expansion (Wisser et al 2013). Finally, while hydropower produces no GHG emissions from its operation, the flooding of landscapes to create reservoirs can lead to carbon dioxide (CO2) (Kemenes et al 2011) and methane (CH4) (Demarty and Bastien 2011) emissions (Ocko and Hamburg 2019, de Faria et al 2015, Hertwich 2013, Teodoru et al 2012, Abril et al 2005) as the carbonaceous material decomposes. Exploring the tradeoffs between carbon free power and CO2/CH4 emissions as hydropower capacity expands is another important area of research.
Ultimately, having a high resolution, dynamic model of future hydropower expansion embedded in a global, integrated, multisector modeling framework sets the stage for answering many such questions.
Data availability statement
The data that support the findings of this study are available upon request from the authors.
Funding
This research was supported by the US Department of Energy, Office of Science, as part of research in MultiSector Dynamics, Earth and Environmental System Modeling Program.
Footnotes
- 3
Global hydropower potential map at the region-basin level employed in this study is available at figure 5(c).
- 4
Under Transition scenario, the land system sequesters approximately 1000 MT CO2 globally in 2050, allowing for about 1000 MT residual emissions from the energy system in 2050.