

Abstract
Despite the importance of carbon dioxide removal (CDR) in most climate change mitigation scenarios that limit warming to well below 2 °C, the study of CDR is still a nascent field with basic questions to be resolved. Crucially, it is not known how much CDR is currently deployed at a global scale, nor how that compares to mitigation scenario estimates. Here, we address this problem by developing an estimate of global current CDR activity. We draw on national greenhouse gas inventory data combined with CDR registries and commercial databases to estimate that global anthropogenic activity presently generates ∼1985 MtCO2yr−1 of atmospheric removals. Almost all of these—1983 MtCO2yr−1—are removals from land-use, land-use change and forestry. Non-land-management CDR projects such as bioenergy with carbon capture and storage, direct air capture with carbon capture and storage and biochar remove only about 2 MtCO2yr−1. We compare this estimate with Shared Socioeconomic Pathways projections of CDR deployed in 'well-below 2°C' mitigation pathways. In so doing we demonstrate current CDR deployment would need to grow exponentially to keep the world aligned with most 'well-below 2°C' scenarios, which see CDR deployment growing between 75% and 100% per year between 2020 and 2030, adding ∼300–2500 MtCO2 in total CDR capacity. To conclude we discuss uncertainties related to our estimates, and suggest priorities for the future collection and management of CDR data, particularly related to the role of the land sink in generating CDR.
Export citation and abstract BibTeX RIS

Original content from this work may be used under the terms of the Creative Commons Attribution 4.0 license. Any further distribution of this work must maintain attribution to the author(s) and the title of the work, journal citation and DOI.
1. Introduction
The recent 6th assessment report by the Intergovernmental Panel on Climate Change (IPCC) highlights carbon dioxide removal (CDR) as a fundamental component of any mitigation strategy aimed at limiting global warming to well below 2 °C [ 1]. In particular, it identifies three specific roles for CDR: First, to accelerate near-term mitigation, second, to achieve net-zero emissions by compensating for hard-to-abate residual emissions; and third to generate net negative emissions for reducing anthropogenic forcing [1]. The amount of CDR observed in mitigation scenarios consistent with the goals of the Paris Agreement varies considerably, from a few 100 gigatons of CO2 to greater than a 1000 across the 21st century [1, 2].
A wide range of different CDR methods (also referred to as negative emission technologies or negative emission practices) has been proposed. Commonly-cited are afforestation/reforestation, the production of biochar, soil carbon sequestration, bioenergy with carbon capture and storage (BECCS), direct air carbon capture and storage (DACCS), enhanced weathering, ocean fertilization, and ocean liming [3], but there has also been a recent proliferation of other novel methods introduced in the literature [4 – 8]. There further exists a wider discussion on greenhouse gas removals [9] that also covers methods to remove methane [10] nitrous oxide [11] or other greenhouse gasses (GHGs) [12], however the methods considered most scalable are focused on carbon dioxide, which is our focus here.
The study of CDR is still a nascent field [3, 13, 14] and is therefore still grappling with fundamental issues. First, which methods qualify as CDR and which do not is unclear or contested [3, 15]. Secondly, no consistent approach has been developed to integrate CDR into emissions accounting activities [3, 16, 17]. Thirdly, no estimate exists of how much CDR is currently deployed. Fourthly, and finally, it is not known how current deployment compares with modeled mitigation scenarios, many of which treat CDR as a largely monolithic intervention (e.g. BECCS) inversely equivalent to the emission of carbon dioxide [18] despite uncertainty surrounding the permanence of nature-based CDR and climate impact of more permanent engineered approaches [17, 19–21].
Resolving these challenges is important to achieving the goals of the Paris Agreement, as establishing a robust estimate of CDR deployment is a precondition to assess progress against climate goals and commitments. Here, we introduce an accounting framework for CDR approaches. We apply this framework to develop a present-day deployment estimate, and, finally, compare this estimate with CDR observed in mitigation scenarios to draw conclusions about necessary future action.
2. Defining carbon dioxide removal
Though there is no universally-used definition of CDR, the IPCC 6th Assessment Report (AR6) provides a good starting point [22]:
CDR refers to anthropogenic activities removing CO2 from the atmosphere and durably storing it in geological, terrestrial, or ocean reservoirs, or in products. It includes existing and potential anthropogenic enhancement of biological, geochemical, or chemical CO2 sinks, but excludes natural CO2 uptake not directly caused by human activities.
There are other commonly cited approaches that introduce important considerations not included in the IPCC definition. For example, Tanzer and Ramirez [15], set out four criteria for a technique to qualify as CDR, including that the lifecycle emissions of a project be net-negative. However, this definition also imputes motive ('intended to be permanent'), which is hard to assess externally and leaves open the inclusion of highly-impermanent removal as long as it was intended to be permanent. While some non-zero level of permanence is widely accepted to be a defining quality of CDR, there is no agreed minimum storage lifetime, and temporary storage may have value in delaying peak warming, thus buying time for further technological advancement, or in substituting for more expensive permanent storage via long-term management [19, 20, 23]. For this reason, and because most available CDR data is measured in gross terms, not net of lifecycle emissions, here we use the IPCC AR6 definition.
In addition to the issues of lifecycle emissions and storage duration, however, there is another complication faced when defining CDR. Many CDR methods involving biomass-based capture require multiple years to complete the process of capturing carbon from the atmosphere and transferring said carbon to its final storage reservoir. Over the full lifetime of a CDR process multiple removals, emissions, and transfers between storage pools can occur. (See figure 1). Therefore, it is not clear in which year the CDR activity should be accounted for, as carbon captured in one year may be transferred to a new storage reservoir in a future time period, altering the permanence and therefore value of said removals.

Figure 1. An illustrative sequestration pathway for the production of harvested wood products (HWPs). During the atmospheric removal phase, carbon is sequestered incrementally and at a declining rate through biomass growth in forests [24]. During the carbon transfer phase, a portion of stored carbon is transferred from forest biomass to HWPs, with the remainder deposited as deadwood [25]. During the sequestration phase, both the deadwood and HWP decay to the atmosphere, though at different rates [26].
Download figure:
Standard image High-resolution imageThis challenge could be overcome by accounting for cumulative future or past CDR activity in one year. However, accounting for future removals in the present year exposes accounting processes to the risk of overestimation, should, for example, the lifetime of a planted tree be less than expected. Accounting for total lifetime (past) removals in one year (e.g. the year of HWP production) exposes accounting processes to the risk of double counting should, for example, trees previously accounted for as standing forest later be harvested to produce HWP. In light of these challenges, accounting approaches should follow a 'reality principle': reporting emissions and removals when and where they actually occur [17]. To capture the full scope of CDR activity, however, such 'reality principle' based approaches must then include separate quantifications of fluxes of carbon from the atmosphere and between non-atmospheric reservoirs, as both have important but different climate value. This can be done by accounting for CDR through a stock-and-flow framework done, for example, in the UNFCCC accounting guidelines for HWPs [27], and in doing so subdividing CDR into two subsidiary groups of activities, which we will define here. The first of the two activities we will term atmospheric removals and define as follows:
Anthropogenic activity that removes CO2 from the atmosphere and durably transfers it to a non-atmospheric carbon reservoir in a given year.
We stipulate the durable storage of removed carbon to avoid classifying projects that conduct capture but not storage as CDR: for example a proof-of-concept CDR plant with no storage capability. The second activity we will term carbon transfers, and define as:
Anthropogenic activity that moves carbon previously captured from the atmosphere from one non-atmospheric reservoir to another in a given year, with the effect of increasing time to re-emission.
Understanding the volume and nature of these two activities, together with information about the permanence of carbon stored in different carbon sinks, should provide sufficient information for an interested stakeholder to account for the full climate value of CDR activity that occurs in a given year.
3. Mapping CDR pathways
There have been several prior attempts to develop a framework to organize CDR data for ease of accounting [3, 28 – 30]. Collectively, these approaches have several drawbacks, including: (a) few link carbon removal directly to the stocks and flows of carbon within and between the reservoirs of the global carbon cycle (an important characteristic to accurately measure CDR deployment, as discussed), (b) those that do link removal to stocks and flows of carbon do not distinguish between intermediate conversion processes, and finally, (c) few include industrial/commercial products as a storage option, despite its inclusion in the definition of CDR by the IPCC.
Here we expand on existing frameworks to address these issues. We build on Hepburn et al [29] and Smith et al [30], defining the principle carbon reservoirs as the atmosphere, land, ocean, lithosphere, and products. We further divide these reservoirs into subsidiary carbon pools with differing characteristics including permanence (figure 2).

Figure 2. A stock-and-flow framework for categorizing CDR approaches. We define the principle carbon reservoirs as the atmosphere, land, ocean, lithosphere, and products. We further delineate these reservoirs into carbon pools with different storage characteristics, detailed in the table below. Storage lifetimes taken from [1, 3, 31].
Download figure:
Standard image High-resolution imageIndividual CDR techniques can be represented as fluxes between pools—transferring carbon captured from the atmosphere through various intermediate stages before reaching the final storage reservoir. Given individual CDR techniques can be represented as pathways through various carbon pools, the characteristics of a CDR technique can then be systematically formalized by aggregating the characteristics of said carbon pools (or, in the case of permanence, the final carbon reservoir(s)) and the processes used to transfer carbon between them. Atmospheric removals can be visualized as all activities which cause a flow out of the atmosphere and into durable storage in a given year, while carbon transfers can be visualized as all activities that cause movement of previously captured carbon between non-atmospheric carbon pools. Most importantly, tracking CDR deployment using such a framework will facilitate easier integration of CDR data into other emission accounting and stock-take activities, including the global carbon budget estimation and national greenhouse gas inventories (NGHGIs), which are based on similar stock-and-flow conceptualizations.
4. Methods
We now apply the CDR definitions and framework developed above to estimate and evaluate current global CDR deployment. The data infrastructure is not yet in place to monitor CDR deployment on a global scale. As such, our deployment estimate must be calculated through the combination of many different data sources. We organized our search for appropriate data around the recognition that human management of land and forests for non-CDR reasons is the single largest source of CDR given the scope of this activity compared to the nascent state of carbon capture technology. As such, an estimate of total deployment was reached by combining gross estimates of the flow of carbon into the global managed land sink with a survey of individual CDR projects.
4.1. Estimating total CDR from registered CDR projects
Having set the boundaries of our analysis, we first gather the necessary data. To estimate total CDR generated from registered CDR projects (that is—projects specifically developed for the purpose of generating CDR, and recorded in a registry or carbon purchase database), data on project-level CDR volumes were aggregated from across 20 unique registries and databases (table 1). A thorough double-counting check was performed using datapoints including project name, location, project size/sequestration rate, and sponsoring institution. Given some projects split their total sequestration volume across multiple registries, or accumulate future removals into a single cumulative value, this double-counting check necessitated line-by-line project-level verification using web searches of publicly available information. This process resulted in the creation of a database with 603 unique projects, including both nature-based and non-nature-based approaches.
Table 1. List of the 20 unique registry databases and access dates used to compile an estimate of current global CDR deployment.
| Database Name | Date Accessed | References |
|---|---|---|
| Berkeley Goldman School of Public Policy Voluntary Offsets Registry Database | 31 July 2022 | [32] |
| Verra Standard Registry Database | 31 July 2022 | [33] |
| Gold Standard Project Registry | 31 July 2022 | [34] |
| American Carbon Registry Database | 31 July 2022 | [35] |
| Carbon Action Reserve Database | 31 July 2022 | [36] |
| Stripe CDR Purchase Database | 31 July 2022 | [37] |
| Microsoft CDR Purchase Database | 31 July 2022 | [38] |
| Carbon(plan) CDR Database | 31 July 2022 | [39] |
| Thirdway CDR Project Database | 31 July 2022 | [40] |
| Global Carbon Capture and Storage Institute Database | 31 July 2022 | [41] |
| MIT's Carbon Capture & Sequestration Technologies Database | 31 July 2022 | [42] |
| ID-RECCO Project Database | 31 July 2022 | [43] |
| CIFORs GCS-REDD+ database | 31 July 2022 | [44] |
| Forestry Trends Ecosystem Markets Database | 31 July 2022 | [45] |
| UN FCCC's Clean Development Mechanism project database | 31 July 2022 | [46] |
| Innovation for Cool Earth Forum (ICEF) BiCRS Roadmap 2021 | 31 July 2022 | [6] |
| Marginal Carbon CDR Purchase Database | 31 July 2022 | [47] |
| European Biochar Initiative Report | 31 July 2022 | [48] |
| North American Biochar Initiative Report | 31 July 2022 | [49] |
| China Bamboo Association Annual Report | 31 July 2022 | [50] |
Once the project-level database was compiled the next step was to derive annual sequestration estimates for projects missing data. This was done following three separate protocols. First, for reforestation/afforestation projects, which make up 486 of the 603 projects, project size data was standardized as total hectares reforested. Hectares reforested were then converted into annually sequestered carbon using empirically derived logarithmic, geography-specific sequestration curves that measure carbon sequestration rates based on forest location and age [24]. Second, for soil-sequestration-related projects, total project hectares were combined with literature estimates of sequestration rates per hectare [51]. Thirdly, all remaining projects had publicly available annual sequestration data available in their registries or web-pages, which was employed. As a final step, each project was assigned a CDR pathway describing its movement of carbon between pools and reservoirs, and whether that pathway classifies as an atmospheric removal or carbon transfer. The total annual sequestration rate for each unique pathway was then summed and recorded.
4.2. Estimating total anthropogenic CDR
As discussed above, estimating total anthropogenic CDR necessitated combining data on registered CDR projects with estimates of CDR generated, largely unintentionally, via land use, land-use change and forestry (LULUCF) [52]. It is challenging to quantify CO2-LULUCF fluxes [53 – 60]. The most recent IPCC assessment gives a relative uncertainty estimates of ±70% for the annual, net anthropogenic CO2 emissions flux from LULUCF and highlights that 'net anthropogenic CO2 emissions from land use, land-use change and forestry (CO2-LULUCF) are subject to large uncertainties and high annual variability, with low confidence even in the direction of the long-term trend.' [22].
There are at least two established approaches to estimate anthropogenic CO2 fluxes from LULUCF: the first is biosphere bookkeeping models as originally proposed by Houghton [59]. The second is data from NGHGIs submitted to the United Nations Framework Convention on Climate Change (UNFCCC), which contain country-level self-reported data on the impact of human activity on specific carbon sinks and sources. Both quantification approaches differ in the way they define what constitutes an 'anthropogenic' CO2 flux. Bookkeeping models separate natural from anthropogenic drivers, i.e. effects of changes in environmental conditions from effects of land-use change and land management. By contrast, the NGHGI approach separates fluxes based on areas, with all those occurring on managed land being declared anthropogenic [52 – 54, 56]. These conceptual differences give rise to an enormous divergence between CO2 LULUCF estimates from bookkeeping models and NGHGIs. The mean projection of bookkeeping models suggests managed land results in a net source of ∼3.2 ± 2.3 GtCO2 per year, while NGHGI data suggests a net sink of ∼1.6 ± 0.5 GtCO2 [52, 55].
In an ideal world we would quantify land-based CDR as the gross flux into the biosphere resulting from human management activities alone. This is not possible using either bookkeeping or NGHGI data, which estimate only net fluxes such as total net flux, net flux from forested land, net flux from deforestation, and so on. Therefore, for our deployment estimate we approximate the desired gross flux by applying adjustments to an aggregated and standardized NGHGI database developed by Grassi et al [55]. Firstly, we began with the total net LULUCF flux. We then removed all non-forest-management flux estimates, including the impact of deforestation and peat fires. To address missing indirect-effect variability from the NGHGI data [55, 56], we applied annual mean variance estimates generated through historical runs of the OSCAR Earth-system model to the measured mean NGHGI flux [52]. Finally, we subtracted OSCAR's estimated total indirect effect fluxes from the adjusted NGHGI data to leave us with an approximation of the isolated direct impact of human activity in the forest sink (figure 3).

Figure 3. NGHGI annual net managed forest flux, adjusted to include indirect effect variability (black). NGHGI annual net managed forest flux, less indirect effects (blue), the estimate of managed land sequestration we use here. Shaded grey area indicates range of uncertainty on NGHGI estimates.
Download figure:
Standard image High-resolution imageBecause annual crops and forest residues (deadwood) are considered in equilibrium with the atmosphere under the UNFCCC reporting guidelines, CDR methods that use annual crops and forest residues as methods of capture (e.g. BECCs and biochar) are not double-counted in the land sink quantification and so were not removed from our estimate [27]. Finally, because HWPs present an important source of carbon transfers out of the biosphere and into products, we needed to separately quantify the total production of HWPs at a global scale. For this, data was taken directly from the United States Food and Agriculture Organization Statistics (FAOSTAT) Forest Product Statistics database, and converted from units of production into tons of CO2 following the methodology in the UNFCCC Guidelines for NGHGIs [27].
4.3. Comparing deployment to target-consistent scenarios
In order to compare our real-world CDR deployment estimate to different possible mitigation scenarios, we use the Shared Socioeconomic Pathways (SSPs) [60]. Specifically, we investigate how our deployment estimate compares to various levels of climate ambition under SSP1, a sustainability-focused development pathway, SSP2, a middle-of-the-road development pathway, and SSP5, a fossil-fuel led development scenario. These scenarios split CDR deployment into two variables: total engineered carbon capture, and the net flux resulting from LULUCF.
There are two problems with this approach. Firstly, all engineered CDR projects are assumed to be atmospheric removals, not carbon transfers. Because the volume of deployed carbon transfers other than HWPs is currently zero (e.g. BECCS using lumber), this does not present a problem for our analysis, but it could in the future. Secondly, the necessary variables do not exist to replicate our NGHGI gross-sink estimate using SSP data: while the SSP LULUCF estimates are already net of indirect effects, it is not possible to ensure the list of included and excluded land fluxes are apples-to-apples. This is a critical problem that will need to be addressed in future work.
5. Results
We estimate that, in 2022, human society globally is generating 1985 MtCO2yr−1 of atmospheric removals, and an additional 222.9 MtCO2yr−1 of carbon transfers between non-atmospheric reservoirs. Of the 1985 MtCO2yr−1 of atmospheric removals, 1982.7 (>99.9%) are generated through land use management practices—mainly forest management (figure 4). An estimated 207.5 MtCO2yr−1 of these removals (10.4%) are accounted for via registered land sink enhancement CDR projects, meaning the vast bulk of CDR is generated unintentionally. The remaining 2.3 MtCO2yr−1 removals are generated outside LULUCF-related CDR and are divided as follows: 1.82 MtCO2yr−1 of BECCs with geological storage, 0.5 MtCO2yr−1 from biochar production, and 0.01 MtCO2yr−1 of other approaches, including DACCs, mineralization, aquatic biomass growth, and others. All 222.9 MtCO2yr−1 of carbon transfers are generated through the production of HWPs, specifically sawnwood and wood panels. Other categories of HWP are excluded from carbon transfers as they have half-lives less than those of the trees they are made of, and as such represent not CDR activity but an acceleration of emissions from forest carbon stock.

Figure 4. (a) A to-scale carbon stock-and-flux diagram of total atmospheric removals currently generated by global management of the land sink and deployment of CDR projects, measured in MtCO2yr−1. (b) A zoom in on the 2.3 MtCO2yr−1 of atmospheric removals generated by deployment of CDR projects.
Download figure:
Standard image High-resolution image5.1. Projecting future CDR deployment
There are a number of CDR projects currently in development that will become operational over the course of this decade. As such, it is possible to develop a baseline estimate of future CDR deployment by assuming no new projects are initiated, and all in-development projects are completed. Under this assumption, non-land-management atmospheric removals will grow from 2.3 MtCO2yr−1 in 2022 to 11.75 MtCO2yr−1 by end-of-year 2024, driven almost entirely by the completion of the Summit Carbon Solutions BECCs project, which involves bringing online 30 coupled ethanol-production/BECCs plants and associated geological storage. By 2030, the remaining in development projects will be completed, bringing the total engineered atmospheric removal volume to 22.76 MtCO2yr−1, accounting for several large developments including two Drax BECCS plants, and one of carbon engineering's two in-development Mt-capacity DACCS plants. By 2030 the annual volume of non-land-management atmospheric removals other than BECCS and DACCS will remain well below 1 MtCO2yr−1 in volume. Given this deployment trajectory, by 2025 'engineered' CDR activity will have sequestered a cumulative 31.49 MtCO2, of which 29.48 MtCO2 will be via lithospheric storage. By 2030, the total cumulative value will approach 124.93 MtCO2.
To project future CDR deployment, we can also extrapolate current deployment data, given it is unrealistic to assume that there will be no additional project development between now and 2030. To provide a rough range of what might be expected, we fit both linear and exponential functions to the 2020–2025 deployment data for each type of CDR project to serve as plausible upper and lower bounds. Under these assumptions, by 2030 we could see between 30.5 and 208.5 MtCO2yr−1 of BECCs deployment, 7.3 and 297.5 MtCO2yr−1 of DACCs deployment, 1.8 and 65 MtCO2yr−1 of biochar deployment, and 0.036 and 0.061 MtCO2yr−1 of all other approaches, including enhanced weathering and blue carbon management (figure 5). While the exponential extrapolations seem large, it is important to note that despite persistently linear forecasts, solar and wind deployment have exhibited exponential trends for a number of decades [61] and similar dynamics for CDR technologies cannot be ruled out. That said, the farther out a projection is made, the more likely an S-curve or other functional form could provide a better fit, given factors including diminishing marginal returns to economies of scale, decreasing demand, or resource limitations [62]. Because we have 20+ years of data for HWP production which demonstrate a clear linear trend, and lack a plausible theoretical explanation for a future exponential trend, we only conducted linear extrapolation for HWPs, leading to estimates of 260 MtCO2yr−1 HWP production by 2030.
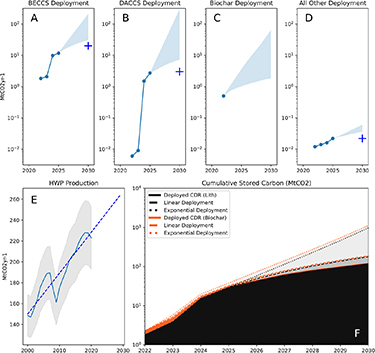
Figure 5. (a)–(d) Deployment of various forms of engineered atmospheric removals, measured in MtCO2yr−1. Light blue projection indicates a lower (linear) and upper (exponential) fit to 2020–2025 deployment data. The dark blue crosses indicate 2030 deployment if only currently in-development projects are completed. (e) HWP production, measured in MtCO2yr−1. (f) Cumulative atmospheric removals by final storage reservoir, given observed deployment, continued linear deployment, and continued exponential deployment. Measured in MtCO2.
Download figure:
Standard image High-resolution image5.2. Comparing CDR deployment to scenario estimates
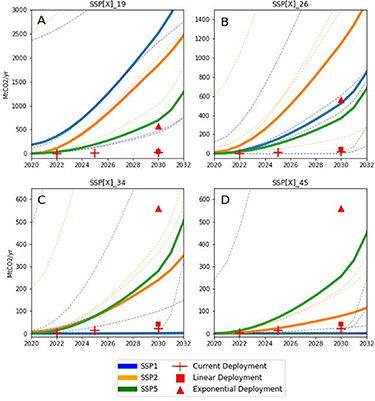
To conclude, we wanted to understand how current CDR deployment compares to deployment assumed under different levels of climate ambition within the SSPs. Here we look at scenario estimates of CDR deployment for RCP1.9, 2.6, 3.4, and 4.5 across SSPs 1, 2, and 5 (figure 6). Under any SSP restricting warming to 1.9 w m−2 by end of century, roughly equivalent to a 1.5 °C future warming scenario, both linear and exponential extrapolation of current deployment rates result in insufficient CDR volume by 2030. Given exponential growth, current deployment would result in 550 MtCO2yr−1 by 2030, while the SSP with the slowest CDR deployment (SSP5-19) sees CDR reaching 650 MtCO2yr−1 over the same timeframe. Continued exponential growth of current deployment is most closely aligned to the SSPs limiting total end-of-century radiative forcing to below 2.6 w m−2, (a roughly 'well-below' 2 °C scenario) while continued linear growth of current deployment is aligned roughly with the lower-end scenarios leading to a radiative forcing of 4.5 w m−2 (an above 2 °C scenario). In short, while there are a wide range of different CDR deployment estimates produced by Integrated Assessment Models (IAMSs) running the SSP scenarios, maintaining alignment with a 'well-below 2 C' scenario would likely require current CDR deployment to grow at least exponentially through to the end-of-the decade, adding a minimum 300 MtCO2 of CDR capacity.
Figure 6. (a) Total engineered CDR deployment across three SSPs that result in an end-of-century atmospheric forcing of 1.9 w m2: SSP1-19, SSP2-19, and SSP5-19. (b) The same for an end-of-century forcing of 2.6 w m2. (c) The same for an end-of-century forcing of 3.4 w m2. (d) The same for an end-of-century forcing of 4.5 w m2. Current deployment of engineered CDR, as well as linear and exponential extrapolation of that data are in red.
Download figure:
Standard image High-resolution image
It is important to note that the discussion thus far has been limited to CDR that stores carbon in reservoirs other than the biosphere. Given the size of the biosphere, changes to its carbon stores will inevitably play an important role in most 'well-below 2 C' mitigation scenarios, reflected by a substantive decrease in net LULUCF emissions across the SSPs that achieve this warming target. As it is not possible to compare present-day deployment estimates to SSP LULUCF emissions (for reasons discussion above), the conclusions that can be drawn about present-day deployment volumes here are limited. That said, given deforestation emissions are a major component of net LULUCF emissions (roughly 4.3 GtCO2yr−1), a major driver of changes in the scale and direction of LULUCF emissions under different future mitigation pathways is likely to be driven by reductions in deforestation in lieu of (or perhaps in partnership with) a major scale-up of biosphere-based CDR methods, and as such it is not clear a priori to what degree present-day land sequestration will need to change.
6. Discussion
Data availability and quality represent the single largest uncertainty in our results. Because there is no central registry for CDR projects, and the database developed here was put together using multiple different sources including project-by-project web searches, the data is undoubtedly incomplete or subject to error. The most substantial gap impacting our estimate of CDR project deployment is the limited geographic coverage of available data. Most databases cover CDR projects deployed in Europe and North America, but have minimal project entries from any other geographies. Additionally, because, unlike BECCS and DACCS, biochar production takes place over smaller, more diffuse scales, and often not for the express purpose of generating CDR, we have had to depend on industry association reports to estimate production for the three geographies where such associations exist: Europe, the United States, and (partially) China. A second gap that exists is availability of lifecycle emissions data. As previously mentioned, most CDR projects provide annual sequestration volumes, but do not conduct and disclose lifecycle analyses. Finally, there is substantial uncertainty around the accuracy with which NGHGI reporting captures actual carbon fluxes to and from the global land sink. As discussed in detail in Grassi et al (2022), the accuracy of reported data is assessed to be within ±35% of the true fluxes for annex I countries, and within ±50% for non-annex I countries, due to both ambiguity in the statistical methods used to prepare reports, and the so called 'informal harvesting' problem [55]. We suggest, therefore, that one of the most important steps to ensure the sufficient development and deployment of CDR technologies is the development of a data pipeline that gathers, standardizes, and improves information about CDR projects, such that we can understand (a) how much CDR is being generated, and (b) how much more must be deployed to meet targets. The NGHGIs are one logical place where such infrastructure could be built for CDR projects, and improved for land use management, a topic already being discussed at length elsewhere [52 – 60].
Despite these uncertainties, we suggest our results are sufficient to draw three important conclusions: first, that despite the acceleration of interest and finance directed towards CDR development, current deployment will have to grow exponentially to keep the world on track with the assumptions made by 1.5 °C and 2 °C SSPs. Secondly, they demonstrate that there is a more diverse set of CDR approaches being deployed in the real world compared to model assumptions. The bulk of deployed engineered projects nevertheless sequester carbon in the lithosphere, meaning no issue has yet arisen regarding the reconciliation temporary negative emissions use in practice and permanent negative emissions in scenario modeling. Thirdly, and finally, they highlight that resolving uncertainties in the measurement of LULUCF fluxes will be essential to determining the sufficiency of CDR deployment efforts going forward. Specifically, both national inventories and IAM-derived mitigation scenarios should provide detailed information regarding the evolution of forest area, subdivided by forest type [63] as well as the gross carbon fluxes (i.e. positive and negative, human-caused and indirect) resulting from the assumed changes in forest area, following a common framework that would enable like-for-like comparison [56]. Only with these advances will it be possible to maintain an accurate stock-take of ongoing CDR activity aimed at achieving a particular climate goal.
Acknowledgments
The authors would like to thank the anonymous reviewer for their constructive comments and suggestions. They would also like to thank Giacomo Grassi for his help in understanding the nuances of National Greenhouse Gas Inventory data. C P gratefully acknowledges the support of Bank of America for this research. S S acknowledges the support of the CO2RE Hub, funded by the Natural Environment Research Council (Grant Ref: NE/V013106/1). J C M acknowledges funding by the European Research Council under the European Union's Horizon 2020 research and innovation programme (GENIE Project; Grant 951542) and by the German Ministry for Education and Research (CDRSynTra Project: Grant 01LS2101F). T G was supported by the European Union's Horizon 2020 (Nunataryuk Project; Grant #773421) and Horizon Europe (RESCUE Project; Grant #101056939) research and innovation programmes.
Data availability statement
The data that support the findings of this study are available upon reasonable request from the authors.