

Abstract
Tracking progress towards the Paris Agreement climate goal requires understanding the 2030 emission levels implied by countries' National Determined Contributions (NDCs). However, key uncertainties and assumptions impact greenhouse gas (GHG) emission projections implied by the NDCs. This study analyses this impact, both globally and for major emitting countries. We find that the assessed uncertainties markedly affect global GHG emission projections. Full achievement of NDC targets is estimated to result in a range of 46–60 GtCO2eq by 2030 (median estimate: 53 GtCO2eq). The uncertainty in measuring historical emissions, including land-use, as reflected by different datasets is the most important contributing factor. This is followed by two equally important factors globally: socio-economic baseline uncertainty and uncertainty about the emissions implied by current policies in case NDCs are less ambitious than these. Overall, the impact of policy uncertainty (i.e. uncertainty resulting from conditionality of or ranges in NDC targets and uncertainty in emissions resulting from current policies) is about equally important as model/technical uncertainty (i.e. uncertainty in historical emissions and socio-economic baseline variations). This new insight is important for decision makers and researchers because a larger share of the total uncertainty is now attributable to aspects that can be influenced by policy decisions compared to previous analyses of NDC uncertainty.
Export citation and abstract BibTeX RIS

Original content from this work may be used under the terms of the Creative Commons Attribution 4.0 license. Any further distribution of this work must maintain attribution to the author(s) and the title of the work, journal citation and DOI.
1. Introduction
In the Paris Agreement, Parties agreed to a collective long-term goal of holding the increase in global average temperature to well below 2 °C above pre-industrial levels and to pursuing efforts to limit it to 1.5 °C [1]. Countries' actions under the Agreement are specified in National Determined Contributions (NDCs), which elaborate national mitigation targets, plans and measures that contribute to the achievement of the global goal. Earlier analyses [2, 3] have shown that the collective outcome of the NDCs proposed in the lead up to the 2015 Paris climate conference is not in line with global least-costs scenarios consistent with 2 °C and 1.5 °C. However, the Paris Agreement established a ratcheting process, through which the NDCs are to be evaluated and enhanced over time, called the global stocktake (GST) [1]. The GST aims to assess collective progress since the adoption of the Paris Agreement and inform Parties in their adoption of improved policies and measures.
This first GST takes place between 2021 and 2023 and will, among others, evaluate progress of NDCs the Paris Agreement. By September 2022, 169 countries had submitted new NDCs [4, 5]. The new NDCs reduce the emission gap for achieving 2 °C and 1.5 °C, but are still insufficient to keep the temperature goals of the Agreement within reach [6–8]. There is also an implementation gap which refers to lack of implemented actions to reduce emissions and reach NDC targets [9]. This implementation gap varies across countries since some are on track to meet their targets whereas others have not adopted sufficient measures [6–8]. Although existing studies analyse new NDCs, no peer-reviewed analysis to date has systematically investigated the uncertainty in their emission levels. Evaluating uncertainties and their impact supports clarifying NDCs collective progress under the GST.
Our study focuses on key NDC (as of 23 September 2022) uncertainties, which influence collective target GHG emission levels in 2030. There are currently three studies [10–12] that quantitatively analyse the uncertainty of original NDCs, but they differ in scope and methodology. Only Rogelj et al [10] assessed the several original NDC uncertainty factors systematically and presents a range of GHG emission projections at the global and regional level. Our study builds on Rogelj et al, to analyse uncertainty associated with new NDCs. We expand on previous analyses by expanding and refining the set of uncertainty factors, using a more recent starting point for NDC projections (2020 instead of 2015) and constraining emissions to levels implied by current policies. We also extends previous studies by analysing NDCs at the country level, estimating the effect of current policies and thereby showing the progress towards meeting the NDC targets, and accounting for uncertainty in historical emissions including emissions from land use, land-use change and forestry (LULUCF). We do not explore the impact of different LULUCF accounting rules used in the NDCs, which is analysed by [13, 14].
This study investigated the following main research question: what is the impact of different NDC uncertainty factors on 2030 global and national GHG emissions projections? It systematically analyses the impact of seven factors on the uncertainty in projections of 2030 GHG emissions under the latest NDCs (cut-off date of 30 September 2022) on a global level and for 26 major emitting countries, including the EU27 as a group. These 26 countries are currently responsible for about 80% of global GHG emissions and have a variety of NDC targets (see supplementary text 1). Here, we discuss in detail the results for the top six emitting economies (Brazil, China, EU27, India, Russia, and USA), together responsible for 65% of global GHG emissions. Earlier literature identified a set of driving uncertainty factors [6, 10], from which we derive the following set: (i) uncertainty in historical emissions, (ii) conditionality of NDC targets, (iii) NDC targets expressed as a range, (iv) variation in baseline emissions, (v) socioeconomic baseline variation, (vi) uncertainty in the current policies scenarios (only relevant if NDC targets are above current policies scenarios) and (vii) the peaking year of China's emissions. The analysis covers emission projections based on current climate policies and NDC scenarios of the 26 selected countries and the remaining countries as a group, using the methodology as described in section 3 based on [6]. The study also identifies the most important uncertainty factors among different major emitting countries and how these uncertainties could be reduced. This analysis improves our understanding of NDCs by identifying which factors generate high uncertainty and/or are not sufficiently defined, and recommends measures for policy makers to reduce uncertainties.
2. Uncertainties
2.1. Overview of uncertainty factors
Based on factors identified in [6, 10], this analysis considers the following uncertainty dimensions:
Uncertainty in historical emissions. Projected emissions depend on the level from which projections start. Differences in historical emissions datasets show that there is considerable uncertainty in these starting levels ([e.g. 15, 16–18], table 1). The datasets analysed here [e.g. 15, 16–18] cover all Kyoto GHGs excluding LULUCF, but only [15] covers LULUCF emissions, and therefore all datasets were complemented with the datasets from [15, 19] covering LULUCF emissions (table 1). For this study, the variation across these available datasets was used to estimate the uncertainty in historical emissions, while only differences in historical base-year (BY) emissions as submitted to the UNFCCC over time were used for individual countries. The latter uncertainty is only relevant for countries that formulated NDC reduction targets relative to historical BY emissions (e.g. Russia and Brazil, see supplementary text 2) [5].
Table 1. Overview of the data source for the implementation of each NDC uncertainty factor.
| Uncertainty factor | Explanation and data source | Affected countries from the selected 26 countries |
|---|---|---|
| Model/technical uncertainty | ||
| Inherent uncertainty in measuring GHG emissions excluding LULUCF (historical datasets) | Different sources for historical emissions use distinct methods to measure emissions. Although NDC targets are often defined relative to historical emissions submitted by countries to the UNFCCC (national inventories), actual emissions could differ from these levels. | All 26 selected countries |
We estimate this uncertainty by considering different historical datasets against which NDC targets are calculated. The following datasets are selected for GHG emissions excluding LULUCF:
| ||
| Inherent uncertainty in measuring LULUCF emissions (historical datasets) | The datasets for GHG excluding LULUCF are combined with the following datasets for LULUCF emissions:
| All 26 selected countries |
| Inherent uncertainty in measuring emissions (variations in BY emissions) | For the analysis of individual countries' projections only national GHG inventories were used. Variations in historical emission inventories over time also influence NDC emission estimates when NDC objectives are specified as a percentage change from a historical emissions estimate (BY emissions). Over the period 2015–2020 submitted national inventories and national communications [15, 33, 34] showed variations in historical GHG emission estimates due various uncertainty sources. The BY emissions estimates have been reported in [28, 29, 37–39], and analysed here. | Australia, Brazil, Canada, Japan, Republic of Korea, Russian Federation, UK and USA |
| Socio-economic baseline variation | Socioeconomic drivers affect NDC emission projections. For example, the NDC targets of India and China that include intensity targets and non-fossil fuel targets is calculated using the TIMER energy model of IMAGE [5]. NDCs are calculated under three socioeconomic futures from the shared socioeconomic pathways (SSPs). More specifically, the IMAGE current policies scenarios of three SSP pathways are used. These are developed using the methodology of Roelfsema et al [30], and project GHG emissions and energy use as affected by economic, demographic, and social drivers [40]. SSP1 represents a sustainable future path in which environmental boundaries are respected [40]. SSP2 is a middle-of-the-road scenario, which is used as default. In SSP3, environmental issues have low priority and the world is characterised by regional rivalry [40]. | China, India and countries that submitted mitigation actions that cannot be quantified |
| Policy uncertainty | ||
| Range specification | Some countries set a range in their NDCs without specific reference to conditionality. We take the minimum and maximum of the NDC target range based on [5]. | Canada, South Africa and the USA |
| Conditionality | Some countries have set unconditional and conditional targets, based on finance, technology transfer, or action by other countries. We include both the conditional and unconditional NDCs based on [5]. | Ethiopia, Iran, Mexico, Morocco, South Africa, Thailand and Vietnam. |
| Variation in baseline emissions | Updated NDCs may include different baseline emissions estimates [5]. Some countries have not specified their baseline emissions. Variations in baseline emissions estimates influence NDC emission estimates when NDC objectives are specified as a percentage change from a baseline emission level. The reported baseline emissions estimates over time have been reported in [37–39], and analysed here. See appendix 2 for detailed list of data sources. | Mexico and Saudi Arabia |
| Uncertainty in current policies scenario influencing the cap of the NDC target | If NDCs are above current policies scenarios, projected emissions are capped by projected emissions levels resulting from current policies scenarios. Here, we assume two cases for the cap for the NDC projections: the current policies scenarios of IMAGE for SSP1, SSP2 and SSP3 (default), or the maximum of the current policies projections of the UNEP Assessment [8]. The later covers a wide range of estimates based on global and national studies, as well official assessments published by national governments. | China |
| Peaking emissions China | Peaking of CO2 emissions by 2025 and 2030 (default), as calculated using the IMAGE model. | China |
a about 5% of the global emissions of 2019 [5], and none of the 26 selected countries. b only capped under the IMAGE current policies for SSP2. c only capped under the IMAGE current policies.
Conditionality refers to countries that include conditions to implement their NDC targets [5]. The conditions usually concern financial support. Examples of countries that have a conditional and unconditional NDC target are Ethiopia, Iran, Mexico and Thailand. For India, the conditional target on the non-fossil capacity is additional to unconditional targets.
Range specification. Some NDCs include a target range instead of one single number, e.g. USA and Canada [5]. This creates different potential emission levels.
Variation in baseline emissions. Some countries have targets relative to projected emission levels according to baseline scenarios and these projected emission levels are sometimes not specified, or have been subject to change. For example, Mexico changed their baseline emissions between NDCs [5]. Baseline emissions can vary due to distinct reasons, for example, changes in emissions inventory methodology or an updated assessment of socioeconomic drivers.
Socioeconomic baseline variation. Some NDC targets directly depend on socio-economic developments. For example, the NDC target of China and India include emission intensity targets and targets for non-fossil fuels in primary energy consumption and power capacity. The combined effect of intensity targets and the non-fossil targets depend on the projected GDP and energy consumption in the current policies scenarios based on the shared socioeconomic pathways (SSPs) [20]. Socioeconomic baseline uncertainties also influence international bunkers emissions, and NDC projections for countries with NDCs that have incomplete coverage of national GHG emissions and countries with NDC targets that cannot be quantified.
Uncertainty in current policies scenarios. Some countries, such as Iran and Turkey, have NDC targets above current policies projections from most national and global studies [8]. For other countries, such as India and Russia, it is not as clear cut as there is quite an overlap in emission projections resulting from current policies and NDC projections [8]. In many cases it is therefore unclear whether the current policy trajectory or the NDC target is more restrictive, as this depends on socioeconomic baseline variation and overachievement of current policies. We therefore cap NDC projections at current policies scenario levels as surplus credits cannot be traded following the agreed rulebook for Article 6 in the Paris Agreement [21], addressing that the emission mitigation activities should be 'additional' [22–24]. Here, we assume two cases for the capping of the NDC projections: the current policies scenario of IMAGE for SSP1, SSP2 and SSP3 (default), or the upper range of the current policies projections of the UNEP Assessment [8]. The latter is higher than the IMAGE current policies estimate for most G20 economies.
Peaking year of emissions in China. The NDC emissions projection of China mainly depends on a combination of targets that include non-fossil energy targets, CO2 emissions peak before 2030 and emission intensity reduction targets. The year in which emissions peak highly influences China's and global emission projection [25]. This study assumes two peaking years (2025 and 2030), based on [25].
2.2. Policy choices and model/technical uncertainties
Following the differentiation of different types of uncertainties that affect NDCs in [10], we divided the uncertainties that were introduced above between policy choices and model/technical uncertainties. This separation is not absolute since both influence each other. Different datasets of historical emissions were treated as a model/technical uncertainty because of the variation of accounting methods and definitions applied in them. It is especially a technical uncertainty regarding non-Annex I countries because their national GHG emission inventories submitted to UNFCCC usually includes significant data gaps [15]. Socioeconomic baseline variation is also considered a model/technical uncertainty since SSPs are model outcomes based on assumptions about future emission drivers. Conditionality, overachievement of NDCs and range specification are policy uncertainties since these are directly dependent on choices made by policymakers. Variation in baseline emissions was also treated as a policy choice since the countries choose which reference year to use as well as the emission level (although, changes in emissions for the reference level may be due to updates in methodologies).
3. Methods
This section describes the data collection and methodology by first presenting the different types of emission scenarios, followed by a description of how the uncertainty factors were managed to calculate the GHG emissions projections in CO2 equivalent terms 10 . Finally, the methodology for three types of uncertainty analysis is described.
3.1. Scenarios
3.1.1. Unconditional and conditional NDC scenarios
The NDC scenario assumes full implementation of NDC targets, using latest NDCs (as of 23 September 2022). Several countries have distinguished unconditional and conditional targets 11 in their NDCs. Therefore, we included unconditional and conditional NDC scenarios. For countries whose NDCs include unconditional targets only, emission levels are assumed to be the same in both scenarios. For countries having only conditional NDC targets, unconditional NDC emission levels were assumed to equal to those from the current policies scenario. The impact of the full implementation of the NDCs on GHG emissions to 2030 was also projected using the IMAGE model as described in [6] supplementary text 2 presents the NDC targets for the G20 economies.
3.1.2. Current policies scenario of IMAGE
The effect of policies on GHG emissions in all sectors up to 2030 was projected using the integrated assessment model IMAGE [26], which includes the TIMER energy system model. Current climate and energy policies from G20 economies, as identified in the public database on climate policies [27] 12 , the ENGAGE project and policy overview updates [28–30], were added on top of the updated IMAGE SSP2 reference scenario [9, 30], including the impacts of COVID-19 [31] (supplementary text 3). For this study, the current policies scenario projections for the IMAGE SSP1 and SSP3 scenarios were calculated using the same methodology [30] 13 .
3.2. Implementation of the uncertainty dimensions
Table 1 presents each uncertainty factor's data source and information about how data was used in our calculations (see additional data processing steps in supplementary text 4 and figure S.1). Compared to Rogelj et al [10], we did not consider two uncertainty factors related to China: alternative energy accounting methods, and the attribution of non-commercial biomass. On the former, we interpreted China's energy targets by precisely following its official energy accounting methods in this article; on the latter, we concluded that the impact of accounting traditional biomass use as renewable energy is limited in 2030 following the latest assessment by the IEA [32].
3.3. Uncertainty analysis
One-factor analysis. An uncertainty analysis was performed to assess the impact of different uncertainty factors on GHG emission projections. We conducted a one factor analysis, where one factor changed (see figure 1) while the others stayed the same [41]. The difference between the projected emission level of the default setting and the value when one uncertainty factor had changed was analysed. This method is a simple and direct way of analysing the effect of one parameter but provides no information regarding the interactions among the parameters [42, 43].
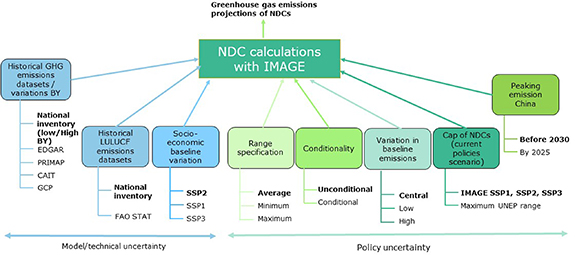
Figure 1. Overview of the uncertainty factors analysed, including the different sub-categories of each factor. The bold text represents the default setting.
Download figure:
Standard image High-resolution imageFull-factorial analysis. Second, we conducted a full-factorial analysis to quantify the output uncertainty in emission projections for all possible NDC scenarios. This analysis includes the full 2030 emission range implied by 2160 NDC scenarios, based on all combinations of uncertainty factors' sub-categories for the 26 assessed countries and the world (figure 1). There were 30 different current policies scenarios of IMAGE generated by the five different historical emission datasets, two LULUCF emissions datasets and the three SSPs scenarios.
A linear regression was then applied to estimate the contribution of the setting of each factor to the total GHG emissions in 2030 (see supplementary text 5 for the regression model). This approach is based on the combinations of all factors, and takes into account the overlap between factors' impacts.
4. Results
4.1. One-factor analysis—global
The projected 2030 global emission level for the default settings is about 52.5 GtCO2eq if all unconditional NDCs are implemented, and 51 GtCO2eq if conditional NDCs are implemented (supplementary text 6, table S.4). The impact of the uncertainty factors on projected global GHG emissions was explored through the one-factor analysis (figure 2(a)) (see supplementary text 7 for country figures).
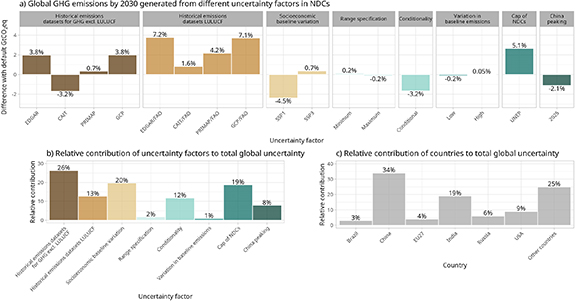
Figure 2. (a) The global result from the one-factor analysis, showing projected GHG emission levels based on NDC targets for 2030 which are grouped according to different uncertainty factors. The uncertainty range of the impact of the low and high base-year emissions levels is not shown, but is limited (between −0.3% and 0.3%). The black line represents the emission projections generated by the default setting. The numbers give the difference with the default projection. (b) and (c) The relative contribution to the total uncertainty range in 2030 emissions for each uncertainty factor and individual countries.
Download figure:
Standard image High-resolution imageThe projected 2030 GHG emissions for the unconditional NDCs varies from −2.4 to +3.8 GtCO2eq (or −4.5% to 7%) around the default global estimate of the unconditional NDC. The use of different historical emissions datasets leads to the highest variation in global emissions (figures 2(a) and (b)) 14 . In particular, the GHG emissions datasets (excluding LULUCF) in combination with the LULUCF emissions dataset FAO leads to higher emissions projections than the combination with the LULUCF national inventory data. EDGAR/FAO and GCP/FAO lead to about 7% higher emissions than for the national inventory data (default). Both datasets consists of independent GHG emissions estimates, whereas CAIT and PRIMAP also includes national inventory data (table 1) and therefore these are closer to the default case. Another explanation for differences between EDGAR/FAO or GCP/FAO, and national inventory data is because the former applies generic emissions factors whereas the latter uses emissions factors that are adjusted for national circumstances. Uncertainties in socioeconomic developments are the second dominant factor globally (−2.4 to +0.4 GtCO2eq from SSP1 and SSP3), followed by the impact of the upper range of the UNEP [8] current policies projections on NDCs emission caps (+2.7 GtCO2eq, mainly from China, India and Russia, and other countries), and the conditional NDCs (−1.7 GtCO2eq, mainly from Indonesia and Mexico). Finally, it should be noted that that the order of importance for factors are different for global and countries, as shown in supplementary text 7. In addition, not all countries contribute equally to the total uncertainty. China and India are together responsible for more than half of the uncertainty, while their share in total emissions in 2030 is about 35% (figure 2(c)).
With the linear regression model, we can also calculate the contributions of the different uncertainty factors, but now accounting for the overlap between factors' impacts. The regression coefficients of this model (see table S.3, supplementary text 5), representing the contribution of the factors, lead to similar contributions of the factors as the one-factor analysis (figures 2(a) and (b)), and therefore similar findings. The regression model only shows a higher impact of NDCs emission caps (+3.5 instead of +2.7 GtCO2eq), since it accounts for variations in SSP scenarios.
4.2. Full-factorial analysis—global
In the full-factorial analysis, 2160 NDC scenarios and 30 IMAGE current policies scenarios per country and the world were generated, representing all possible combinations that were explored separately in the previous individual uncertainty analysis. Table 2 and figures 3(a) and (b) present the distribution of global emission projections from the NDCs and current policies by 2030 and 2015. Most NDC scenarios result in 2030 emission levels between 51–55 GtCO2eq (25th–75th percentile range), with 53 GtCO2eq as average and median estimate. For the IMAGE current policies scenarios, emissions levels are 3–4 GtCO2eq higher, and the average and median global emission level are about 57 GtCO2eq.
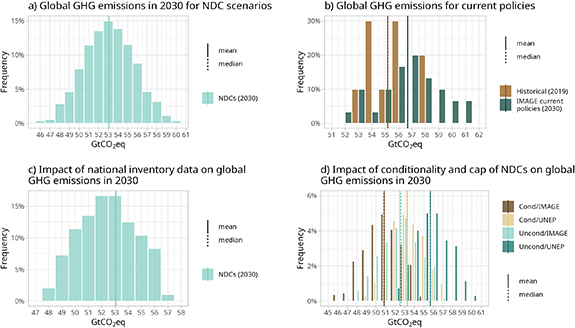
Figure 3. Frequency distribution of 2030 global GHG emission projections according to NDC targets (a) for all uncertainties, (c) grouped for fixed historical national inventory data and (d) grouped according to uncertainty in conditionality (conditional or unconditional) and related to the cap of NDCs (current policies of IMAGE, or the upper range of the current policies estimate of UNEP). In comparison, also the impact on (b) the GHG projections of 2030 under the IMAGE current policies projection is shown.
Download figure:
Standard image High-resolution imageTable 2. GHG emission projections (GtCO2eq) for the world and six major emitters to NDC targets for 2030 and IMAGE current policies from the full-factorial analysis.
| Country | World | Brazil | China | EU27 | India | USA | Russia |
|---|---|---|---|---|---|---|---|
| NDC scenarios (2030) | |||||||
| Average (median) | 53.1 (53.1) | 1.4 (1.4) | 13.9 (13.8) | 2.1 (2.1) | 4.4 (4.4) | 3.2 (3.3) | 2.2 (2.2) |
| 25th–75th percentile | 51.2–54.9 | 1.3–1.5 | 13.0–14.6 | 1.9–2.1 | 4.0–4.8 | 3.1–3.3 | 1.8–2.4 |
| Min-Max | 46.1–60.0 | 1.2–1.6 | 11.6–16.3 | 1.7–2.2 | 3.4–5.9 | 2.5–3.8 | 1.8–2.7 |
| IMAGE current policies scenarios (2030) | |||||||
| Average (median) | 56.7 (56.7) | 1.9 (1.9) | 14.2 (14.2) | 2.3 (2.3) | 4.0 (4.0) | 4.6 (4.6) | 1.9 (1.8) |
| 25th–75th percentile | 54.8–58.3 | 1.7–2.0 | 13.7–14.8 | 2.1–2.4 | 3.7–4.3 | 4.4–4.8 | 1.8–2.0 |
| Min-Max | 52.5–60.6 | 1.6–2.2 | 12.4–15.5 | 1.9–2.6 | 3.4–4.8 | 3.9–5.3 | 1.8–2.2 |
| 2019 emissions estimate | |||||||
| Average (median) | 55.2 (55.2) | 1.5 (1.5) | 12.6 (12.6) | 3.4 (3.4) | 3.3 (3.3) | 5.8 (5.8) | 1.7 (1.6) |
| 25th–75th percentile | 53.8–55.9 | 1.4–1.7 | 12.2–12.9 | 3.4–3.4 | 2.9–3.6 | 5.8–5.9 | 1.6–1.8 |
| Min-Max | 52.8–57.7 | 1.4–1.7 | 11.6–13.4 | 3.4–3.5 | 2.9–3.8 | 5.3–6.3 | 1.6–1.9 |
The emission estimate range by 2015 and 2019 is 52 (50–54) and 55 (53–58) GtCO2eq respectively, which is within the 2015 emissions range of the current policies scenarios of UNEP [8], and the 2019 emissions range of the IPCC AR6 range [44]. 15 If historical emissions are only based on national inventory data, it strongly reduces the range of projected GHG emissions (compared figure 3(c) with (a)). Figure 3(d) shows the impact of grouping the scenarios according to two major policy uncertainties, conditionality and the cap of NDCs influenced by the current policies. Scenarios assuming a maximum cap of NDCs (maximum of UNEP current policies estimates) and unconditional NDCs generate higher level of emissions compared to scenarios assuming a cap based on IMAGE current policies and conditional NDCs. The median and average values for these four groups indicate that the cap has an impact of 2.5–3.2 GtCO2eq and conditionality has an impact of 1.6–2.4 GtCO2eq.
4.3. Policy and model/technical uncertainty—global
The impact of the policy choices was explored by applying the default settings only for the model/technical uncertainties, and vice versa. For example, when policy uncertainty was assessed, the historical emissions datasets and socioeconomic baseline variation were set to default settings (figure 1; supplementary text 6). This assessment was only applied for NDC scenarios on a global level. Of the policy uncertainty factors, the dominating factor is NDCs caps as implied by the minimum of current policy projections, followed by China's peaking emissions, conditionality and range. The 72 scenarios generated a minimum-maximum emission range of 49–56 GtCO2eq (figure 4(a)). Within the model/technical uncertainty, the dominating factor is the historical emission dataset EDGAR or GCP combined with land use emissions of FAO (highest estimate) and the SSP1 scenario (lowest estimates). The full emission range for model/technical uncertainties is 49–56 GtCO2eq based on 30 scenarios (figure 4(b)), and a median estimate of 53 GtCO2eq. Overall, policy uncertainties generate a similar uncertainty range compared to model/technical uncertainties, which was also shown in figure 2(b) based on the one-factor analysis. Concluding, policy choices have an important contribution to uncertainty in the NDC-based GHG emissions projections.

Figure 4. Frequency distribution of the global 2030 GHG emission projections according to NDC targets, focusing on (a) policy uncertainty and (b) model/technical uncertainty.
Download figure:
Standard image High-resolution image4.4. Full-factorial analysis—countries
Results from the analysis of six major emitting countries are presented in table 2, including values for the full uncertainty range of emission projections from the NDC and current policy scenarios and the full variation in historical emissions (supplementary text 8: table S.6 for national inventory data only). Frequency-diagrams for the estimates for each of the six countries are presented in figure 5, and for each of the other 20 countries are given in supplementary figure S.9. For Russia and India, most NDC scenarios generate higher emissions than IMAGE current policies scenarios for 2030. For Brazil, China, EU and USA, the emission projections for most NDC scenarios are lower than the 2030 emission levels based on IMAGE current policies. The smallest relative difference existed for China and the EU, followed by USA and Brazil. For China, NDC scenarios with peaking by 2025 have the lowest emission level, below the IMAGE current policies' emissions projection. Socioeconomic baseline variation influenced EU's emission projections, because the EU overachieves the NDC target in IMAGE current policies scenario under SSP1, leading to the lowest emissions projection for the NDC.

Figure 5. Frequency distribution of 2030 GHG emission projections for Brazil, China, EU, India, Russia and USA according to NDC targets and IMAGE current policies projection. Figure also shows the emissions estimate of 2019. The number of NDC scenario variants for Brazil, China, EU, India, Russia and USA are: 90, 360, 60, 360, 180 and 90.
Download figure:
Standard image High-resolution image
For India's unconditional NDC scenario, the emissions intensity target is assumed to apply to total GHG emissions excluding LULUCF emissions, and, if adding LULUCF emissions, projected GHG emission levels is 5.1, 4.8 and 4.5 GtCO2eq in 2030 for the SSP1, SSP2 and SSP3, respectively. The scenarios with the highest emission level had SSP1 as socioeconomic baseline due to its highest economic growth. For the conditional NDC scenario, the implementation of the renewable target in the TIMER model projects about 1.0, 0.6 and 0.1 GtCO2eq additional reductions by 2030 compared to the unconditional scenario. As India overachieves its NDC target for all three SSP scenarios, the final emission targets for the unconditional NDC scenario is equal to the IMAGE current policies projections, leading to low total NDC emission projections for SSP1 and SSP3 (compared to SSP2), i.e. 3.4, 4.0 and 3.6 GtCO2eq in 2030 for the SSP1, SSP2 and SSP3, respectively. China's intensity target did not have the same impact on emission projections as for India. China's combination of NDC targets, especially the targets regarding peaking in CO2 emission by 2030, renewable energy and non-fossil targets, resulted in that the scenarios with the highest emission level included SSP3, as opposed to the result for India. The IMAGE current policies and NDC scenario for China are also identical, except for the NDC scenarios with a peaking in CO2 emission by 2025.
5. Discussion and conclusions
This study shows that there are important uncertainty factors that influence GHG emission projections under the latest NDCs. Together, these uncertainties lead to an estimated global emission level of 46–60 GtCO2eq by 2030 (median estimate: 53 GtCO2eq).
In comparison to Rogelj et al [10], this study shows important new insights. While the overall uncertainty range is consistent yet slightly smaller in absolute terms, the relative importance of contributing factors differs markedly. Because emissions in this study are capped to not go beyond current policy projections of IMAGE or UNEP, socio-economic baseline uncertainty contributes a much smaller share to the overall uncertainty compared to [10]. This insight is important for decision makers because a larger share of the full uncertainty is now attributed to aspects that can be influenced by policy decisions. Finally, this study expands and updates [10], apart from updated NDCs, by including additional uncertainty factors, such as uncertainty in historical land-use emissions, uncertainty in current policies scenario influencing the cap of the NDC target and uncertainty in peaking emissions in China (for further details on the comparison with [10], see supplementary text 9).
The presented results come with several research limitations and caveats. First, the importance of specific uncertainty factors in the overall uncertainty projections highly depends on the parameterisation of individual factors. For example, the impact of historical emissions depend on the selected historical emissions datasets and the impact of socio-economic variation depends on the selected SSP scenarios (SSP1-3). Neither of these ranges represents a probabilistic uncertainty quantification. Second, the uncertainty range of the NDC and current policies projections for China and India depends on the modelling framework, as the projections depend on the combined effect of NDC targets, such as renewable energy targets. Literature projections by national and global models show a wide range [8]. We addressed this limitation by capping the NDC emissions by the maximum of the current policies projections of UNEP [8]—a more robust, overarching assessment. Third, there are uncertainty sources beyond those analysed in this paper. For example, the impact of different LULUCF accounting rules and the sector coverage of NDCs was not analysed.
The analysis improves our understanding of NDCs by identifying which factors generate high uncertainty and/or are not sufficiently defined. Among the uncertainty factors assessed, policy uncertainties induced large uncertainties in NDC emissions, similar than induced by model/technical uncertainties.
The main policy uncertainty factor is the projected emissions of the current policies scenarios, that affect NDC projections when targets are above current policies. Its impact by capping the NDC emissions has increased since the previous NDCs, as the range of current policies' emissions projections has lowered since 2015 [8, 27] and the NDC targets for some countries, like Turkey, have not lowered. The second important policy uncertainty was conditionality. Countries' conditional targets will be implemented if the required international support (finance, technology transfer and/or capacity-building) is provided. The impact of conditionality is also smaller compared to [10], as (i) a higher number of updated NDCs—representing 80% of global emissions—are mainly unconditional [4, 5], and (ii) the NDC projections are constrained to the level resulting from current policies of IMAGE or UNEP. The latter has a significant effect on the (un)conditional NDC targets of India, Iran, Mexico, Russian Federation, Turkey, Vietnam and Ethiopia, as they are considerably higher than their current policies projections (supplementary text 6). A new important uncertainty factor relates to the peaking of China's emissions in terms of timing and its peaking emissions level. Finally, the other policy uncertainties related to range specifications and variations in baseline emissions have a relativity low impact on the full uncertainty. The contribution of range specification is less than 3% to overall uncertainty, which is significantly lower than before. This is mainly due to fewer countries with a range specifications and a lower range specification of the updated NDC of South Africa. Changes in baseline emissions have various reasons which can be divided in technical updates and fundamental changes [45]. Methods can be improved over time hence generate new reference values, but updates may also create accounting issues and implications on mitigation efforts. Measures to increase methodological consistency and transparency regarding information about the baselines could mitigate ambiguousness [45].
The most significant model/technical uncertainty factor on a global level was uncertainty in measuring historical emissions, which we estimate by using different historical datasets for all GHG emissions and land-use related emissions. The impact of the historical emissions variation remains high (about two-fifth of the overall uncertainty) due to the uncertainty in historical emissions, in particular for the variations in land-use emissions [13, 44, 46]. For the countries' NDC emissions projections in our default calculations we used national inventory data, and no variation in historical emissions, but evidently there are uncertainties here as well, which we explored here by using independent datasets. These independent inventories have the benefit of lowering the risk of being biased compared to national data. However, unless independent inventories can use country specific emission factors, the independent inventories may be less detailed and less accurate compared to national data since national data is usually more sensitive to the national circumstances. To increase the quality and reduce uncertainty in the national data, the dataset needs to be more complete and continuously updated.
The second most important model/technical uncertainty is socioeconomic baseline variation, which contributes to about one-fifth of the overall uncertainty. Its impact is much lower compared to [10], where it contributes to about half. This is due to multiple causes: (i) although the intensity targets of China's and India's NDCs still contribute largely to overall uncertainty, its impact is lower than before, as both countries do not have a range in their intensity targets anymore. In addition, China's non-fossil and peaking targets hold greater significance for NDC emissions projections as its intensity targets are already achieved under the current policies scenario [6, 29]. (ii) The group of countries with updated NDC targets that could not be quantified now only covers less than 5% of global emissions [4]. For these countries, current policy emission levels were assumed and therefore the uncertainty in current policy projections has a lower impact. (iii) There are more countries with GHG targets (BY and/or baseline targets, fixed level targets), representing about 60% of global emissions [4], which results in less variation due to differences in socio-economic baseline assumptions.
Our results also have implications for the GST process as they indicate policy measures to reduce uncertainties in future NDC updates. Policy uncertainty, for example, is related to how governments decide to formulate their NDCs. Thus, it could be reduced by policy choices that remove ambiguity or improve transparency and comparability to NDCs. Although this was also recommended by earlier studies [e.g. 10, 47–49], our results suggests lack of progress towards these recommendations to date. Some options to reduce policy uncertainty include:
- Improving national emission inventories which would clarify base year targets
- Submitting national emission projections under current policies to clarify baseline targets
- Providing assumptions of economic development to clarify intensity targets and
- Increasing the NDCs scope to cover all economic sectors and all GHGs
Less ambiguous NDC targets and better national emission inventories and projections would improve assessments of progression towards the Paris Agreement's temperature goal. First, countries need to submit regularly consistent and transparent national GHG inventories to UNFCCC. For many countries, important gaps exist in the data, which miss several years or important GHGs. Second, countries could improve transparency of the GDP projections used in their NDC targets indexed to economic growth, especially for China and India. The current NDCs do not include the assumed GDP growth, which result in large uncertainties about the committed emission level. Third, countries need to submit official GHG emission projections based on current policies, such as the 'with measures scenarios under the Biennial Update Reports [34]. Such projections could reduce uncertainty for NDC targets that are related to future GHG emission values as well as for calculating emission levels if NDC targets are above current policies scenarios. Finally, all NDCs should include all sectors and GHGs. For example, China only includes CO2 emissions. Acknowledging and reducing uncertainty in GHG emission projections under NDCs gives us a more realistic estimate on the progress towards the Paris Agreement, and motivates needed climate action.
Acknowledgments
This work is supported by the European Union's Horizon 2020 research and innovation programme (Grant Agreement No. 821471: ENGAGE). We thank all colleagues involved, in particular Maarten van den Berg, Niklas Höhne, Elena Hooijschuur and Mark Roelfsema for their input and comments.
Data availability statement
All data that support the findings of this study are included within the article (and any supplementary files). Data will be available from 18 April 2023.
Conflict of interest
The authors declare no competing interests.
Footnotes
- 10
All GHG emission emissions are expressed using the 100 year global warming potential (GWPs) from the IPCC Fourth Assessment Report.
- 11
- 12
www.climatepolicydatabase.org.
- 13
- 14
The relative contribution of each factor is calculated as the uncertainty (minimum–maximum) range of one factor relative to the sum of uncertainty ranges of all factors (14 GtCO2eq). The latter only differs 1.5% of the minimum-maximum range of the NDC emissions projections from all combinations of factors (table 2).
- 15
The IPCC AR6 range of the GHG emissions in 2019 is 58 (52–65) GtCO2eq (corrected for GWPs AR4). The median estimate is higher due to higher LULUCF emissions estimates of about 5 GtCO2, whereas here it is about halve.