

Abstract
Recently, decellularized extracellular matrix-based bio-ink (dECM bio-ink) derived from animal organs is attracting attention because of its excellent biocompatibility. However, its poor 3D printability and weak mechanical properties remain a challenge. Here, we developed a new dECM bio-ink with enhanced 3D printability and mechanical properties. dECM micro-particles of about 13.4 μm in size were prepared by decellularizing a porcine liver followed by freeze-milling. The new bio-ink, named as dECM powder-based bio-ink (dECM pBio-ink), was prepared by loading the dECM micro-particles into a gelatin mixture. The usefulness of the dECM pBio-ink was evaluated by assessing its mechanical properties, printability, and cytocompatibility. The results showed that its mechanical properties and 3D printability were greatly improved. Its elastic modulus increased by up to 9.17 times that of the conventional dECM bio-ink. Micro-patterns with living cells were successfully achieved with 93% cell viability. Above all, the new bio-ink showed superior performance in stacking of layers for 3D printing, whereas the conventional bio-ink could not maintain its shape. Finally, we demonstrated that the dECM pBio-ink possessed comparable cytocompatibility with the conventional dECM bio-ink through in vitro tests with endothelial cells and primary mouse hepatocytes.
Export citation and abstract BibTeX RIS
1. Introduction
Bio-inks are one of the essential elements of 3D bioprinting technology for successful artificial tissue regeneration. It should have sufficient physical properties to not only allow 3D micro-patterning with living cells, but also protect the cells during the printing process [1]. In addition, it should provide a suitable environment for cell culture and artificial regeneration of tissues or organs. A variety of new bio-inks with enhanced physical and biological properties have been introduced [2, 3]. Among them, the recently introduced decellularized extracellular matrix-based bio-ink (dECM bio-ink) has received great attention from many researchers because of its excellent cytocompatibility [4–7]. Decellularization is a technique of selective removal of cellular components causing hostile immune response from animal organs such that only the ECM material remains. In this manner, the material achieves biomimetic and biochemical compositions including ECM fibers, growth factors, and other proteins of the organ. Many researchers are considering the process to obtain biomaterials that can provide an optimum environment for specific tissue regeneration [8–11].
The conventional dECM bio-ink is a thermo-crosslinkable material prepared by solubilizing decellularized tissue [4]. The dECM bio-ink shows great biocompatibility in artificial tissue regeneration including cardiac [12], adipose [13], skin [14] and liver tissue [6]. However, solubilized bio-inks have some drawbacks in terms of 3D printability and mechanical properties. The main component of the dECM bio-ink is thermoresponsive collagen; thus, its rheological property continuously varies during the printing process [15]. This makes it difficult to maintain consistent printability over long processing times. In addition, it has low viscosity and slow crosslinking speed. Therefore, it is inappropriate for the layer-by-layer process for the construction of 3D structures via bioprinting. Moreover, it is difficult to obtain repeatable physical properties because of the heterogeneity of the biochemical composition of an organ. This highly affects the rheological properties of the bio-ink and is a major cause of great deterioration of the repeatability of the printing process. Further, pepsin digestion, which is a process of solubilizing decellularized tissue for the preparation of the conventional dECM bio-ink, results in the degradation of the native structure and mechanical strength of the decellularized tissue [4]. The digestion process is also time-consuming and the physical properties of the bio-ink vary depending on the process conditions [16]. Moreover, several researchers reported that the digestion process could denature some biochemical components of dECM including protein and growth factors [17–19]. Thus, weak mechanical properties, low repeatability of physical properties, reduction of biochemical components, and slow crosslinking speed of the conventional dECM bio-ink are the major obstacles to its application to 3D bioprinting technology.
In this regard, several researchers introduced new technologies to improve the mechanical properties and 3D printability of the conventional dECM bio-ink [15, 20, 21]. Jang et al [20] showed that photosensitizing agents could significantly improve the stability and mechanical properties of the dECM bio-ink. However, their study did not show any significant improvement in 3D printability. Ahn et al [15] introduced a printing system equipped with heating modules to enable printing and thermo-crosslinking of dECM bio-inks at the same time. Choi et al [21] showed that gelatin granules could be used as a temporal supporting material for 3D printing of dECM bio-inks. They demonstrated that the new techniques could improve the 3D printability of dECM bio-inks. However, their studies could not address the weakness in mechanical properties of the dECM bio-ink.
In this research, we developed a new dECM bio-ink, named as dECM powder-based bio-ink (dECM pBio-ink), with enhanced 3D printability and mechanical properties along with the good cytocompatibility of the conventional dECM bio-ink. dECM micro-particles were used to prepare the new bio-ink instead of the solubilized form. Liver-derived dECM powder was prepared through decellularization and freeze-milling processes, and it was then loaded into a gelatin mixture to prepare the dECM pBio-ink without pepsin digestion. The physical and biological properties of bio-inks were evaluated through rheology, compression, degradation, and 3D printability tests and compared with those of the conventional dECM bio-ink. Finally, human umbilical vein endothelial cells (HUVEC) and primary mouse hepatocytes were applied to evaluate the cytocompatibility of the dECM pBio-ink.
2. Materials and methods
2.1. Decellularization and bio-ink preparation
2.1.1. Decellularization and preparation of dECM micro-particles with porcine liver
The porcine liver was purchased from a slaughterhouse and chopped into approximately 2-mm-thick pieces. The chopped porcine liver was gently washed with distilled water and the tissue sample was dipped in a detergent solution composed of 1%v/v Triton X-100 (Sigma, St Louis, MO, USA) and 0.1%v/v ammonia (Samchun Inc., KR) in distilled water for 12 h at 4 °C for decellularization. The detergent was changed every 6 h. Subsequently, the sample was washed with distilled water for 48 h to remove residual detergent. The decellularized sample was lyophilized and crushed into micro-particles using a freezer mill (6870D, Spex Sampleprep, New jersey, US). Then, a 100 μm pore sieve was used to obtain the fine powder. The dECM powder was sterilized using 70%v/v ethyl alcohol (Samchun) for 2 h at 4 °C followed by washing twice with distilled water. After sterilization, the powder was lyophilized and stored at −20 °C.
2.1.2. dECM powder-based bio-ink (dECM pBio-ink) preparation
dECM pBio-ink was prepared by loading the dECM powder into a gelatin mixture. A previously introduced gelatin mixture was used to prepare the bio-ink [1]. In brief, 3 mg ml−1 of hyaluronic acid (HA) (Sigma) was added into serum free α-MEM (Corning, NY, USA) and dissolved overnight by gentle rotation at 37 °C in an oven. Then, gelatin (Sigma) (37.5 mg ml−1) and fibrinogen (Sigma) (3 mg ml−1) were added and gently rotated for 1 h at the same temperature. The prepared gelatin mixture was sterilized with a filter (0.45 μm, Millipore, Danvers, MA). Finally, 1%, 2%, and 3% dECM pBio-inks were prepared by homogeneously mixing the gelatin mixture and the dECM powder at concentrations of 1%w/v, 2%w/v, and 3%w/v, respectively (figure 1). The prepared bio-ink was stored at −80 °C.
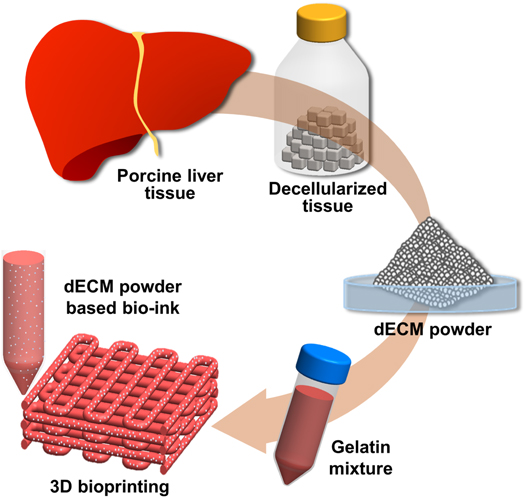
Figure 1. Schematic representation of preparation of dECM powder-based bio-ink and its application to bioprinting. Porcine liver tissue was decellularized and then crushed to powder. dECM powder-based bio-ink (dECM pBio-ink) was prepared by loading dECM powder into gelatin mixture and was applied to 3D bioprinting technology.
Download figure:
Standard image High-resolution image2.1.3. Conventional dECM bio-ink preparation
The conventional dECM bio-ink was prepared via digestion of the dECM powder and subsequent neutralization. The dECM powder (1 g) was digested with 0.1 N HCl solution (Sigma) supplemented with pepsin (100 mg, Sigma) for 48 h. Then, the pH of the digested solution was adjusted to 7.4 with 10 N NaOH (Sigma) solution, and 10%v/v of 10X PBS (Sigma) was added. The final concentration of dECM was controlled by adjusting the amount of dECM powder and pepsin. Through these procedures, 1%, 2%, and 3% conventional dECM bio-inks were prepared at dECM concentrations of 1%w/v, 2%w/v, and 3%w/v, respectively. The prepared solution was immediately placed on an ice bath to prevent gelation, and then stored at 4 °C.
2.2. Cell-laden bio-ink preparation
2.2.1. Cell preparation
NIH3T3 fibroblasts (ATCC, Manassas, VA, USA) were used for the gel degradation test, and HUVEC (ATCC, Manassas, VA, USA) and primary mouse hepatocyte were prepared for the cytocompatibility test. NIH3T3 was cultured with high glucose DMEM (Capricorn; Hesse, DE) supplemented with 10%v/v FBS (Capricorn) and 1%v/v penicillin/streptomycin (Capricorn) at 37 °C under 5% CO2. The medium was replaced every 2–3 d. HUVEC was cultured with Endothelial growth medium (EGM)—2 BulletKit (Lonza; Walkersville, MD, USA) and 6 μg ml−1 aprotinin (Sigma) at 37 °C under 5% CO2. Once the cells reached about 80% confluence, they were subcultured using 0.05% trypsin-EDTA (Capricorn). HUVEC at passage < 8 was used in this research. The primary hepatocytes were isolated from an 8 week old male C57BL/6 mouse through a two-step collagenase perfusion procedure [22]. The viability of the hepatocyte was investigated with the trypan blue exclusion test and was confirmed as more than 85%. The isolated hepatocytes were directly incorporated into the bio-ink. After printing, the cells were cultured with William's medium E (Gibco) supplemented with hepatocyte maintenance supplements (Thermo Fisher; MA, USA), 10%v/v FBS, and 6 μg ml−1 aprotinin in an incubator at 37 °C under 5% CO2. All isolation procedures were approved by the Institutional Animal Care and Use Committee of UNIST (IACUC protocol number: UNISTIACUC-17–22).
2.2.2. Cell-laden bio-ink preparation and its crosslinking
The conventional dECM bio-ink stored in 4 °C refrigerator was placed in an ice bath to prevent thermal curing and was gently mixed with the cells. The cell-laden bio-ink in liquid form was then loaded into a printing syringe. After printing, the dECM bio-ink was cured by incubating at 37 °C for 30 min. The frozen dECM pBio-ink or gelatin mixture was dissolved in a water bath at 37 °C. After carefully mixing with the cells, the cell-laden bio-ink was loaded into a 1 ml syringe and placed in an ice bath for 10 min for thermal crosslinking of gelatin in the bio-ink. Subsequently, the bio-ink-laden syringe was installed on a bioprinting system. After printing, a thrombin (Sigma) solution (10 U ml−1) was applied on the constructs, which were then incubated for 30 min at room temperature to induce fibrin gel crosslinking. The cell-laden bio-inks were prepared at concentrations of 1 × 10⁶ cells ml−1 for NIH3T3 and HUVEC, and 10 × 106 cells ml−1 for primary hepatocyte.
2.3. Characterization of dECM micro-particles
The prepared dECM micro-particles was characterized through quantifications of DNA, glycosaminoglycans (GAGs), and collagen content, histological analysis, sodium dodecyl sulfate polyacrylamide gel electrophoresis (SDS-PAGE), and by imaging with a scanning electron microscope. The detailed procedures are as follows.
2.3.1. DNA assay
The degree of decellularization was estimated by quantifying its DNA content as previously reported protocol [23]. In brief, the dECM and native liver tissue were lysed in Tris-EDTA buffer with 1%v/v SDS and 1.0 mg ml−1 proteinase K at 55 °C. Genomic DNA was precipitated using 5 M NaCl. After washing twice with 70%v/v EtOH, the DNA was resuspended in distilled water. The extracted genomic DNA was measured using Nanodrop (Thermo Scientific, MA, USA).
2.3.2. Glycosaminoglycans and collagen assay
The contents of GAGs and collagen, which are the main ECM components of liver tissue, were measured using the Blyscan GAGs assay kit (Biocolor Life Sciences, Carrickfergus, UK) and QuickZime total Collagen assay kit (QuickZime Bioscience, Leiden, Netherland), respectively. The assays were performed as per manufacturer's instructions. The absorbance was measured with a microplate reader (SpectraMax Plus 384 Microplate Reader, Molecular Devices, CA, USA) at 656 nm and 570 nm for quantification of GAG and collagen, respectively.
2.3.3. Histological analysis
The decellularized tissue and native tissue were fixed with a 4% paraformaldehyde solution at 4 °C overnight and then washed with distilled water for 6 h. After tissue processing and paraffin embedding, the samples were sectioned into 4 μm thick sections using a microtome. The sections were stained with hematoxylin and eosin (H&E) for histological analysis of the tissues.
2.3.4. SDS-PAGE
SDS-PAGE was performed to compare the protein compositions of the native liver tissue and dECM powder. Each sample was denatured in a sample buffer at 95 °C for 10 min. Polyacrylamide gel with concentrations of 8%w/v and 5%w/v were used for separating and stacking the gel, respectively. Each sample (15 μl) was loaded into the gel and stained with Coomassie Brilliant Blue for 30 min. The gel images were analyzed after de-staining with 20%v/v methanol in 10%v/v acetic acid solution.
2.3.5. Scanning electron microscopy
Scanning electron microscopy (SEM; S-4800; Hitachi High-Technologies Co., Tokyo, Japan) was used to investigate the size and morphology of the dECM micro-particles and microstructure of the dECM bio-inks. After crosslinking, the dECM bio-inks were fixed with 4% paraformaldehyde and dehydrated with 70%–100% ethyl alcohol. Then, freeze-drying was applied to prepare dried samples. The dECM bio-inks and micro-particles were fixed on a carbon tape and coated with Plutonium at 20 mA for 60 s using a sputter coater (E-1045; Hitachi High-Technologies Co., Tokyo, Japan). The SEM images were taken at 5.0 kV. After measuring the area of the micro-particles on the SEM image with Image J software (NIH, MD, USA), the size of the dECM particles was calculated by considering a circular shape using following equation.
The experiment including the preparation of micro-particles and size measurement were repeated three times.
2.4. Characterization of dECM pBio-inks
2.4.1. Measurement of physical properties
Rheological analysis and compression test were conducted to investigate the physical properties of the prepared bio-inks. The viscosity of the bio-inks was measured through shear sweep analysis. The analysis was conducted at 0.1–100 s−1 using a plate of 20 mm diameter at 18 °C on a HAAKE MARS III Rheometer (Thermo Scientific, MA, USA). The storage and loss modulus of crosslinked bio-inks were measured through frequency sweep analysis. The analysis was conducted in 0.1–10 Hz at 2% strain on a Kinexus pro + rheometer (Malvern Panalytical, Malvern, UK). Temperature sweep analysis was conducted for characterizing the thermal response of the conventional dECM bio-ink. It was conducted with temperature rate of +4 °C min−1 in a range of 4 °C–37 °C at 2% strain on Kinexus pro + rheometer. Finally, cylindrical samples of 5 mm diameter and 1 mm thickness were prepared with the crosslinked dECM pBio-ink, gelatin mixture and conventional dECM bio-ink for the compression test. After installing the specimens on the testing machine (Instron Model 3342; Illinois Tool Works Inc., MA, USA), they were slowly compressed at a rate of 1 mm min−1, and the corresponding force and compressed distance were recorded. After plotting the strain–stress curve, the compressive modulus was measured by calculating the slope of the stress–strain curve based on 10% strain.
2.4.2. In vitro degradation test
The degradation properties of dECM pBio-ink, conventional dECM bio-ink, and gelatin mixture were measured. NIH3T3 fibroblasts were encapsulated into the bio-inks at a concentration of 1 × 10⁶ cells ml−1, and each bio-ink (100 μl) was loaded and crosslinked on a petri dish. After culturing, the samples were collected and lyophilized, and their weights were individually measured.
2.5. 2D and 3D printability test
For 2D and 3D printability tests, 2% dECM pBio-ink, gelatin mixture, and 2% conventional dECM bio-ink were used. Figure 2 shows the 3D bioprinting system used in this study. The bioprinting system was composed of 3-axis stages, multi-dispensing modules, and an enclosure equipped with a temperature controller and humidifier. The 3-axis stages had 250 nm and 500 nm resolutions on the X&Y axes and Z axis, respectively. The multi-dispensing modules were equipped with a Nano master SMP-III (Musashi Engineering, TY, Japan) having 1 nl resolution. After loading the bio-ink-laden syringe into the bioprinter, 2D and 3D printability tests were conducted using a 200 μm nozzle at a dispensing rate of 0.5735 μl s−1 and printing speeds of 5–50 mm min−1. The enclosure of the bioprinter was maintained at 18 °C during the entire printing process. The variation in size of the bioprinted line were first investigated according to the change of printing speed. After printing, the line pattern was imaged with a microscope and then its width and height were measured using Image J software. Thereafter, the aspect ratio of the printed line was calculated by dividing the height by the width. The printability of the 2D lattice pattern, which has been widely used in tissue engineering studies, was also evaluated. After printing the pattern with pore sizes of 100–900 μm and layer thickness of 100 μm, the printed pore areas were measured with Image J software. Subsequently, the following equation was applied to calculate their shape fidelities.
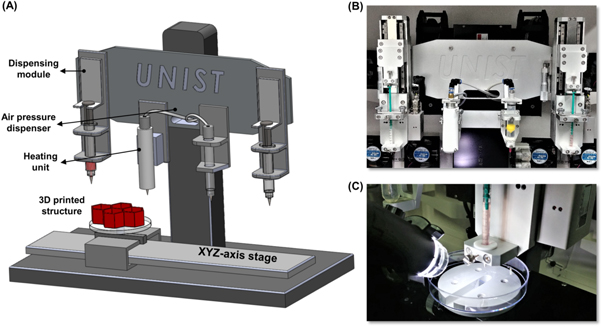
Figure 2. 3D bioprinting system. (A) Schematic illustration of 3D bioprinting system composed of a 3-axis stage and dispensing module. Photographs show the dispensing module with 4 printing heads (B) and 3D bioprinting process with dECM bio-ink (C).
Download figure:
Standard image High-resolution imageFinally, a liver shaped structure having a size of 14 × 10 mm2 and 13 layers was designed. The structures printed with dECM pBio-ink, gelatin mixture and conventional dECM bio-ink were compared to evaluate the 3D printability.
2.6. Cytocompatibility test
2.6.1. Cell viability test and length measurement
A live/dead cell viability assay kit (L-3224; Life Technologies) was used to assess the viability of the cells printed with 2% conventional dECM bio-ink, gelatin mixture, and 2% dECM pBio-ink. The assay solution was prepared by dissolving calcein-AM and ethidium homodimer-1 in PBS at concentrations of 0.5 μl ml−1 and 2 μl ml−1, respectively. After washing the samples with PBS twice, the assay solution was added followed by incubation at room temperature for 1 h. After obtaining images by fluorescence microscopy, the numbers of live and dead cells were counted using Image J software. The viability of the samples was calculated by dividing the number of live cells with the total number of cells. The cell length was calculated by measuring the major axis of live cells using Image J software.
2.6.2. Measurement of hepatic function
Albumin and urea secretions were measured to evaluate the functionality of the primary hepatocyte in the 2% conventional dECM bio-ink, gelatin mixture and 2% dECM pBio-ink for 2 weeks. The culture media were collected every 24 h and the albumin content in the culture media was quantified using a mouse albumin ELISA kit (Koma biotech; Seoul, KR) following the manufacturer's instruction. In brief, 100 μl of each culture medium was loaded into a 96-well plate, which was coated with goat anti mouse albumin antibody. Then, HRP-conjugated detection antibody was added followed by TMB solution. A microplate reader (SpectraMax Plus 384 Microplate Reader, Molecular Devices, CA, USA) was used to measure the absorbance of the samples at 450 nm wavelength. Urea secretion was quantified using a QuantiChrom urea assay kit (BioAssay Systems; CA, USA). According to the manufacturer's instruction, reagents (200 μl) were mixed with 50 μl of samples in a 96-well plate, and after 50 min of incubation, the absorbance was measured using a microplate reader at 480 nm. The in vitro experiment was repeated three times.
2.6.3. Immunofluorescence staining
Immunostaining was conducted to investigate the expression of cytochrome P450 reductase (CPR) and albumin of the primary hepatocyte. After culturing for 7 d, the printed samples were fixed with 4%w/v paraformaldehyde in PBS (pH 7.4) overnight at 4 °C. Then, the samples were washed three times with PBS and incubated in 0.1%v/v Triton X-100 solution for 15 min. Subsequently, they were immersed in 4%w/v BSA solution for 1 h to block unspecific binding of antibodies. Rabbit polyclonal primary Anti Cytochrome P450 Reductase antibody (Abcam; Cambridge, UK) and mouse polyclonal ALB Antibody (F-8) Alexa Fluor® 647 (SantaCruz Biotechnology; TX, USA) were diluted to 10 μg ml−1 and 2 μg ml−1 with 4%w/v BSA, respectively, and the samples were incubated in diluted antibody solution overnight at 4 °C. After washing, the incubated samples were submerged in 1:1000 diluted secondary goat anti rabbit IgG H&L Alexa Fluor 488 (Thermo fisher; MA, USA) for 1 h at room temperature. After washing three times with PBS, the nuclei were stained with a 1:1000 diluted Hoechst 33258 solution for 5 min. Finally, the samples were washed three times with PBS. The immunostaining results were analyzed using a FV1000SPD confocal laser scanning microscope (Olympus; TY, Japan).
2.7. Statistical analysis
All variables are expressed as mean ± standard deviation. Differences between the experimental groups were analyzed using one-way ANOVA and Tukey's multiple comparison test. In all analyzes, P < 0.05 was considered statistically significant.
3. Results and discussion
3.1. Decellularization and dECM pBio-ink
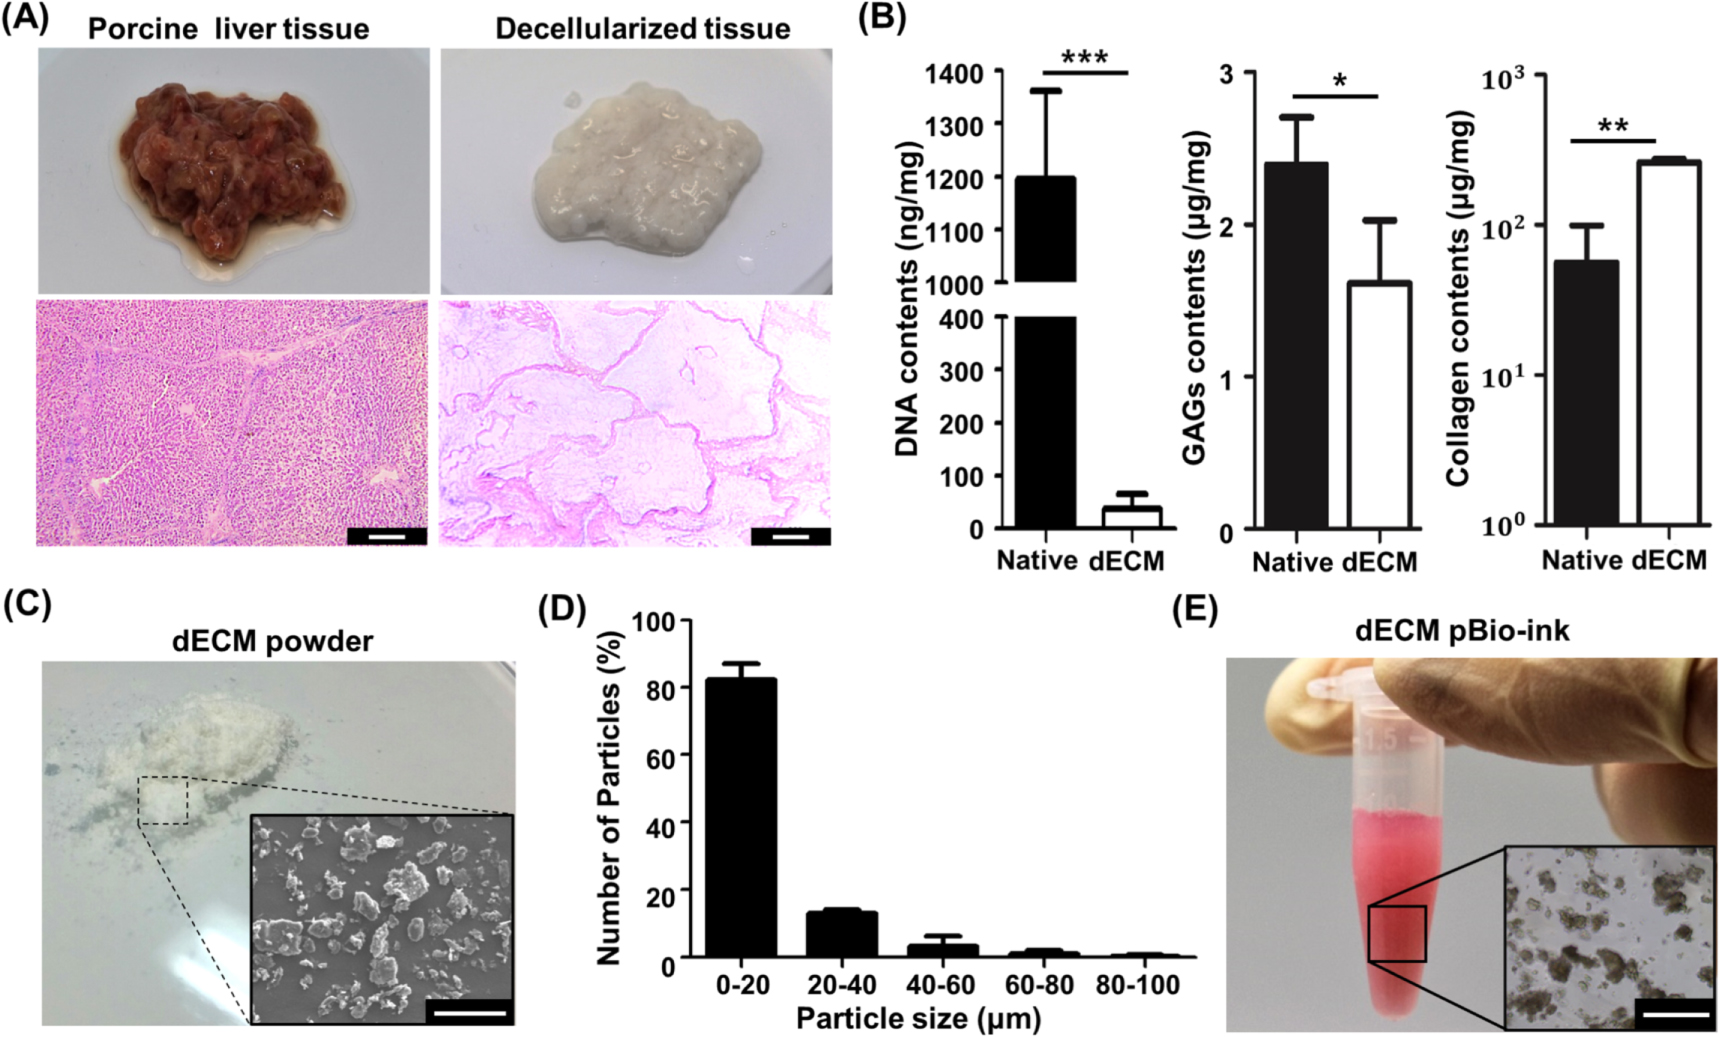
Porcine liver tissue was used for decellularization. The native tissue was rendered acellular through the decellularization process (figure 3(A)). The decellularized tissue was evaluated through histological and biochemical assays. H&E staining results confirmed the absence of cellular components and the preservation of ECM of the liver tissue (bottom images in figure 3(A)). The efficiency of the decellularization process was confirmed by quantitative analyzes of DNA, GAGs, and collagen (figure 3(B)). After decellularization, about 97% of DNA content was removed from the native liver tissue and only 36.62 ± 25.88 ng mg−1 of DNA was detected in the dECM material. The main ECM components such as GAGs and collagen were well sustained in the decellularized liver tissue. The contents of GAGs and collagen in the decellularized tissue were measured as 1.61 ± 0.41 and 260.99 ± 131.89 μg mg−1. In this measurement, the collagen content of the dECM material was higher than that of native liver because the collagen content is expressed in concentration and the dECM material contained only ECM without cellular components. Similar results have frequently been reported in studies related to decellularization [24, 25]. SDS-PAGE revealed the presence of various proteins in the dECM (supplementary figure 1 is available online at stacks.iop.org/BF/12/025003/mmedia). It was confirmed that the dECM material obtained through the decellularization process had a biochemical composition similar to that of the native tissue. Temperature sweep analysis was conducted to investigate thermal crosslinking of 2% conventional dECM bio-ink. The result showed that its modulus increased rapidly at around 37 °C (supplementary figure 2) and confirmed that the conventional dECM bio-ink could be thermally crosslinked.

Figure 3. Prepared dECM pBio-ink and its histological and biochemical assay results. (A) Photographs (upper) and corresponding H&E staining results (lower) of native porcine liver and decellularized tissue (scale bar: 200 μm). (B) Quantification of DNA (n = 5), GAGs (n = 5), and collagen contents (n = 3) in native tissue and dECM material (*p < 0.05; **p < 0.005; ***p < 0.001). (C) Gross appearance of dECM powder prepared through lyophilization and freeze-milling. SEM image of dECM powder (inset) (scale bar: 50 μm). (D) Size distribution of dECM particles (n = 3). (E) Photograph of prepared dECM pBio-ink composed of dECM micro-particles and gelatin mixture. dECM micro-particles in dECM pBio-ink (inset) (scale bar: 200 μm).
Download figure:
Standard image High-resolution imagedECM particles were prepared through freeze-milling and sieving of the decellularized tissue (figure 3(C)). Figure 3(D) shows the size distribution of the prepared dECM micro-particles. As shown in the figure, more than 97% of the dECM particles were less than 50 μm in size and their average size was 13.37 ± 12.95 μm. None of the particles were over 100 μm in size. dECM pBio-ink was prepared by loading the dECM micro-particles into gelatin mixture (figure 3(E)). Homogeneous distribution of the dECM particles in the dECM pBio-ink was confirmed through microscope observations. In addition, coagulation or precipitation of dECM particles in the ink was not observed during the prolonged printing process owing to its high viscosity. Brown et al [26] and Zhai et al [27] reported that dECM micro-particles of about 50 μm in size could enhance adipogenic- and chondrogenic-differentiation, respectively. Based on these reports, this study attempted to prepare fine dECM micro-particles through sieving. As a result, dECM particles with sizes of few tens of micrometers were prepared. Nevertheless, it is noteworthy that cytocompatibility of dECM micro-particles can be further improved through precise control of the size and uniformity. We will investigate the size effect on the cytocompatibility of the dECM bio-ink in further studies.
3.2. Degradation characteristics
In vitro degradation tests using NIH3T3 fibroblasts were performed for the dECM pBio-ink, conventional dECM bio-ink, and gelatin mixture. Figure 4 shows photograph and measured weights of the samples under the degradation tests. As shown in the figure, the gelatin mixture rapidly degraded during the culturing of the fibroblasts. After 3 d, the gelatin mixture could be barely observed (figure 4(A)). On the other hand, dECM bio-inks showed much lower degradation rates than the gelatin mixture. Degradation of the conventional dECM bio-inks proceeded slowly at all prepared concentrations for 12 d (left graph of figure 4(B)). The dECM pBio-ink rapidly degraded in the first 3 d, after which no further degradation was observed until 12 d (right graph of figure 4(B)). As the concentration of the dECM powder was increased, the initial degradation rate tended to decrease, but thereafter, a sharp decrease in degradation rate was similarly observed at all concentrations. The rapid degradation of the dECM pBio-ink in the initial stage was caused by degradation of the gelatin mixture in the bio-ink. These results confirm that dECM pBio-ink could be stably maintained after the initial rapid degradation.

Figure 4. In vitro degradation characteristics. (A) Gross appearance of conventional dECM bio-ink, gelatin mixture, and dECM pBio-ink. NIH3T3 fibroblasts were encapsulated in the bio-inks at a concentration of 1 × 10⁶ cells ml−1 (scale bar: 5 mm). (B) Dry weight of remaining bio-inks (n = 3).
Download figure:
Standard image High-resolution image3.3. Mechanical properties and microstructure of bio-ink
The rheological properties were analyzed by measuring the viscosity of the conventional dECM bio-ink, gelatin mixture, and dECM pBio-ink (figure 5(A)). As shown in the figure, the dECM pBio-ink had about 8–35 times larger viscosity than the conventional dECM bio-ink. This was mainly caused by the high viscosity of the gelatin mixture used for the preparation of the dECM pBio-ink. This viscosity could affect the homogeneity of the powder dispersion within the new bio-ink. At low viscosity, the dECM powder precipitated during printing due to gravity, which induced nozzle clogging. In this study, the high viscosity of the gelatin mixture prevented powder precipitation in the dECM pBio-ink. The dECM powder was evenly distributed and well maintained in the new bio-ink, and no nozzle clogging was observed in dECM pBio-ink during printing over several hours. In addition, every bio-ink group showed a similar shear thinning behavior in the shear rate range. The shear thinning effect of the bio-inks is an important property; according to this hydrogel characteristics, the viscosities of the bio-inks decrease at higher shear rates [28–31]. While dispensing a bio-ink, the shear stress between the inside wall of the nozzle and the material can damage the cell membrane [32, 33]. Therefore, viscosity decrease caused by the shear thinning effect is beneficial for reducing cell damage during printing. In this study, dECM pBio-ink had a similar shear thinning effect as the conventional dECM bio-ink. The viscosity of the bio-inks increased with increasing amounts of dECM powder, but these amounts did not affect the shear thinning property of the material.

Figure 5. Mechanical properties and SEM images of dECM bio-inks. Viscosity (A) and storage (G') and loss (G'') modulus (B) of the conventional dECM bio-inks, gelatin mixture, and dECM pBio-inks measured by rheological testing (n = 3). (C) Elastic modulus measured by compressive testing (n = 3) (*p < 0.05; **p < 0.005; ***p < 0.001). (D) SEM images of crosslinked bio-inks. White arrows indicate the loaded dECM micro-particles (scale bar: 2 μm).
Download figure:
Standard image High-resolution imageStorage (G') and loss (G'') modulus of crosslinked dECM bio-inks were measured through frequency sweep analysis (figure 5(B)). As shown in the figure, the storage modulus of the all bio-inks was higher than loss modulus in the frequency range, and storage and loss modulus increased simultaneously as dECM contents increased in the bio-inks. dECM pBio-ink showed the highest modulus at about 1.6–2.6 times higher than that of the gelatin mixture. These results confirm that all prepared dECM bio-inks can maintain the hydrogel form under dynamic conditions.
In this study, the elastic modulus of the prepared bio-inks were also measured through compressive testing (figure 5(C)). The gelatin mixture, which did not contain any dECM powder, showed a modulus similar to that of the conventional dECM bio-ink. On the other hand, the elastic modulus of dECM pBio-ink increased depending on the concentration of dECM powder. Compared to the conventional dECM bio-ink, dECM pBio-ink had 3.4–9.17 times larger elastic modulus. It was confirmed that the elastic modulus of dECM pBio-ink could be controlled by adjusting the dECM powder content. In addition, dECM pBio-ink could be used to fabricate a structure possessing greatly improved mechanical properties compared to those of the conventional dECM bio-ink. This enhancement improved the integrity of the printed structures [34, 35].
Finally, microstructures of 2% conventional dECM bio-ink, gelatin mixture, and 2% dECM pBio-ink were investigated through SEM imaging (figure 5(D)). As shown in the figures, all bio-inks were composed of the micro-fibril network. dECM pBio-ink had denser fibril network than the gelatin mixture, and dECM micro-particles were also observed. The difference in microstructure between the gelatin mixture and dECM pBio-ink, attributable to the effect of dECM micro-particles in crosslinking, would affect their mechanical properties. The dECM micro-particles may also relieve the concentration of local stress in the micro-fibril network through energy dissipation, resulting in a more uniform distribution of stress [36]. Xiaohong et al [37] showed that energy dissipation by poly (lactic-co-glycolic acid) micro-particles significantly increased the storage modulus of chitosan composite hydrogel. The increase of modulus by dECM particles was also observed in this study. In addition, various studies have reported that mechanical properties could be improved through the development of micro/nano-particle-laden composite hydrogels [38–41].
3.4. 2D and 3D printability test results
2D and 3D printability was investigated with 2% dECM pBio-ink, 2% conventional dECM bio-ink, and gelatin mixture. First, the width and height of lines printed with 200 μm nozzle were measured according to changes in printing speed (figure 6(A)). Figures 6(B) and (C) show the measurement results. As shown in the figures, the width and height of the printed lines exponentially decreased with increasing printing speed. The dECM pBio-ink group had a line pattern with higher height and narrower width than the conventional dECM bio-ink group, and the gelatin mixture group had medium-sized patterns. Minimum line widths that could be printed with the dECM pBio-ink, gelatin mixture, and conventional dECM bio-ink using the 200 μm nozzle were approximately 215, 280, and 383 μm, respectively (supplementary figure 3). The tendency for printability of the three bio-inks is more clearly shown in a graph of aspect ratio (figure 6(D)). At printing speeds above 10 mm min−1, as shown in the graph, the aspect ratio of the printed lines remained constant, and the dECM pBio-ink group showed the highest aspect ratio among the three groups. The dECM pBio-ink group showed an aspect ratio about 2.86 times higher than that of the conventional dECM bio-ink group at a printing speed of 50 mm min−1.

Figure 6. 2D and 3D printability test results. (A) Schematic illustration of line patterning test. Measurement results of width (B) and height (C) of the lines printed with 2% conventional dECM bio-ink, gelatin mixture, and 2% dECM pBio-ink with varying printing speeds. (D) Aspect ratio of the printed lines. Microscope image (E) (scale bar: 200 μm) and measured shape fidelity (F) of printed lattice patterns with varying pore sizes. The shape fidelity is the percentage of the printed pore area relative to the designed value. (G) Printing results of liver shaped structure with the three bio-inks. Single-layered 2D pattern and 13-layered 3D structure were designed and printed. The photographs show the top and side view of the designed and printed structures (scale bar: 5 mm). Black dotted lines in side view indicate the boundary of the printed structures.
Download figure:
Standard image High-resolution image2D patterning tests were also performed with the bio-inks by printing a lattice pattern, which is widely used in tissue engineering studies. Figures 6(E) and (F) show photographs and measured shape fidelities of the printed structure with designed pore sizes of 300–900 μm. As shown in the figures, dECM pBio-ink demonstrated the best 2D printability. In the printing of 300 × 300 μm2 pores, the conventional dECM bio-ink group produced partially closed pores (figures 6(E)). This feature was observed in the printing of 100 × 100 μm2 pores in the dECM pBio-ink and gelatin mixture group (data not shown). In the measurement of shape fidelity, dECM pBio-ink showed the highest value among the three bio-inks, indicating that the pattern produced with dECM pBio-ink was the most similar to the designed pattern (figure 6(F)).
Finally, we printed liver shaped structures using the three bio-inks to investigate their 3D printability. Figure 6(G) shows images of the designed and printed structures. In the 2D patterning, as shown in the figures, every group showed well-constructed patterns. However, conventional dECM bio-ink did not maintain the pore structure during 3D printing. The pore architecture collapsed during layering, as shown in the image of the 3D structure. The rectangular shape (side view image) of the design was also not maintained and transformed into an elliptical shape (side view image). On the other hand, in the dECM pBio-ink and gelatin mixture group, the designed pore and side shape were well maintained during the stacking of 13 layers. These results confirm that dECM pBio-ink had much better printability than the conventional dECM bio-ink for 3D printing without the requirement of any additional device or supporting material.
The results showed that dECM pBio-ink had the best 2D and 3D printability among the three bio-inks. The dECM pBio-ink could produce a line pattern with high aspect ratio and a lattice pattern with good shape fidelity. The bio-ink also facilitated the layer-by-layer process, which is one of the most important processes in 3D printing. On the other hand, the structure collapsed during the stacking process with the conventional dECM bio-ink. This advantage of the new dECM pBio-ink enables precise 3D printing of various features for artificial tissue/organ regeneration with dECM materials.
3.5. Cytocompatibility test results
We compared the cytocompatibility of dECM pBio-ink, conventional dECM bio-ink, and gelatin mixture using HUVEC and primary mouse hepatocytes. Live/dead staining was first performed with HUVEC-laden bio-ink (figure 7(A)), and the cell viability was calculated using Image J software (figure 7(B)). As shown in the graph, more than 90% of the cell viability was retained for 7 d in all groups, and there was no significant difference. To examine the degree of morphology change, the lengths of HUVEC were measured (figure 7(C)). The results showed that the lengths increased during culturing in every group. Although the gelatin mixture had the highest value in length on day 7, no significant difference was observed between the three bio-ink groups.

Figure 7. Cytocompatibility test results with HUVEC. (A) Fluorescence images of live/dead stained samples on day 0 and day 7. HUVEC was encapsulated within the gelatin mixture, 2% conventional dECM bio-ink, and 2% dECM pBio-ink at a concentration of 1 × 10⁶ cells ml−1 and then printed (scale bar: 100 μm). (B) Calculated cell viability of cultured HUVEC in dECM bio-inks (n = 3). (C) Measured length of major axis of cultured HUVEC (n = 3). (NS, no significance).
Download figure:
Standard image High-resolution imageIsolated primary mouse hepatocytes were also applied for cytocompatibility testing of the bio-inks. Figure 8 shows the cell viability and functionality test results. As shown in figures 8(A) and (B), the conventional dECM bio-ink, gelatin mixture, and dECM pBio-ink groups showed similar viability for 2 weeks. Figure 8(C) shows the immunostaining results of hepatocyte-laden bio-inks. As shown in the figure, lower expressions of albumin and CYP450 reductase were observed in the gelatin mixture group. Figures 8(D) and (E) show the amount of albumin and urea secreted from the hepatocytes for 2 weeks, respectively. Albumin tended to increase in all groups until day 4 and then decrease thereafter (figure 8(D)). However, the rate of albumin secretion reduction in the dECM pBio-ink group was significantly lower than that in the gelatin mixture. A significant difference was observed between the two groups from day 7. On day 14, albumin secretion in the dECM pBio-ink group was approximately 6.03 times higher than that in the gelatin mixture group. In addition, the dECM pBio-ink group showed similar functionality with the conventional dECM bio-ink group in albumin secretion for 2 weeks. This tendency was also observed for urea. All three groups exhibited decreased urea secretion over time (figure 8(E)). However, a significant difference was observed between the dECM pBio-ink and gelatin mixture groups from day 4, which persisted until day 10. On Day 14, no differences were observed between the two groups. In addition, the dECM pBio-ink group showed urea secretion similar to that of the conventional dECM bio-ink group for 2 weeks. We also investigated the effect of gelatin, HA, and fibrinogen, which were used to prepare dECM pBio-ink, on the hepatic function. After adding gelatin, HA, and fibrinogen into the conventional dECM bio-ink, the effect of the bio-ink on the hepatic function was investigated for 14 d. The result showed no significant difference in hepatic function between the dECM pBio-ink and conventional dECM bio-ink with the additives (supplementary figure 4). These experiments were designed to investigate differences in hepatocyte compatibility between the three bio-inks. In this regard, primary hepatocytes in the form of single cells were applied for the experiments, since the form can more easily identify differences in cytocompatibility [42, 43]. The long-term hepatic function can be greatly improved by applying the spheroid culture technique or co-culturing with non-parenchymal cells [42, 44, 45].

Figure 8. Viability and functionality test results with primary mouse hepatocytes. (A) Fluorescence images of live/dead stained samples on day 0 and day 14. Isolated primary mouse hepatocytes were encapsulated within gelatin mixture, 2% conventional dECM bio-ink, and 2% dECM pBio-ink and then printed. The samples were cultured for 14 days (scale bar: 100 μm). (B) Calculated cell viability of cultured hepatocytes in dECM bio-inks (n = 3). (C) Albumin secretion and CYP450 reductase (CPR) activity visualized by immunostaining on day 7 (scale bar: 100 μm). Albumin (D) and urea (E) production from the hepatocytes were measured for 14 d (n = 3). (*p < 0.05; NS, no significance).
Download figure:
Standard image High-resolution image
These results confirmed that the hepatic function could be significantly improved by using liver dECM micro-particles. The dECM pBio-ink group showed significantly improved function in albumin and urea secretion compared with the gelatin mixture group. In addition, dECM pBio-ink had similar hepatocyte compatibility with the conventional dECM bio-ink. Therefore, the dECM pBio-ink developed in this study achieved good 3D printability and mechanical properties, and has similar cytocompatibility with conventional dECM bio-ink.
4. Conclusions
Poor mechanical properties and low printability of dECM bio-inks are still major difficulties hindering their application to 3D printing technology. In this study, we developed a new dECM bio-ink, named as dECM powder-based bio-ink (dECM pBio-ink), to overcome the current difficulties. Through various experiments, it was successfully confirmed that the new bio-ink exhibited considerably enhanced mechanical properties and 3D printability than conventional dECM bio-ink. In addition, in vitro tests with endothelial cells and primary hepatocytes showed that dECM pBio-ink had comparable cytocompatibility with conventional dECM bio-ink. The new dECM bio-ink developed in this study could provide an advanced tool for the study of artificial tissue/organ regeneration.
Acknowledgments
This research was supported by the Bio & Medical Technology Development Program, Basic Science Research Program, and Leading Foreign Research Institute Recruitment Program through the National Research Foundation (NRF) funded by the Ministry of Science, ICT & Future Planning (2017M3A9C6033135 and 2017R1A2B4010353) and the Ministry of Education, Science and Technology(MEST) (2018K1A4A3A01063890).