


ABSTRACT
We present the first observational evidence of the near-Sun distortion of the leading edge of a coronal mass ejection (CME) by the ambient solar wind into a concave structure. On 2007 November 14, a CME was observed by coronagraphs onboard the STEREO-B spacecraft, possessing a circular cross section. Subsequently the CME passed through the field of view of the STEREO-B Heliospheric Imagers where the leading edge was observed to distort into an increasingly concave structure. The CME observations are compared to an analytical flux rope model constrained by a magnetohydrodynamic solar wind solution. The resultant bimodal speed profile is used to kinematically distort a circular structure that replicates the initial shape of the CME. The CME morphology is found to change rapidly over a relatively short distance. This indicates an approximate radial distance in the heliosphere where the solar wind forces begin to dominate over the magnetic forces of the CME influencing the shape of the CME.
Export citation and abstract BibTeX RIS
1. INTRODUCTION
The study of coronal mass ejections (CMEs) and their interplanetary counterpart, ICMEs, has generally been limited to remote coronagraph observations (see review, Hudson et al. 2006, and references therein) and in situ spacecraft measurements (see review, Zurbuchen & Richardson 2006, and references therein), respectively. Thus, from the limited information available, predictions of the global shape of ICMEs as they evolve through the inner heliosphere have been heavily influenced by simulations and modeling (e.g., Odstrcil et al. 2005).
Our emphasis here is on observations of CMEs beyond coronagraphs which, in the past, have been remotely sensed using interplanetary scintillation (IPS; e.g., Kojima & Kakinuma 1987; Bisi et al. 2009). However, the IPS method suffers from relatively poor temporal and spatial resolution. Recently, a new generation of heliospheric imagers, spearheaded by the solar mass ejection imager (SMEI) instrument (Eyles et al. 2003) aboard the Coriolis satellite, have been providing observations of this region and are being increasingly used to analyze CME propagation (Webb et al. 2009). While the SMEI provides images beyond 20° elongations away from the Sun (approximately 0.35 AU on the plane of sky (PoS)), images from the Heliospheric Imager (HI) instrument onboard the NASA STEREO (Solar Terrestrial Relations Observatory) mission have been able to bridge this gap by providing continual telemetry of CMEs between the traditional coronagraph field of view (∼4° elongation) and terrestrial distances.
Coronagraph observations of CMEs have been extensively studied since the beginning of space observations (e.g., Gosling et al. 1974). CME shapes vary from event to event within these images and, as stated by Krall & St Cyr (2006), depend on the underlying magnetic field geometry, population of that geometry by solar and heliospheric plasma, Thomson scattering, and the projection of the resulting light onto the two-dimensional PoS. Imaging of CMEs by coronagraphs has been limited to a distance of 32 solar radii (Rs) away from the Sun using the Large Angle and Spectromeric Coronagraph Experiment (LASCO) instrument on the Solar and Heliospheric Observatory spacecraft (Brueckner et al. 1995).
Over the years, CMEs with a ''three-part structure'' (Illing & Hundhausen 1986) have attracted particular attention; characteristically described by a bright (dense) leading edge followed by a dark cavity and a bright core at the rear, often identified as dense prominence material (Schmieder et al. 2002). A magnetic flux rope (FR) structure has been suggested to be embedded within the cavity, the axis of which is thought to be perpendicular to the PoS when the three-part structure is observed (Cremades & Bothmer 2004).
The Lundquist solution of a constant-α, force-free magnetic FR has regularly been used to model a subset of ICMEs, known as magnetic clouds (MCs), from single point in situ spacecraft measurements (Burlaga 1988). In reality, the circular cross section required for a force-free structure is unlikely to occur as the MC evolves through the heliosphere. Although the FR may initially start quasi-circularly, as observed remotely by coronagraphs, spherical expansion (Riley & Crooker 2004) and interaction with a solar wind structured in speed (Manchester et al. 2004; Odstrcil et al. 2004b) may distort the transient.
CMEs typically originate from latitudes close to the streamer belt (Hundhausen 1993), and may frequently experience large velocity gradients in the ambient solar wind over their latitudinal extent. Currently, numerical magnetohydrodynamic (MHD) simulations (Odstrcil et al. 2004a) suggest that when a magnetic FR structure propagates through such a bimodal medium (i.e., one having two distinct velocity regimes), the flow momentum greatly exceeds the magnetic restraining force (Schmidt & Cargill 2001), thereby distorting the cross-sectional structure into a concave object. Until now, the restricted fields of view (FOVs) of coronagraphs have prevented direct observations of this distortion being directly linked to structuring of the solar wind; and only limited studies of kinematically distorted magnetic FRs have been used to find evidence of such an occurrence in situ (Liu et al. 2006; Owens et al. 2006). The magnetic profile of a distorted MC modeled by Owens (2006) was analyzed against three well-studied MCs, where a concave structure would have been expected. However, the observations were found to best describe the traditional outlook of a convex structure. Here, the term concave refers to a deformation created by a slower propagation of the CME central region, thereby causing it to be 'overtaken' by the edges and creating a 'C' shaped object. This is different to possible deformation caused by a faster propagation in the central region creating a reverse 'C'. It was suggested that a sharp transition from fast to slow solar wind would shear a CME rather than distort it, thereby causing a globally concave FR but with a convex signature on a local scale.
The purpose of this study is to demonstrate observationally for the first time a CME structure evolving beyond the FOV of coronagraphs, where the changing CME morphology can be directly attributed to a structured solar wind.
2. OBSERVATIONS
The STEREO mission consists of two almost identical spacecraft placed into Earth-like orbits, one ahead of Earth (S-A) and the other behind (S-B) (Kaiser et al. 2008). Onboard each spacecraft are two wide-field HI cameras (Eyles et al. 2009), HI-1 and HI-2, with boresights set at 14° and 53° elongation, respectively, to provide an uninterrupted FOV from the coronagraphs to distances of 1 AU and beyond. Both spacecraft separate from Earth at a rate of 22 5 per year.
We carried out an initial survey of CMEs identified in STEREO HI data from 2007 to 2008. During this period, two examples of concave CMEs were found. The first was observed by HI-1 on S-A on 2007 July 9 and the second by HI-1 on S-B on 2007 November 15. A closer inspection of the 2007 July CME reveals that at least two structures are propagating simultaneously along different longitudes, and thus for our study, this event is not conducive to further analysis.
Signatures of the 2007 November CME identified in HI images were produced using a running difference technique. The HI detectors observe not only scattered light from coronal electrons but also sunlight scattered from dust (the F-corona). The F-coronal signal can be effectively removed by a subtraction of a long-term background or a running difference technique (e.g., Davies et al. 2009). The latter is better at revealing faint features propagating through the FOV.
3. CASE STUDY: 2007 NOVEMBER 15
This CME was first observed in images from the S-B inner coronagraph (COR 1) at 13:05 UT on 2007 November 14 (http://cor1.gsfc.nasa.gov/catalog/). It subsequently passed through the COR-2 FOV, entering the FOV of the HI-1 camera on S-B at 04:00 UT the next day. HI-2 also observed the propagation of this CME's rear edge. The center of the CME propagated antisunward at a position angle (P.A.) of ∼247° and spanned an apparent angular width of 50°.
CMEs generally accelerate during their initial phase but approach constant velocity by heights of around 30 Rs (St Cyr et al. 2000; Schwenn et al. 2006), i.e., within the HI FOV. The apparent acceleration/deceleration observed by the HI cameras can be used to deduce their radial speed and longitude of propagation, assuming that these parameters remain constant over the HI FOV (Rouillard et al. 2008; Sheeley et al. 2008; Savani et al. 2009). For this technique to be effective, a transient must be observed over a wide range of elongations (i.e., by both HI-1 and HI-2 cameras).
The technique mentioned above was applied to our case study by fitting Equation (1) to a time-elongation plot constructed for both the leading and rear edges of the CME at a P.A. of 250°; note that this equation does not include an adjustment to take account of the off-solar equatorial direction of propagation:
Here, the elongation variation, α(t), of a solar wind transient depends on its radial speed, Vr, and the solar longitude difference between the spacecraft and the outflowing transient, β, when a fitting is applied along the equatorial plane. To obtain the heliocentric longitude of travel for CMEs traveling off the solar equatorial plane, ψ, we must make an adjustment to β shown in Equation (2); where θ is the inclination relative to the equatorial plane (Rouillard et al. 2009). We estimate the CME propagated at 50° ± 10° away from the S-B–Sun line.
The radial speed was determined as 318 ± 19 km s−1 and 245 ± 35 km s−1 for the leading and rear edges of the CME, respectively. By assuming constant acceleration to 1 AU (Owens & Cargill 2004) and using the average of these derived speeds (280 ± 30 km s−1), the CME would be expected to be passing south of S-A by ∼7° around 08:00 UT, 2007 November 20. Figure 1 shows a schematic, in the Heliographic Inertial (HGI) coordinate system, of the positions of the two spacecraft, showing the direction of propagation of the CME. The HGI coordinates are Sun-centered and inertially fixed with respect to an X-axis directed along the intersection line of the ecliptic and solar equatorial planes; the Z-axis is directed perpendicular to and northward of the solar equator, and the Y-axis completes the right-handed set. At this time, the magnetic field in situ data from ACE and S-A show the presence of a clear FR structure, but we attribute this to a partial halo CME seen in LASCO one day after our event. Given the direction of propagation, it is unlikely that ACE would have detected our November 15 CME in situ as a clear FR structure.

Figure 1. View from above the locations of the STEREO spacecraft in relation to the Earth and Sun in HGI coordinates. The full HI FOV on S-B is demarcated by blue lines, with the HI-1 FOV shown as a shaded region. The predicted direction of propagation of the 2007 November 15 CME is also displayed. The orbits of Mercury and Venus have been included for completeness.
Download figure:
Standard image High-resolution imageTo model the idea of a CME being distorted by a bimodal solar wind profile, a MAS (MHD around a sphere) three-dimensional MHD code developed by the SAIC group (Linker et al. 1999; Mikic et al. 1999; http://www.imhd.net) was used to provide a realistic simulation of the solar wind structure through which this CME propagated. A steady state result is produced by solving the time-dependant MHD equations in spherical geometry between 1 and 30 Rs. The initial conditions are derived from photospheric magnetic field observations produced from the National Solar Observatory at Kitt Peak (http://synoptic.nso.edu).
A synoptic map of the solar wind velocity at 30 Rs was created for 2007 November (Carrington Rotation 2063); see Figure 2(a). The slow solar wind (black) occurs predominantly around the equatorial regions of the Sun. Assuming the CME propagated at 50° longitude away from S-B, the vertical purple line indicates the location from which our November CME emanated. Figure 2(b) shows the velocity profile with latitude along this meridian, indicating that the slow solar wind is predominately centered at ∼15° south of the solar equator. As the CME propagated below the solar equator, the narrower region of slow solar wind above the equator (∼25°) can be ignored for the purposes of modeling the CME distortions. The solar wind profile from the simulation was fitted to a half-period sinusoid (purple curve) so that an approximation of the speed gradient with latitude can be used to kinematically distort a circular CME structure. The optimal sinusoidal curve was calculated using an unconstrained nonlinear optimization routine (Nelder & Mead 1965) with two free parameters.
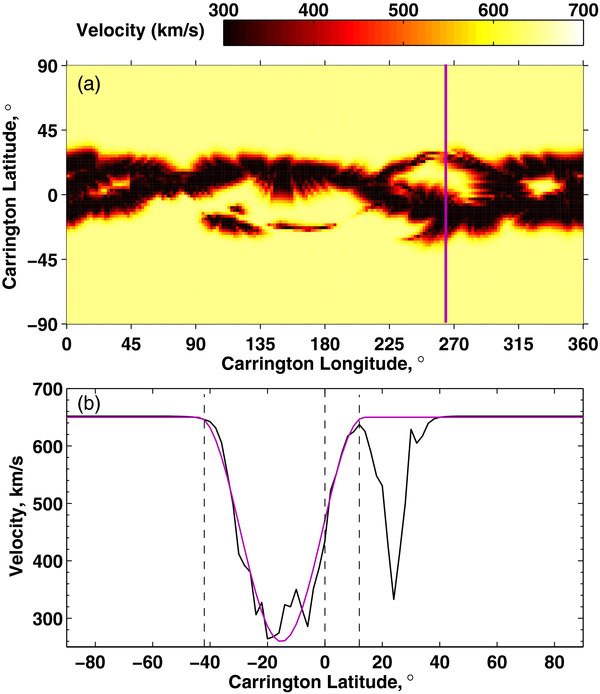
Figure 2. (a) MAS three-dimensional MHD simulation of the solar wind velocity at 30 Rs for CR2063. The vertical purple line is the predicted longitude of the November CME. (b) Velocity profile with latitude from the model at the longitude of the CME. The purple curve is the velocity profile approximated to the optimal half-period sinusoidal curve (bounded by the dashed lines).
Download figure:
Standard image High-resolution imageImages from both the outer COR-2 coronagraph and HI cameras on S-A were viewed and CME shape was examined by eye. The COR-2 camera has an FOV of 20 Rs (assuming PoS) that is adjacent to, but does not overlap with the FOV of the HI-1 camera. Figure 3(a) shows that throughout the propagation of the CME through the COR-2 FOV, it remains quasi-circular in shape, with clear identifiable edges; a dark inner cavity structure is surrounded on all sides by a bright region of higher density electrons. The outer LASCO C3 instrument has a slightly larger FOV and therefore able to overlap slightly with the HI camera. C3 also saw the onset of the CME distortion. The continuation of the distortion appears to be undertaken in the HI-1 camera. It is worth noting here that LASCO is situated at a different longitude to the STEREO spacecraft and due to electron scattering off a three-dimensional object, it is therefore likely to observe a slightly different section of the CME.
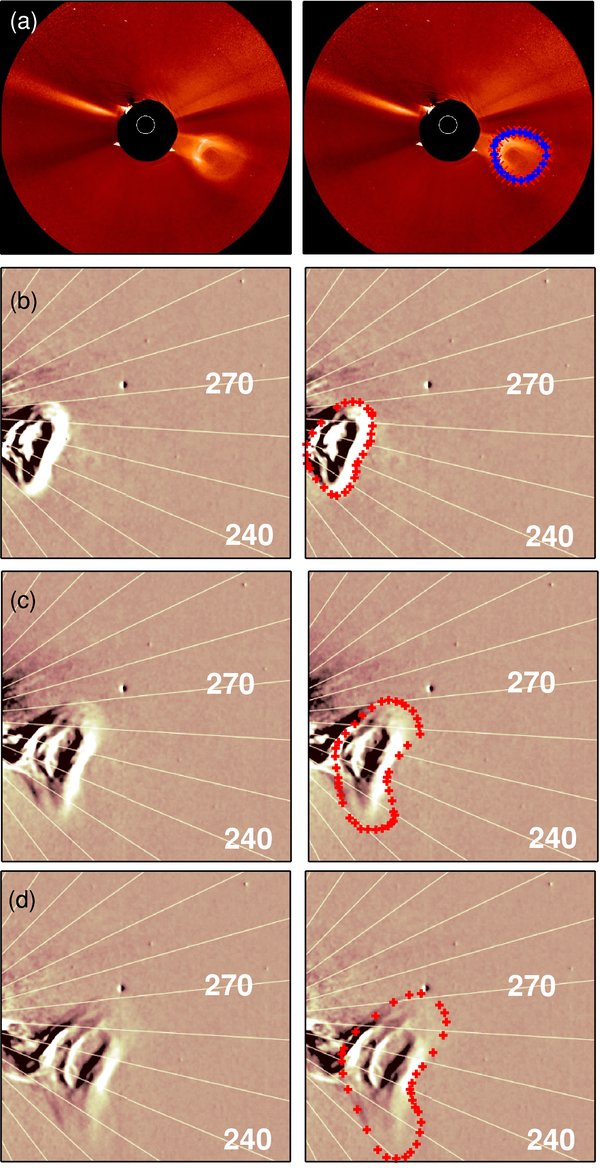
Figure 3. (a)–(d) STEREO spacecraft images for the 2007 November CME without (left column) and with an overplot of the manual tracing (right column). (a) COR-2 image on 01:08:32 UT, 2007 November 15. HI-1 difference images on the 2007 November 15 are shown in (b) at 10.49 UT; (c) at 14.09 UT; (d) at 17.29 UT. Lines of constant P.A. are displayed in 10° intervals.
Download figure:
Standard image High-resolution imageTurning to the HI-1 images, the morphology of the CME shows a distorted circular shape as soon as the entire structure is within the FOV (see Figure 3(b)). The leading edge of the CME is initially a flat surface but then gradually evolves into a concave structure. Figures 3(b)–(d) show three example frames of the CME in a difference image format; the elongation at the center of the CME is approximately 61, 80, and 98, respectively. At the longitude of the CME, the solar wind simulation predicts the slow wind to be centered at 14° below the solar equator. This is also the solar latitude of the observed CME center, so is consistent with the idea of the CME being distorted symmetrically by fast wind propagating above and below the CME center. If both the northern and southern flanks of the CME were driven from behind by a significantly faster solar wind than the mid-section, then these edges would appear to 'overtake' the center, creating a concave object later in time.
The HI-1 camera provides 11 frames where the entire structure is visible in the FOV. For each of these frames, the CME outer edge was digitized by manually tracing the shape by eye, with the results displayed in the right column of Figure 3 (the images themselves are a replica of the left panels). Three examples are shown: frames 1, 6, and 11.
A study of the CME shape as it propagated through the HI-1 FOV was carried out by comparing its outer edge with the in situ magnetic FR model developed by Owens et al. (2006). This is a kinematically distorted magnetic FR model designed for the purposes of better describing the magnetic profile of ICMEs in situ. The model starts with an idealized magnetic FR with a cylindrical shape close to the Sun (∼2 Rs) and then kinematically evolves the FR by assuming all plasma parcels move radially away from the Sun. This model does not include any of the internal forces acting within the CME, such as the restraining force provided by the magnetic tension. It instead assumes the flow momentum greatly exceeds these forces and therefore they can be approximated to be negligible.
A later refinement of this model attempted to evolve the CME structure using a structured bimodal solar wind. Owens (2006) analyzed in situ measurements from three ICMEs that were predicted to be part of a concave transient. The conclusion drawn was that the magnetic field profiles were better fitted to a convex FR model. A possible explanation given was that this may be due to a discontinuous solar wind speed transition shearing the CME so that, on a global scale, the object is indeed concave, but for a given single point measurement it would appear to be convex. The images in Figure 3 do not support this claim, as the distortion appears continuous and not sheared. Note, however, the Owens work was based on observations at much larger heliocentric distances than the work we are presenting. Also, this model does not distinguish between a driver of fast wind from behind or a band of slower plasma in front. Rather it merely models the resultant effects of a latitudinal velocity gradient.
The purpose of this study is to show remote observations of CME distortions that can be directly attributed to a structured solar wind; thus, our interest lies only in the morphology of the CME created from this in situ model and not the exact nature of the magnetic field. For these reasons, we compare the Owens model to the manually selected positions of the CME edges from the images (see Figure 4).
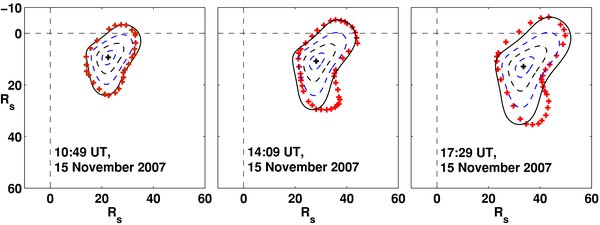
Figure 4. Comparison between the model and observations. Crosses indicate manual tracing of CME outer edge as deduced from Figures 3(b)–(d). Lines indicate the structure of a distorted CME model, with the solid line displaying the outer edge.
Download figure:
Standard image High-resolution image
The half-period sinusoidal solar wind profile from Figure 2 was used as inputs to the Owens model, but in order to simulate the magnetic tension within the CME the application of a reduction factor to the solar wind profile was found to be necessary. The fast wind speed was maintained but the slow wind speeds were increased so that the velocity shear would decrease. The maxima and minima of the sinusoid speed curve were originally at 650 and 282 km s−1, respectively, but the latter was increased to 539 km s−1; therefore only using 30% of the amplitude.
Qualitatively, Figure 4 shows a very good match between observations and our simple model. Although the images suggest the southern half of the CME travels faster than the northern, this has not been modeled by our symmetric solar wind profile. This confirms that the CME distortion is indeed consistent with its interaction with a structured solar wind. The change in the global CME morphology, from a circular to concave structure, occurs over a relatively short range of coronal heights (20–50 Rs), after which the shape remains, on the whole, unperturbed. The fact that the distortion occurs over a narrow range of coronal heights suggests a change in the balance of forces dictating the CME shape.
More can be done to quantitatively study this phenomenon. For example, further studies may optimize the solar wind reduction factor between the model and observations, thereby providing insight into the solar wind's influence on the CME as a function of radial distance. Second, an improved understanding of HI observations is needed to explain why a CME model assumed to be in the PoS matches with observations predicting a propagation of 40° away from PoS. A quantitative analysis of the Thomson sphere effects would aid this process.
4. DISCUSSION AND CONCLUSION
The HIs on the STEREO spacecraft allow detailed studies of CME evolution as they propagate through the inner heliosphere. We are able to observe, for the first time, the distortion of a CME into a concave structure via its interaction with a bimodal solar wind. This study also provides the first steps toward an understanding of CME morphology within a region where CME acceleration is traditionally considered to cease. The good agreement between the Owens et al. model and observations presented here provides us with better appreciation of the topological evolution of ICMEs at their early stages of formation. Indeed, with further study it is hoped that we can make improvements to our predictions of arrival times at Earth.
The HI instruments open up avenues of research into CME properties that have previously been difficult to observe. Further statistical analysis is required to determine properties like the expansion rate of CMEs and the extent of deformity, characterizing the restraining force within a CME. Further studies should aim to better understand the balance between flow momentum and the restraining tension force, as this may lead to the first opportunity to study the transition region between CME and ICME properties; and the relationship between the magnetic FR structure and a CME.
STEREO/HI was developed by a consortium comprising RAL, the University of Birmingham (UK), CSL (Belgium), and NRL (USA). SECCHI, led by NRL, involves additional collaborators from LMSAL, GSFC (USA), MPI (Germany), IOTA, and IAS (France). This work was supported by UK STFC through the award of a studentship (NS) Imperial College London, the C R Barber Trust from the Institute of Physics, and the Royal Astronomical Society.