


ABSTRACT
Since 2005, the blazar 3C 454.3 has shown remarkable flaring activity at all frequencies, and during the last four years it has exhibited more than one γ-ray flare per year, becoming the most active γ-ray blazar in the sky. We present for the first time the multi-wavelength AGILE, Swift, INTEGRAL, and GASP-WEBT data collected in order to explain the extraordinary γ-ray flare of 3C 454.3 which occurred in 2010 November. On 2010 November 20 (MJD 55520), 3C 454.3 reached a peak flux (E >100 MeV) of Fpγ = (6.8 ± 1.0) × 10−5 photons cm−2 s−1 on a timescale of about 12 hr, more than a factor of six higher than the flux of the brightest steady γ-ray source, the Vela pulsar, and more than a factor of three brighter than its previous super-flare on 2009 December 2–3. The multi-wavelength data make possible a thorough study of the present event: the comparison with the previous outbursts indicates a close similarity to the one that occurred in 2009. By comparing the broadband emission before, during, and after the γ-ray flare, we find that the radio, optical, and X-ray emission varies within a factor of 2–3, whereas the γ-ray flux by a factor of 10. This remarkable behavior is modeled by an external Compton component driven by a substantial local enhancement of soft seed photons.
Export citation and abstract BibTeX RIS
1. INTRODUCTION
The flat spectrum radio quasar 3C 454.3 (PKS 2251 + 158; z = 0.859) is the brightest γ-ray (0.1–10 GeV) blazar detected after the launch of the AGILE (Tavani et al. 2009) and Fermi (Atwood et al. 2009) satellites. During 2007–2010, AGILE detected and investigated several gamma-ray flares (Vercellone et al. 2010a; Pacciani et al. 2010; Striani et al. 2010d). These observations allowed us to establish a possible correlation between the γ-ray (0.1–10 GeV) and the optical (R band) flux variations with no time delay, or with a lag of the former with respect to the latter of about half a day. Moreover, the detailed physical modeling of the spectral energy distributions (SEDs), when 3C 454.3 was at different flux levels, provided an interpretation of the emission mechanism responsible for the radiation emitted in the γ-ray energy band, assumed to be inverse Compton scattering of photons from the broad-line region (BLR) clouds off the relativistic electrons in the jet, with bulk Lorentz factor Γ ∼ 20. Similar results were obtained by other groups, by analyzing Fermi and multi-wavelength data (e.g., Ghisellini et al. 2007; Bonning et al. 2009; Abdo et al. 2009; Foschini et al. 2010; Bonnoli et al. 2011). During the period 2009 December 2–3, 3C 454.3 exhibited an intense γ-ray flare reaching a peak value of Fp, 2009γ = (2.0 ± 0.4) × 10−5 photons cm−2 s−1 in the range 0.1–10 GeV. This extreme behavior in the γ-ray might require a more sophisticated modeling with respect to the widely accepted one-zone, synchrotron self-Compton (SSC) and external Compton (EC) models (see Celotti & Ghisellini 2008 for a review of the blazar emission mechanisms and energetics). In particular, the almost simultaneous multi-wavelength data collected during the γ-ray flare required an additional population of accelerated electrons co-existing with the soft seed photons of the SSC/EC model (Pacciani et al. 2010). Alternative to the SSC/EC models, the blazar SEDs can be explained in the framework of the hadronic models (Mannheim & Schlickeiser 1994; Mücke & Protheroe 2001; Becker 2008).
Recently, Foschini et al. (2011) and Abdo et al. (2011), analyzing Fermi data acquired during the 2010 November flare, show that the extremely fast variability, on a timescale of about 3–6 hr, favors a γ-ray emission originating from a compact region, below the parsec scale.
In this Letter, we report on the multi-wavelength AGILE, Swift, INTEGRAL, and GASP-WEBT campaign covering the extraordinary 2010 November γ-ray flare of 3C 454.3. The quoted uncertainties are given at the 1σ level, unless otherwise stated, and a Λ-CDM cosmology (h = 0.71, Ωm = 0.27, and ΩΛ = 0.73) was adopted.
2. DATA ANALYSIS
AGILE detected increased and prolonged γ-ray emission from 3C 454.3 starting from 2010 October 28 (MJD 55497), with a maximum emission on 2010 November 20 (MJD 55520; Vercellone et al. 2010b; Striani et al. 2010a, 2010b, 2010c). Level-1 AGILE–GRID data were analyzed using the AGILE Standard Analysis Pipeline (see Vercellone et al. 2010a for a description of the AGILE data reduction). We used γ-ray events filtered with the FM3.119 AGILE Filter pipeline. Counts, exposure, and Galactic background γ-ray maps were created with a bin size of 0 5 × 05 , E ⩾ 100 MeV, and including all events collected up to 60° off-axis. To reduce the γ-ray Earth albedo contamination, we rejected all γ-ray events whose reconstructed directions form angles with the satellite–Earth vector <85°. We used the latest version (BUILD-20) of the Calibration files (I0010), which will be publicly available at the ASI Science Data Centre (ASDC) site,42 and of the γ-ray diffuse emission model (Giuliani et al. 2004). We ran the AGILE Multi-Source Maximum Likelihood Analysis (ALIKE) task with an analysis radius of 10°.
The Swift X-ray Telescope (XRT) data were processed with standard procedures (xrtpipeline v0.12.6 within HEASOFT V.6.10), filtering and screening criteria. The XRT data were in windowed timing mode (WT). Spectra were extracted on an orbit-by-orbit basis due to a rotation of the roll angle, within circular regions with a radius of 47.15 arcsec. We used the latest spectral redistribution matrices (20101206). The Swift Ultraviolet and Optical Telescope (UVOT) data analysis was performed using the uvotimsum and uvotsource tasks. Source counts were extracted from a circular region with a 5 arcsec radius. The background was extracted from a nearby source-free circular regions. The reported fluxes are on the UVOT photometric system described in Poole et al. (2008), and are not corrected for Galactic extinction.
The INTEGRAL data were obtained as a target of opportunity (ToO) observation triggered immediately after the γ-ray flare (for preliminary results, see Pian et al. 2010), and were processed using the ISDC Off-line Scientific Analysis software (OSA V.9.0; Courvoisier et al. 2003). INTEGRAL observed the source between 2010 November 21.70 UT and November 27.24 UT, for a total on-source time of 400 ks. Light curves and spectra were extracted for each individual science window (SCW) and later combined. We investigated the 4–26 keV (JEM-X both units) and 20–200 keV (IBIS/ISGRI) energy ranges. We extracted the light curve from IBIS/ISGRI in the 20–40 keV and 40–100 keV energy bands to verify possible variability on timescales from hours to 1 day: the average count rate in the softer (harder) band is 1.6 ± 0.1 counts s−1 (1.4 ± 0.1 counts s−1), or about 11 (15) mCrab without significant variability.
We then analyzed the averaged spectrum using 8 pre-defined energy channels in JEM-X and 16 customized energy channels for IBIS/ISGRI with Xspec (v. 12.6.0). We assumed a single power-law model and free cross-calibration constants for JEM-X (C1 and C2) with respect to ISGRI, and a 3% systematic error to account for the instrumental calibration uncertainties. We obtain (uncertainties at 90% c.l.): Γ = 1.59 ± 0.08 (χ2red/dof = 1.35/23), C1 = 1.1 ± 0.2 , C2 = 1.3 ± 0.2 , F4-200 keV = (4.7+0.2 − 0.4) × 10−10 erg cm−2 s−1.
The GLAST-AGILE Support Program (GASP; Villata et al. 2008, 2009) is a project born from the Whole Earth Blazar Telescope43 (WEBT) in 2007, which has analyzed the multi-frequency behavior of 3C 454.3 since the unprecedented optical outburst of 2005 (Villata et al. 2006, 2007, 2009; Raiteri et al. 2007, 2008a, 2008b, 2011). The R-band GASP observations of 3C 454.3 in the period considered in this Letter were performed by the following observatories: Abastumani, Calar Alto, Crimean, Galaxy View, Goddard (GRT), Lowell (Perkins), Maria Mitchell, New Mexico Skies, ROVOR, Roque de los Muchachos (KVA and Liverpool), Sabadell, and St. Petersburg. Additional data were taken by the AAVSO44 (Krajci et al. 2010) and the Yale Fermi/SMARTS project45 (Chatterjee et al. 2011). Some of the above observatories also provided data in the B, V, and I bands. Near-IR (NIR) data in the J, H, and K bands are from Campo Imperatore. Radio flux densities were measured at Submillimeter Array (SMA, 345 and 230 GHz; see Gurwell et al. 2007), Medicina (8 GHz), and UMRAO (14.5, 8.0, and 4.8 GHz). Data reduction and analysis follow Raiteri et al. (2008a).
3. RESULTS
Figure 1 shows the multi-wavelength light curves from radio to γ-ray; from top to bottom: AGILE/GRID (E > 100 MeV) at a variable time bin of ≈2, 1, and 0.5 days; INTEGRAL (20–100 keV); Swift/XRT (2–10 keV); Swift/UVOT UV w1 (red circles), m2 (green squares), and w2 (blue triangles); Swift/UVOT (triangles), and GASP-WEBT (squares) optical U (blue points), B (green points), and V (red points); GASP-WEBT optical R (blue triangles, with additional data from AAVSO as green squares) and I (red circles); GASP-WEBT near-infrared J (red points), H (green points), and K (blues points); and GASP-WEBT 4.8 GHz (red circles), 8 GHz (green circles), 14.5 GHz (blue circles), 230 GHz (black circles), and 345 GHz (yellow circles). When data are available, a clear peak is present at approximately MJD 55520 in all light curves. In particular, the γ-ray light curve shows different behavior during the pre- and the post-flare periods, the former being much steadier than the latter, on almost the same timescale. The UV and optical light curves show a very similar trend, in particular the remarkably fast flare centered at approximately MJD 55510, with rise and fall of about a factor of 2–2.5 in about 48 hr. During the same period, the X-ray flux varied by about 20%, while no significant variability is detected at other wavelengths. We also note that there is an average offset between the GASP-WEBT and Swift/UVOT data in the V and B bands. If (V, B) and (v, b) are the GASP-WEBT and Swift/UVOT data, respectively, then a good agreement is found when B − b = 0.1 mag and V − v = −0.05 mag. Raiteri et al. (2011) discuss the nature of this offset and provide a tool for the calibration of the Swift/UVOT data. Figure 2 shows a zoom, centered on the γ-ray flare date, of the γ-ray, R-band, and 230 GHz light curves. We note that the sudden enhancement (about a factor of four) of the gamma-ray flux on MJD 55517 does not correspond to a similar flare in the other wavebands.
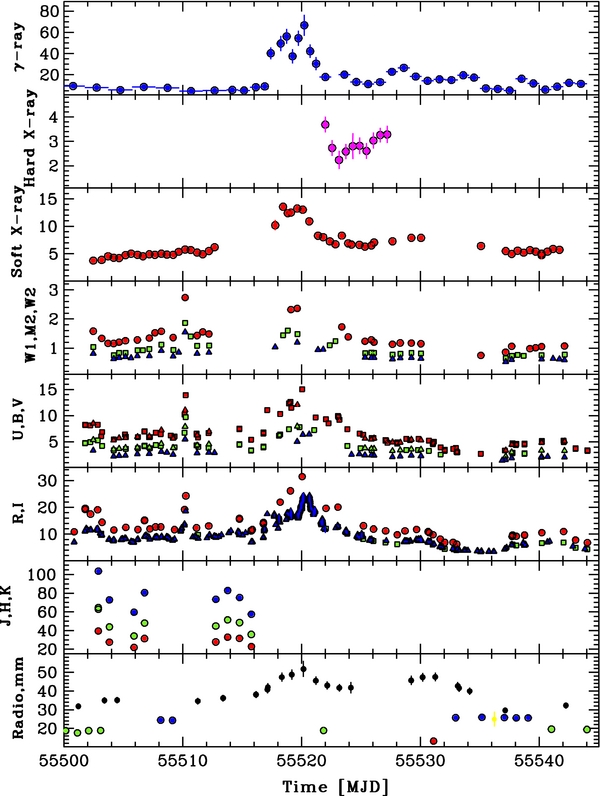
Figure 1. Multi-wavelength light curves from radio to γ-ray. γ-ray (E >100 MeV) data are in units of 10−6 photons cm−2 s−1; hard X-ray (20–100 keV) data are in units of counts s−1; soft X-ray (2–10 keV) data are in units of 10−11 erg cm−2 s−1; UV, optical, and NIR data are in units of mJy; radio data are in units of Jy. See Section 3 for details. The starting date, MJD 55500, corresponds to 2010 October 31 00:00 UT.
Download figure:
Standard image High-resolution image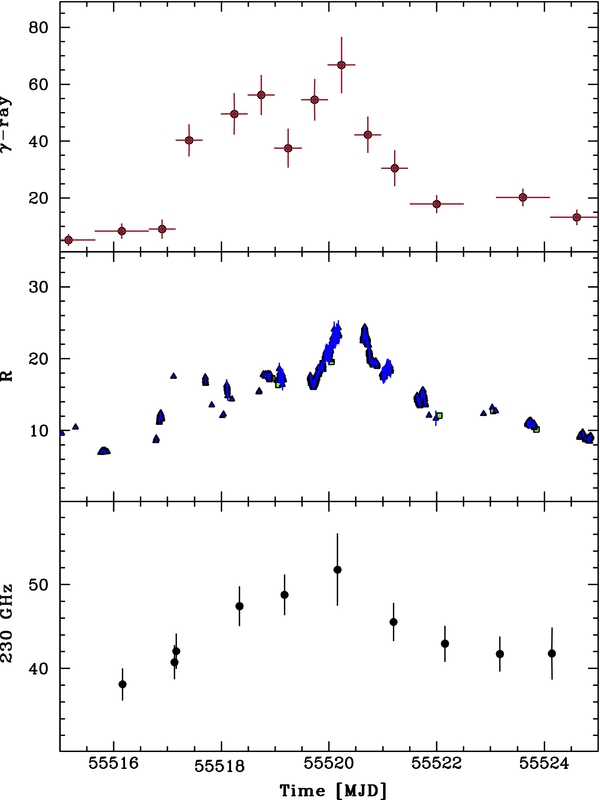
Figure 2. Zoom of the γ-ray (top panel), R-band (middle panel), and 230 GHz (bottom panel) light curves. Units and energy bands are the same as in Figure 1. The starting date, MJD 55515, corresponds to 2010 November 15 00:00 UT.
Download figure:
Standard image High-resolution imageThe Swift/XRT spectra were rebinned to have at least 20 counts per energy bin, and were fit with an absorbed power-law model. Following Vercellone et al. (2010a), the Galactic absorption was fixed to the value of NGalH = 1.34 × 1021 cm−2 (Villata et al. 2006). In Figure 3(a), we show the X-ray photon index as a function of the 2–10 keV X-ray flux. No particular trend is present, contrary to what was previously reported in Vercellone et al. (2010a) for the period 2007–2009.
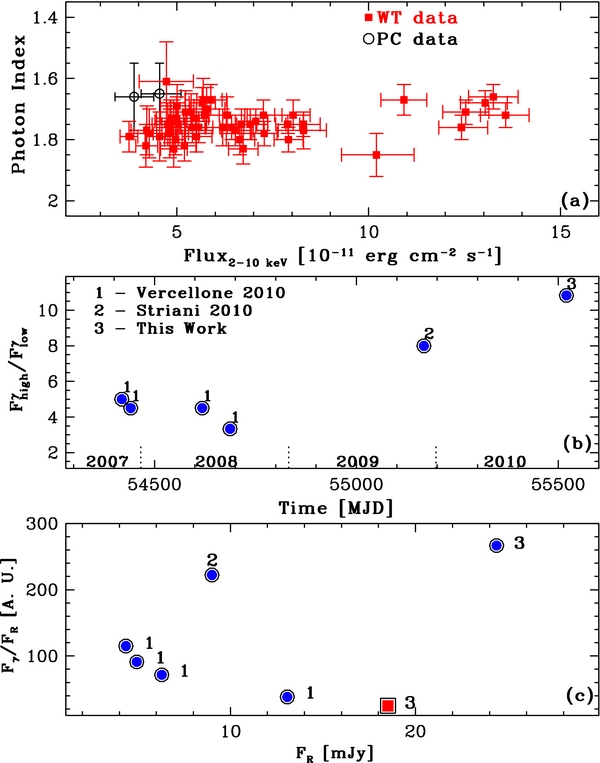
Figure 3. (a) X-ray photon index as a function of the X-ray flux in the energy band 2–10 keV. (b) Peak over low γ-ray flux ratio for the major AGILE detected flares as a function of time. (c) Blue circles represent the ratio between the γ-ray and R-band peak fluxes as a function of the R-band peak flux, while the red square represents the same quantity for the fast optical–UV flare on MJD 55510.
Download figure:
Standard image High-resolution imageThe γ-ray spectra were computed in four different time periods, pre-flare (MJD 55497.60–55516.40), flare (MJD 55518.25–55520.25), post-flare (MJD 55521.25–55543.75), and whole period. Table 1 shows the spectral parameters that we obtained by fitting the AGILE data with a simple power law:
Table 1 reports the numerical values during the different time periods. We note that the flux during the flare is about a factor of 25 larger than the average value reported in the First AGILE Catalogue (Pittori et al. 2009, 2007 July–2008 June).
Table 1. γ-ray Spectral Parameters, and Parameters for the Pre-flare and Flare SED Models (See Section 4 for Details)
| Parameter | Pre-flare | Flare | Post-flare | Whole Period | Units |
|---|---|---|---|---|---|
| γ-ray spectral parameters | |||||
| FE > 100 MeV | 6.2 ± 0.6 | 53.5 ± 3.7 | 13.8 ± 0.6 | 16.8 ± 0.7 | 10−6 photons cm−2 s−1 |
| k | 0.4 | 11.1 | 10.0 | 3.8 | 10−3 photons cm−2 s−1 MeV−1 |
| α | 1.93 ± 0.20 | 2.13 ± 0.13 | 2.37 ± 0.08 | 2.15 ± 0.08 | |
| SED model parameters | |||||
| αl | 2.35 | 2.35 | |||
| αh | 4.2 | 4.8 | |||
| γmin | 50 | 80 | |||
| γb | 650 | 700 | |||
| K | 300 | 700 | cm−3 | ||
| Rblob | 7.0 | 3.6 | 1016 cm | ||
| B | 0.65 | 1.1 | G | ||
| δ | 34.5 | 34.5 | |||
| Ld | 2 | 2 | 1046 erg s−1 | ||
| Td | 104 | 104 | K | ||
| rd | 0.05 | 0.05 | pc | ||
| Θ0 | 1.15 | 1.15 | deg | ||
| Γ | 20 | 20 | |||
Download table as: ASCIITypeset image
4. DISCUSSION
Since its launch in 2007, AGILE detected significant γ-ray emission from 3C 454.3 with repeated and prolonged flaring activity. Figure 3(b) shows the ratio Fγhigh/Fγlow as a function of time, where Fγhigh is the flux maximum value during each flare detected by AGILE, and Fγlow is the lowest flux point just before the corresponding rise in the light curve. While in 2007–2008 this ratio is of the order of 3–5, in 2009 and 2010 this ratio is at least a factor of 2–3 larger. It is worth noting that, during this latest flare, the 230 GHz, optical–UV, X-ray, and γ-ray flux variations are almost simultaneous. The 230 GHz flux shows a more prolonged active state after the γ-ray super-flare (∼10 days), while the UV and optical fluxes reach levels comparable to or lower than the pre-flare ones. The extremely large γ-ray dynamic range in the 2010 flare, the high 230 GHz flux level, and the relatively bright state in the optical band, when compared with other γ-ray flares, could not be explained only in terms of the alignment of different regions of the jet as suggested in Vercellone et al. (2010a). Figure 3(c) provides further evidence of the different behavior of the 2009 and 2010 flares with respect to the previous ones. The plot of the ratio between the γ-ray and R-band peak fluxes as a function of the R-band peak flux (blue circles) shows a difference among flares in the different epochs. The red square represents the point relative to the fast optical–UV flare on MJD 55510. This last point is particularly interesting because of the fast rising and decay timescales (∼1 day). To explain the lack of a simultaneous γ-ray flare, a magnetic field enhancement by a factor of two, a local γ–γ absorption, or a locally seed-photon-starved zone are required.
The INTEGRAL 20–100 keV light curve shows another peculiarity of the 2010 November flare with respect to the intense optical and X-ray flare of 2005 May. During the 2010 November flare, the source shows only moderate flux variability (≈1.6σ level) and a relatively hard spectrum (Γ = 1.59 ± 0.08), while in 2005, during a comparably long observation at a comparable flux level, the source exhibited remarkable flux variability and a softer spectrum (Γ = 1.8 ± 0.1; Pian et al. 2006). Despite the moderate variability in the 20–100 keV band, Figure 1 seems to show a similar trend between the light curves in the soft, hard X-ray, and γ-ray bands.
Figure 4 shows SEDs chosen at three epochs with the largest number of data points. The NIR, optical, UV, and X-ray data are corrected for Galactic extinction. Green open triangles represent the pre-flare SED, accumulated on MJD 55512. In order to obtain enough statistics, the AGILE data were acquired in the period MJD 55497.60–55516.40. Red filled circles represent the flare SED, accumulated on MJD 55519 (AGILE data: MJD 55518.25–55520.25). Blue open squares represent the post-flare SED, accumulated on MJD 55526 (AGILE data: 55521.25–55543.75). The INTEGRAL IBIS/ISGRI integrated spectrum (MJD 55521.70–55527.30) is also reported.

Figure 4. SEDs constructed before (green open triangles), during (red filled circles), and after (blue open squares) the flare. The NIR, optical, UV, and X-ray data are corrected for Galactic extinction. The fit lines and model parameters are described in Section 4 and in Table 1.
Download figure:
Standard image High-resolution image
We fit the pre-flare SED by means of a one-zone leptonic model, considering the contributions from SSC and from external seed photons originating both from the accretion disk (AD) and the BLR (a detailed description of this model is given in Vittorini et al. 2009). Indeed, emission from both the BLR and the AD was detected during faint states of the source (Raiteri et al. 2007). The solid lines represent the total contributions before (green), during (red), and after the flare (blue).
Hadronic models are challenged by the detection of correlated variability at different wavelengths, as pointed out by Finke & Dermer (2010), and as observed by both Fermi and AGILE (but see Barkov et al. 2010).
The emission along the jet is assumed to be produced in a spherical blob with comoving radius Rblob by accelerated electrons characterized by a comoving broken power-law energy density distribution,
where γ is the electron Lorentz factor varying between 80 < γ < 8 × 10³, αl and αh are the pre- and post-break electron distribution spectral indices, respectively, and γb is the break energy Lorentz factor. We assume that the blob contains a homogeneous and random magnetic field B and that it moves with a bulk Lorentz factor Γ at an angle Θ0 with respect to the line of sight. The relativistic Doppler factor is δ = [Γ (1 − β cos Θ0)]−1, where β is the blob bulk speed in units of the speed of light. Our fit parameters are listed in Table 1.
Our modeling of the 3C 454.3 high-energy emission is based on an inverse Compton (IC) model with two main sources of external seed photons: (1) the AD characterized by a blackbody spectrum peaking in the UV with a bolometric luminosity Ld for an IC-scattering blob at a distance rd from the central part of the disk46; and (2) the BLR with a spectrum peaking in V, placed at a distance from the central black hole of rBLR = 3 × 1018 cm, and assumed to reprocess 10% of the irradiating continuum (see Vercellone et al. 2009 for the first application of this model to 3C 454.3, and Pacciani et al. 2010 for the 2009 December flare modeling).
The flaring behavior in the optical and γ-ray energy bands is puzzling. We observe a first rapid flare at MJD 55510 with the optical flux rising and falling by a factor of two in about 24 hr without a γ-ray counterpart. After time T = 7 days, at MJD 55517, the optical flux increases by a factor of two, followed after about 12 hr by a γ-ray increase by a factor of four. On the contrary, on MJD 55520, the flux variations in the optical and γ-ray bands are of the same magnitude, as expected from an EC mechanism. This complex behavior challenges the idea of a uniform external photon field. A possible explanation is that an energetic particle ignition, taking place in an average-density photon region, causes the first optical flare at MJD 55510. Subsequently, the blob moves away by c Tδ/(1 + z) ≈ 3.4 × 1017 cm toward a region with a denser external photon field in which a doubling in the optical flux can be followed by a stronger EC counterpart, as observed during the γ-ray enhanced emission at MJD 55517. Thereon, since the blob is moving in a region with enhanced density of external seed photons, the optical and γ-ray flux variations have similar dynamic range (as observed at MJD 55520), until the blob leaves this denser region. Alternatively, to explain the whole behavior, we can invoke a modest variation of Γ. Subsequently, as observed in the post-flare SED, the γ-ray emission decreases because of (1) the radiative cooling and (2) the decrease of the external photon field due to the blob escaping the enhanced density region. The post-flare SED parameters, therefore, are similar to the flare ones, once evolution by radiative cooling is taken into account. During the flare, the total power carried in the jet, Pjet, defined as (see also Ghisellini & Celotti 2001)

where LB, Lp, Le, and Lrad are the power carried by the magnetic field, the cold protons,47 the relativistic electrons, and the produced radiation, respectively, is of the order of Pjet ≈ 1047 erg s−1.
We can now discuss the absence of a harder-when-brighter trend in the 2–10 keV energy band. During the 18 months AGILE campaign, Vercellone et al. (2010a) found a clear trend, in particular for fluxes above (1–2) × 10−11 erg cm−2 s−1. Donnarumma et al. (2010) show that a behavior similar to the 2010 November one was already present during the 2009 December 2–3 γ-ray flare (see also Pacciani et al. 2010). We can describe the harder-when-brighter trend in terms of a dominant contribution of the EC off the disk seed photons, EC (disk), over the SSC component, probably due to an increase of the accretion rate. We note that an increase of ne and/or γb would cause a softer-when-brighter trend, inconsistent with our findings. The constant X-ray photon index during the extreme γ-ray flares in 2009 and 2010 can be interpreted in terms of a balance of the SSC contribution with respect to the EC (disk). If we assume that γb increases significantly with respect to the 2007–2008 flares (γb = 200–300 in 2007–2008, γb = 700–800 in 2009–2010), we obtain both an increase of the EC (disk) component (and the shift of the peak of its emission to higher frequencies), and a simultaneous increase of the SSC. The net result is a roughly achromatic increase of the X-ray emission.
We thank the referee for useful comments. We thank A. P. Marscher and S. G. Jorstad for Perkins and Liverpool Telescopes optical data. We acknowledge financial contribution from agreement ASI-INAF I/009/10/0, ASI contract I/089/06/2, RFBR Foundation grant 09-02-00092, MICIIN grant AYA2010-14844, CEIC grant P09-FQM-4784, NSF grant AST-0907893, NASA Fermi GI grants NNX08AV65G and NNX10AU15G, NSF/REU grant AST-0851892, the Nantucket Maria Mitchell Association, and grant GNSF/ST08/4-404.
Facilities: AGILE - Italian Space Agency Astro-rivelatore Gamma ad Immagini LEggero satellite, INTEGRAL - International Gamma-Ray Astrophysics Laboratory satellite, Swift - Swift Gamma-Ray Burst Mission, WEBT - Whole Earth Blazar Telescope, AAVSO - American Association of Variable Star Observers International Database, SMA - SubMillimeter Array
Footnotes
- 42
- 43
- 44
- 45
- 46
- 47
If we also consider the contribution of relativistic protons, with 〈γ〉 = 102 , we obtain Pjet ≈ 1049 erg s−1.