


ABSTRACT
Active galactic nuclei and gamma-ray bursts (GRBs) are powerful astrophysical events with relativistic jets. In this Letter, the broadband spectral properties of GRBs and well-observed blazars are compared. The distribution of GRBs is consistent with the well-known blazar sequence including the νLν(5 GHz) − αRX and νLν(5 GHz) − νpeak correlations, where αRX is defined as the broadband spectral slope in radio-to-X-ray bands, and νpeak is defined as the spectral peak frequency. Moreover, GRBs occupy the low radio luminosity end of these sequences. These two correlations suggest that GRBs could have a radiation process, i.e., synchrotron radiation, similar to blazars both in the prompt emission and afterglow phases.
Export citation and abstract BibTeX RIS
1. INTRODUCTION
Gamma-ray bursts (GRBs) and active galactic nuclei (AGNs) are both powered by relativistic jets from accreting black holes (Gehrels et al. 2009; Urry & Padovani 1995). The central engines of GRBs are argued to be stellar-mass black holes (Woosley 1993) and for AGNs the central engines are supermassive black holes. GRBs are the most powerful explosions in the universe (Zhang 2011), with isotropic-equivalent energy Eiso ∼ 1050–1055 erg, and can be detected out to the very high-redshift universe (Lamb & Reichart 2000; Wang et al. 2012). Thus, GRBs can probe the high-redshift universe, including dark energy (Dai et al. 2004; Schaefer 2007; Wang & Dai 2011). Blazars include two subtypes of AGNs, i.e., flat-spectrum radio quasars and BL Lac objects (BL Lacs). A subclass of AGNs, e.g., super-Eddington accreting supermassive black holes, is also proposed to be a standard candle (Wang et al. 2013).
The radiation mechanism of blazars is well constrained. The spectral energy distribution (SED) of blazars is well understood, including the low-energy (infrared–soft X-ray) bump and the high-energy (MeV–GeV) bump. Synchrotron radiation can account for the low-energy peak, while the MeV–GeV peak is produced by inverse Compton radiation. However, for GRBs, the radiation mechanism for prompt emission is still highly debated. The spectrum of prompt emission can be modeled by the "Band function" (Band et al. 1993), whose origin is still unknown (but see Lucas Uhm & Zhang 2014). Some studies (Mészáros et al. 1994; Daigne & Mochkovitch 1998) proposed that synchrotron radiation is the leading mechanism. Other mechanisms have also been proposed (Pe'er et al. 2006; Rees & Mészáros 2005; Beloborodov 2010). The radiation mechanism of afterglows is well understood (Sari et al. 1998). The observed afterglow radiation is well explained by synchrotron radiation (Sari et al. 1998; Panaitescu & Kumar 2001).
Some studies (Zhang 2007; Wang & Dai 2013; Wang et al. 2014) have proposed that the mechanisms in different scale outflow or jet systems may be the same. Some works have been done on the comparison between GRBs and AGNs. Wang & Wei (2011) compared the spectral properties of blazars and optically bright GRB afterglows, and found that GRB afterglows have the same radiation mechanism as BL Lac objects. A similar correlation between the synchrotron luminosity and Doppler factor of GRBs and AGNs has been found (Wu et al. 2011). Nemmen et al. (2012) suggested that the relativistic jets in AGNs and GRBs have similar energy dissipation efficiencies. Ma et al. (2014) extended the analysis of Nemmen et al. (2012) by adding X-ray binaries and low-luminosity AGNS. Wang & Dai (2013) found that GRB X-ray flares and solar X-ray flares have similar distributions, which indicate that the X-ray flares of GRBs are due to a magnetic reconnection process. These similar distributions also exist in X-ray flares from black hole systems with 106–109 M☉ (Wang et al. 2014). Zhang et al. (2013) found that the prompt emission of GRBs may be produced by magnetically dominated jets.
In this Letter, we compare the broadband spectral properties of GRBs and blazars, including the νLν(5 GHz)–αRX and νLν(5 GHz)–νpeak correlations, where αRX is the radio-to-X-ray spectral slope. For a GRB, νpeak is the peak frequency of the νfν spectrum of the prompt emission, while νpeak is the low peak of the νfν spectrum for a blazar. The aim of this Letter is to explore a possible similarity in the radiation mechanism of GRBs and blazars. This Letter is organized as follows. In Section 2, we present the sample of blazars and GRBs. The fitting results are given in Section 3. Section 4 gives our conclusions and discussions.
2. SAMPLES
Chandra & Frail (2012) compiled a sample of GRB radio afterglow observations from 1997 to 2011. This catalog consists of 304 GRBs with radio observations. We select 43 GRBs with redshift measurements. The sample is listed in Table 1. For each GRB, the name of the GRB and the redshift are presented in Columns 1 and 2, respectively. X-ray flux measured in the 0.3–10 keV energy band is given in Column 3, with the time of observation by Swift in Column 6. For bursts observed by BASTE, the energy range is between 2 keV and 10 keV. We use the typical GRB spectrum to convert the flux to 1 keV. The observed radio flux (Column 4) and frequency (Column 5) at the time given in Column 6 are also provided. Column 7 is the jet opening angle. For GRBs without an opening angle determination, we assume a typical value of 5°. The derived collimation-corrected radio luminosity at 5 GHz is given in Column 8. Column 9 gives Epeak, which is the peak energy of the prompt spectrum. The parameters from Columns 2 to 7 are taken from Chandra & Frail (2012). We use the value of Epeak from Wang et al. (2011). In the calculation, we use the peak frequency in the GRB rest frame. The collimation-corrected radio luminosity is calculated as

where dL is the luminosity distance, fν is radio flux at 5 GHz, Fbeam = 1 − cos θj is the beaming factor, and α = 1/3 is the spectral slope (Sari et al. 1998). We adopt α = 1/3 in the slow cooling case. The observed radio flux is converted to flux at 5 GHz using the spectral slope α = 1/3. In this work, we assume the cosmological parameters H0 = 70 km s−1 Mpc−1, Ωm = 0.3, and  .
.
Table 1. GRB Data
| GRB | z | FX | FR | Frequency | Tpeak | θj | LR | Ep |
|---|---|---|---|---|---|---|---|---|
| (10−13 erg cm−2 s−1) | (μJY) | (GHz) | (days) | (erg s−1) | (keV) | |||
| 970508 | 0.835 | 1.2 | 780 ± 13 | 4.86 | 31.4 | 20.93 | 3.83E39 | 389 ± 40 |
| 970828 | 0.958 | 8.0 | 144 ± 31 | 8.46 | 4.0 | 5.15 | 6.70E37 | 298 ± 30 |
| 980329 | 3 | ... | 171 ± 14 | 4.86 | 22.9 | 3.34 | 1.82E38 | 134 ± 20 |
| 980425 | 0.009 | 3.8 | 38362 ± 337 | 4.80 | 18.1 | 5.00 | 1.28E36 | 150 ± 35 |
| 980703 | 0.966 | 4.2 | 1055 ± 30 | 4.86 | 4.6 | 14.82 | 3.42E39 | 254 ± 25 |
| 990510 | 1.619 | 2.5 | 255 ± 34 | 8.46 | 1.6 | 3.36 | 1.27E38 | 126 ± 10 |
| 010222 | 1.477 | 1.2 | 93 ± 25 | 8.46 | 6.8 | 3.02 | 3.21E37 | 309 ± 12 |
| 011121 | 0.362 | ... | 655 ± 40 | 8.70 | 5.9 | 40.00 | 2.11E37 | 779 ± 15 |
| 021004 | 2.33 | ... | 470 ± 26 | 4.86 | 5.9 | 13.29 | 5.44E39 | 80 ± 38 |
| 030226 | 1.986 | ... | 171 ± 23 | 8.46 | 9.7 | 3.43 | 1.24E38 | 97 ± 17 |
| 030329 | 0.169 | 80 | 10337 ± 33 | 4.86 | 2.2 | 5.68 | 1.58E38 | 68 ± 2.2 |
| 031203 | 0.105 | 0.3 | 828 ± 28 | 4.86 | 28.2 | 5.00 | 3.76E36 | 190 ± 30 |
| 050416A | 0.65 | 0.47 | 485 ± 36 | 4.86 | 52.9 | 5.00 | 8.5E37 | 15 ± 2.7 |
| 050603 | 2.821 | 0.075 | 377 ± 53 | 8.46 | 29.4 | 5.00 | 9.89E38 | 344 ± 52 |
| 050820A | 2.615 | 7.7 | 150 ± 31 | 8.46 | 3.7 | 5.07 | 3.62E38 | 246 ± 40 |
| 050904 | 6.29 | 0.09 | 76 ± 14 | 8.46 | 2.6 | 5.00 | 5.69E38 | 435 ± 90 |
| 051022 | 0.809 | 5 | 268 ± 32 | 8.46 | 4.8 | 5.00 | 8.57E37 | 510 ± 20 |
| 060218 | 0.033 | 0.36 | 245 ± 50 | 4.86 | 2.9 | 80.26 | 2.37E37 | 4.9 ± 0.3 |
| 070125 | 1.548 | 1.9 | 1028 ± 16 | 8.46 | 3.7 | 7.90 | 2.63E39 | 366 ± 51 |
| 071003 | 1.604 | 0.9 | 616 ± 57 | 8.46 | 33.0 | 5.00 | 6.7E38 | 799 ± 100 |
| 071010B | 0.947 | 13 | 227 ± 114 | 4.86 | 2.5 | 5.00 | 8.12E37 | 52 ± 6 |
| 080603A | 1.687 | 0.6 | 207 ± 26 | 8.46 | 6.4 | 5.00 | 2.45E38 | 85 ± 30 |
| 090313 | 3.375 | 2.5 | 435 ± 22 | 8.46 | 1.9 | 3.08 | 5.58E38 | ... |
| 090323 | 3.57 | 2.0 | 243 ± 13 | 8.46 | 2.1 | 4.63 | 7.61E38 | 416 ± 76 |
| 090328 | 0.736 | 2.1 | 686 ± 26 | 8.46 | 3.4 | 8.85 | 5.74E38 | 592 ± 237 |
| 090423 | 8.26 | 0.1 | 50 ± 11 | 8.46 | 9.3 | 9.64 | 1.9E39 | 49 ± 3.8 |
| 090424 | 0.544 | 2.3 | 236 ± 37 | 8.46 | 3.6 | 6.33 | 5.62E37 | 162 ± 3.4 |
| 090715B | 3 | 1.2 | 191 ± 36 | 8.46 | 3.4 | 1.39 | 4.23E37 | 134 ± 40 |
| 090902B | 1.883 | 4.4 | 84 ± 16 | 8.46 | 2.3 | 5.00 | 1.19E38 | 775 ± 11 |
| 091020 | 1.71 | 1.1 | 399 ± 21 | 8.46 | 4.9 | 5.00 | 4.82E38 | 187 ± 34 |
| 100414A | 1.368 | 2.0 | 524 ± 19 | 8.46 | 4.0 | 5.00 | 4.35E38 | 572 ± 30 |
| 100418A | 0.62 | 1.8 | 522 ± 83 | 4.86 | 3.4 | 8.43 | 2.37E38 | 25 ± 30 |
| 100814A | 1.44 | 0.45 | 496 ± 24 | 4.50 | 43.4 | 5.00 | 3.65E38 | 128 ± 23 |
| 991216 | 1.02 | 4.6 | 126 | 4.86 | 5.3 | 4.44 | 4.07E37 | 318 ± 30 |
| 000210 | 0.85 | ... | 93 | 8.46 | ... | 5.02 | 3.29E37 | 408 ± 14 |
| 050401 | 2.898 | 0.8 | 122 | 8.46 | 8.6 | 5.00 | 3.33E38 | 118 ± 18 |
| 050525A | 0.606 | 0.29 | 164 | 8.46 | 4.6 | 5.00 | 3.01E37 | 81.2 ± 1.4 |
| 050730 | 3.968 | 1.5 | 212 | 8.46 | 1.5 | 5.00 | 8.92E38 | 104 ± 20 |
| 050824 | 0.83 | 0.8 | 152 | 8.46 | 8.4 | 5.00 | 5.1E37 | 15 ± 2 |
| 060418 | 1.49 | 1.5 | 216 | 8.46 | 1.8 | 5.00 | 2.07E38 | 230 ± 20 |
| 071020 | 2.146 | 1.0 | 141 | 8.46 | 4.0 | 5.00 | 2.45E38 | 322 ± 65 |
| 100901A | 1.408 | 7.0 | 331 | 4.50 | 1.7 | 5.72 | 3.07E38 | ... |
| 100906A | 1.727 | 2.5 | 215 | 8.46 | 1.0 | 2.88 | 8.77E37 | ... |
Download table as: ASCIITypeset image
We use the spectral properties of blazars from Fossati et al. (1998). This sample consists of all the parameters that we require, including redshift, X-ray flux at 1 keV, radio flux at 5 GHz, and synchrotron peak frequency. Fossati et al. (1998) found a power spectral sequence for the blazars despite the difference in continuum shapes among the different blazar sub-classes. This sequence indicates that the radio luminosity is anti-correlated with the synchrotron peak. A plausible interpretation is that relativistic jets radiate via synchrotron and inverse Compton processes if the physical parameters (i.e., magnetic field) vary with luminosity.
3. RESULTS
3.1. νLν (5 GHz)--νpeak Correlation in Blazars and GRBs
The radio luminosities at 5 GHz are anti-correlated with the synchrotron peaks of blazars, as found by Fossati et al. (1998). This correlation has not been studied in GRBs so far. We investigate this correlation in GRBs for the first time. Figure 1 shows the νLν(5 GHz)–νpeak correlation of blazars and GRBs. The black filled and empty circles represent blazars and GRBs, respectively. There is a tight correlation between νLν(5 GHz) and νpeak as expected from the blazar sequence (Fossati et al. 1998). The correlation coefficient is r = 0.83 at a significance level p < 10−4 from the Spearman rank-order statistical test. From this figure, we can see that the GRBs occupy the low-luminosity region of this correlation. For both blazars and GRBs, the best fitting result is


Figure 1. Correlation between radio luminosity at 5 GHz and peak synchrotron frequency for GRBs and blazars. The solid line shows the best linear fit. The 1σ dispersion is marked by the two dashed lines.
Download figure:
Standard image High-resolution imageThe correlation coefficient is improved to r = 0.94 with probability p < 10−4. The correlation coefficient has an obvious enhancement after adding the GRB sample. GRB 060218 may deviate from this correlation. The possible reason is that this GRB, usually called an X-ray flash, has a low peak energy (Soderberg et al. 2006; Pian et al. 2006).
3.2. νLν (5 GHz)--αRX Correlation in Blazars and GRBs
The broadband spectral slope αRX is also correlated with luminosity at 5 GHz in blazars (Fossati et al. 1998). We also investigate this correlation in GRBs. The broadband spectral slope αRX is defined as

where νR = 5 GHz and νX = 1 keV. The X-ray flux  at 1 keV can be obtained as follows. From Column 3 of Table 1, X-ray flux measured in the 0.3–10 keV energy range can be obtained. The X-ray flux usually evolves as ν−p/2 (Sari et al. 1998), with p = 2.2 the power-law index of the accelerated electron distribution. The X-ray flux in 0.3–10 keV is
  . After obtaining the value of a, the flux at 1 keV can be derived.
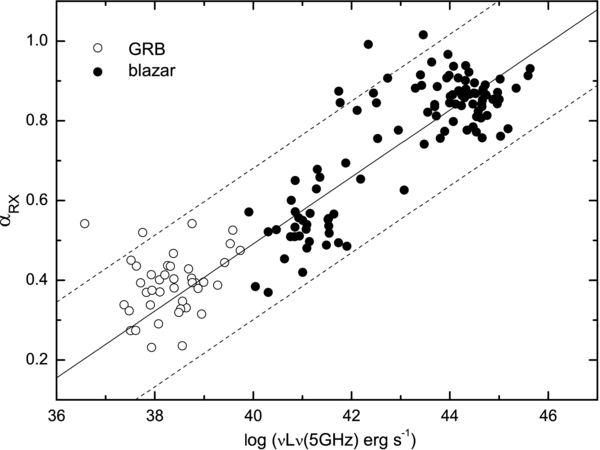
Figure 2 shows a correlation between the spectral slope αRX and radio luminosity at 5 GHz for blazars (black filled circles) and GRBs (empty circles). The correlation coefficient is r = 0.82 with probability p < 10−4 using the Spearman rank-order statistical test for blazars. After combining GRBs and blazars, the fitting result is

The Spearman's rank correlation coefficient is r = 0.85 with probability p < 10−4. GRBs also occupy the low-luminosity end of this correlation.
Figure 2. Correlation between radio luminosity at 5 GHz and spectral slope αRX for GRBs and blazars. The solid line shows the best linear fit. The 1σ dispersion is marked by the two dashed lines.
Download figure:
Standard image High-resolution image
4. CONCLUSIONS AND DISCUSSIONS
The physics of GRBs, i.e., the radiation mechanism of prompt emission, the value of the Lorentz factor, jet composition, and central engine (Zhang 2011), are poorly understood. Wang & Dai (2013) found similar frequency distributions between X-ray flares of GRBs and solar X-ray flares, which may indicate magnetically dominated jets in GRBs. In this Letter, we compile 43 GRBs with good X-ray and radio observations. Two new correlations between GRBs and blazars may provide new clues as to the radiation mechanism of the GRB prompt emission and afterglows. For example, our clear νLν(5 GHz)–αRX and νLν(5 GHz)–νpeak correlations suggest that the radiation mechanism of GRBs in the prompt and afterglow phases and blazars is similar, namely, synchrotron radiation. Moreover, GRBs occupy the low-luminosity region of these correlations.
In this Letter, we use the radio luminosities during the GRB afterglow phase. Although some models predict that bright radio emission may be generated within about 10 s of the initial explosion of a GRB (Usov & Katz 2000; Sagiv & Waxman 2002), detecting prompt radio emission has some impediments, such as scattering (Macquart 2007; Lyubarsky 2008). Bannister et al. (2012) searched for prompt radio emission from nine GRBs at 1.4 GHz, and found single dispersed radio pulses with significance >6σ within several minutes following two GRBs. Unfortunately, the probability of a GRB origin is only 2%. There has been no confirmed evidence for GRB prompt radio emission detection up to now. Thus, we use the radio emission of an afterglow in this Letter. Theoretically, internal shocks produce the GRB prompt emission, and external shocks produce the afterglow emission. The radiation mechanism of an afterglow, i.e., synchrotron emission, is well constrained, but the prompt emission related to νpeak is not well understood. If some similar correlations between νLν(5 GHz) and νpeak exist in GRBs and blazars, the radiation mechanism of prompt emission is argued to be synchrotron emission. Until now, the location of blazar gamma-ray emission regions is still uncertain (Marscher et al. 2010), since some theories locate blazar gamma-ray emission regions close to the black hole/accretion disk (Blandford & Levinson 1995) while others place them at parsec scales in the radio jet (Jorstad et al. 2001). X-ray emission from kiloparsec-scale blazar jets has been observed (Harris & Krawczynski 2006). Meanwhile, the radio emission region of blazars spans kiloparsec scales. Kharb et al. (2010) found that a few blazars exhibit only radio core emission. However, the X-ray emission region and radio emission region do not fully overlap and so the high-energy and radio emissions of blazars also originate from different regions. Thus, a comparison of the correlation νLν(5 GHz)–νpeak between GRBs and the blazar sequence is reasonable. Liang et al. (2004) found that the peak energy νpeak evolves with the isotropic-equivalent luminosity from the time-resolved spectra. They also found that the Liso–νpeak correlation also holds for time-resolved spectra and time-integrated spectra. Ghirlanda et al. (2010) studied the time-resolved spectra of Fermi GRBs. The peak energy νpeak correlates with the luminosity of individual bursts (Ghirlanda et al. 2010). Moreover, the time-resolved Liso–νpeak correlation is very similar for all bursts and has a slope similar to the correlation defined by the time-integrated spectra of different bursts detected by several different satellites. The time-integrated value of νpeak is widely used in luminosity correlations of GRBs, for example, the νpeak–Eiso (Amati et al. 2002), νpeak–Liso (Yonetoku et al. 2004), and νpeak–Eγ, jet (Ghirlanda et al. 2004) correlations. So, if some correlation is due to a similar physical mechanism, this correlation holds regardless of whether the time-resolved or time-integrated values are used.
Fossati et al. (1998) found that νpeak is anti-correlated with the synchrotron peak luminosity for blazars. For GRBs, Liang et al. (2004) found that νpeak is positively correlated with the isotropic-equivalent luminosity. However, the luminosity in the correlation for blazars is the synchrotron peak luminosity, not the total luminosity. Because there are two peaks in the blazar SED and there is no correlation between Eiso and νLν(5 GHz) in GRBs (Chandra & Frail 2012), from our simple analysis above we cannot conclude that GRBs have a different νLν(5 GHz)–νpeak correlation from blazars. In this paper, we find, similarly to Wang & Wei (2011), that GRBs occupy the low radio luminosity end of the blazar sequence.
We thank the referee for detailed and very constructive suggestions that allowed us to improve our manuscript. We acknowledge helpful discussions with Y. C. Zou and X. F. Wu. This work is supported by the National Basic Research Program of China (973 Program, grant No. 2014CB845800) and the National Natural Science Foundation of China (grants 11373022, 11103007, and 11033002).