


ABSTRACT
We present the transient brightening of a coronal loop and an associated fine-scale magnetic discontinuity detected in the photosphere. Utilizing the high-resolution data taken with the Fast Imaging Solar Spectrograph and InfraRed Imaging Magnetograph of the New Solar Telescope at Big Bear Solar Observatory, we detect a narrow lane of intense horizontal magnetic field representing a magnetic discontinuity. It was visible as a dark lane partially encircling a pore in the continuum image, and was located near one of the footpoints of a small coronal loop that experienced transient brightenings. The horizontal field strength gradually increased before the loop brightening, and then rapidly decreased in the impulsive phase of the brightening, suggesting the increase of the magnetic non-potentiality at the loop footpoint and the sudden release of magnetic energy via magnetic reconnection. Our results support the nanoflare theory that coronal heating events are caused by magnetic reconnection events at fine-scale magnetic discontinuities.
Export citation and abstract BibTeX RIS
1. INTRODUCTION
Solar active regions may be experiencing a multitude of heating events in various sizes and various timescales. As a response to the heating events, a fraction of coronal magnetic field lines are filled with hot (1 MK ≤ T ≤ 30 MK) and dense  plasma (Aschwanden 2004; Reale 2014), which become observable as coronal loops in the X-ray and the EUV bands. Hence, the visibility of bright coronal loops is usually regarded as the indication of heating. Revealing the physical nature of coronal heating still remains as one of the major unresolved problems in solar physics.
The most popular theory of coronal heating is the nanoflare theory (Parker 1983, 1988). Parker suggested that initially uniform magnetic fields in a coronal loop can be braided by the random motions at the loop footpoints, and can spontaneously produce small-scale tangential magnetic field discontinuities at the boundaries between braids. These discontinuities can easily lead to small-scale magnetic reconnections, producing thermal energy required for coronal heating. For more than 30 years, this nanoflare model has been pursued by a number of investigators (Parker 1983, 1988; Cargill & Klimchuk 1997; Katsukawa & Tsuneta 2001; Gudiksen & Nordlund 2002; Priest et al. 2002; Gudiksen & Nordlund 2005; Klimchuk 2006; Vekstein 2009; Priest 2011; Cirtain et al. 2013; Klimchuk 2015).
The nanoflare theory can be observationally supported if magnetic discontinuities are detected in coronal loops. Recent high-resolution EUV imaging observations produced evidence of fine-scale braiding in coronal loops (e.g., Cirtain et al. 2013), but the direct measurement of coronal magnetic fields at such fine scales is not possible at all currently, and is not likely to be achieved in the near future. Hence, an alternative approach is to detect magnetic discontinuities in the photosphere where coronal loops are rooted. The possibility of the existence of such structures was suggested by previous studies on the non-potentiality of photospheric magnetic fields. Combining the Yohkoh X-ray data and the Marshall Space Flight Center Vector Magnetograph data, for instance, Falconer et al. (1997) systematically investigated the photospheric magnetic origin of coronal heating, and concluded that most persistent enhanced heating of coronal loops in active regions requires the presence of a polarity inversion line (PIL) in the magnetic field near at least one of the loop footpoints. They suggested that the magnetic reconnection triggered by the high non-potentiality at the loop footpoints is the prime process of the heating. With this process, the loops can be filled with hot plasma evaporated from the footpoints like major flares (Reale et al. 2000a, 2000b). The results of Falconer et al. (1997) are compatible with the existence of magnetic discontinuities and the nanoflare theory, but magnetic discontinuities could not be detected mainly because the spatial resolution of the used data was too poor.
In this Letter, we report our detection of a fine-scale magnetic discontinuity in the photosphere that is causally related to the events of coronal heating in a small coronal loop. The detection was done by combining the 0 25 resolution magnetogram data taken by the InfraRed Imaging Magnetograph (IRIM; Cao et al. 2010) of the 1.6 m New Solar Telescope (NST) of Big Bear Solar Observatory, the 032 resolution spectral data taken by the Fast Imaging Solar Spectrograph (FISS; Chae et al. 2012) of the same telescope, and the 1'' resolution EUV image data taken by the Solar Dynamics Observatory (SDO). As far as we know, this is the first high-resolution detection of magnetic discontinuities that were predicted from the nanoflare theory. We investigate in detail the characteristics and evolution of the magnetic discontinuity in comparison with temporal variations of the loop intensity seen at EUV wavelengths.
2. OBSERVATIONS AND DATA ANALYSIS
On 2012 July 19, we observed a small bipolar active region with the FISS and IRIM. The FISS is a dual-band Echelle spectrograph, which can simultaneously record the Hα and Ca ii 8542 Å lines with high spatial and high spectral resolution. The Hα and Ca ii raster images achieve the resolution of about 032 with the aid of 76 sub-aperture adaptive optics. Both the images of our data came from one scan that consisted of 400 steps. The integration time for each exposure was 30 ms so that it took about 65 s for completion. The basic processing of FISS data was done in the way described by Chae et al. (2012). We measured the photospheric line-of-sight Doppler velocity by applying the lambdameter method to the Ti ii line (λ = 6559.6 Å) seen at the Hα spectrogram.
IRIM is an imaging spectropolarimeter working in the near-infrared. The data obtained for our study are the Stokes I, Q, U, and V images taken at the 13 wavelength positions from −0.7 to 0.7 Å of the Zeeman sensitive Fe i line at 1.565 μm. The spatial resolution of the data is about 025, and the time cadence is about 45 s. The basic reduction of the IRIM data was done following Cao et al. (2010). As implemented by Lites et al. (2008) and Ishikawa & Tsuneta (2011), we infer longitudinal magnetic field from the Stokes V data using the relation  −
−  and transverse field from the Stokes Q and U data using the relation
  , where
  ,
,  , and
, and  are the wavelengths of the line center and the blue and red ends of the spectral coverage. The calibration coefficients were determined from the comparison with the SDO/Helioseismic and Magnetic Imager (HMI; Schou et al. 2012) magnetogram taken at the same time, which are CL = 15600 G and
  . By comparing several sets of the full Stokes profile data with the synthetic models based on the Milne–Eddington atmosphere, we conclude that this calibration yields reasonable values of magnetic fields in relatively weak field regions (
 ), but seriously underestimates in strong field regions (
 ), such as the central regions of pores, since the chosen wavelength range is too small to cover the large Zeeman splitting in these strong field regions. A coarse fitting of the Stokes V in the observed wavelength range by a synthetic model with a large Zeeman slitting indicates that the center of the pore actually has a field strength of about 3000 G.
To investigate the temporal variations of coronal loop brightenings, we used simultaneous EUV image data taken with the Atmospheric Imaging Assembly (AIA; Lemen et al. 2010) on board the SDO. The time cadence is about 12 s, and the spatial resolution is about 1''. The spatial co-alignment between the AIA images and the images of the FISS and IRIM was done using the intensity patterns commonly seen in the photospheric images.
3. RESULTS
Figure 1 shows the images of our interesting region taken by the NST and the SDO. Highly sheared magnetic features, such as the inverse S-shaped absorption loops, are seen in the Hα and Ca ii line center images, indicating the negative sign of magnetic helicity. The Stokes V map at 0.7 Å of the Fe i line center presents the region that contains a positive-polarity magnetic pore (hereafter P1) and two negative-polarity magnetic pores (hereafter N1 and N2).
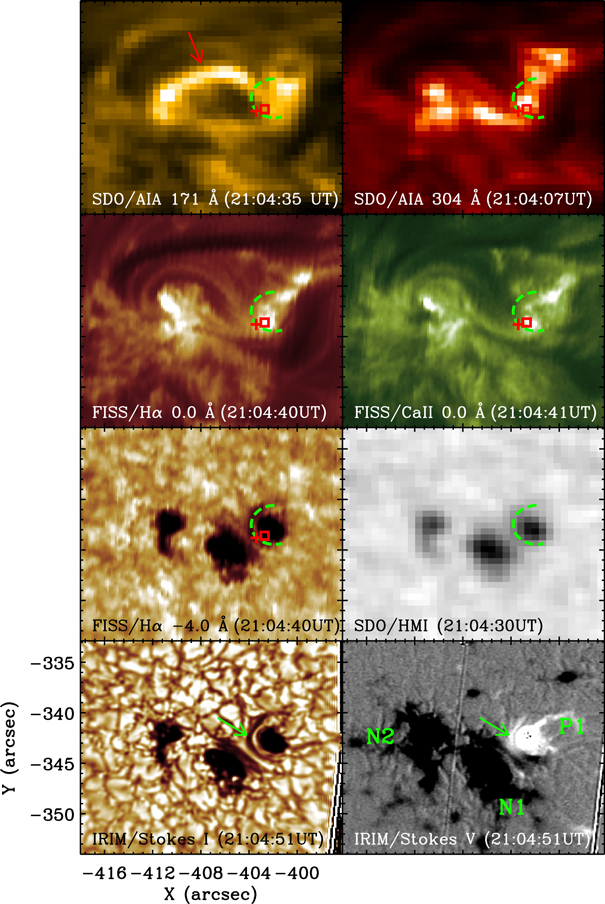
Figure 1. Images of the region taken with the SDO and the NST, from the corona to the photosphere. The red arrow seen in the AIA 171 Å image marks the impulsive loop brightening at 21:04:35 UT. The green arrows and dashed curves mark the dark lane of our interest, and the plus and square symbols mark the points where temporal variations of intensities and the magnetic field strength are examined in detail (see Figure 4).
Download figure:
Standard image High-resolution imageDuring our observations, we found a transient brightening in a small coronal loop as seen in the AIA 171 Å image of Figure 1. It started at 21:02 UT, reached a peak in two minutes, and disappeared after five minutes. At the peak time, it was also visible in other coronal channels of 94, 131, 193, and 211 Å , whose formation temperatures range between 2 and 20 MK, suggesting that the loop was temporarily filled with hot plasma.
From the Stokes I map of IRIM, we found an interesting fine-scale intensity structure around the P1 where one of the footpoints of the coronal loop was rooted: a thin dark lane partially encircling the pore. The lane is visible in the FISS image as well, but is not obvious in the SDO/HMI intensity image, indicating its fine-scale nature. The lane is estimated to be 3700 km long and narrower than 300 km. The bright gap between this dark lane and the P1 is estimated to be smaller than the width of the lane. Note that unlike usual penumbral fibrils, the lane is not in the radial direction from the center of P1, but in the azimuthal direction. Particularly, its southern part is aligned along the PIL between P1 and N1.
Figure 2 shows that this narrow dark lane corresponds to a fine-scale structure of intense magnetic field that is highly inclined to the horizontal direction and highly non-potential. The comparison of the map of the transverse field and that of the longitudinal field in the figure reveals that the magnetic field has a strength of at least 1000 G, and has an inclination that is close to 90° (horizontal) near the PIL and decreases (being more inclined to the vertical) in the clockwise direction. It suggests that this half-ring-shaped structure is coiling around P1 in the left-handed sense, which is in agreement with the negative sign of helicity inferred above.
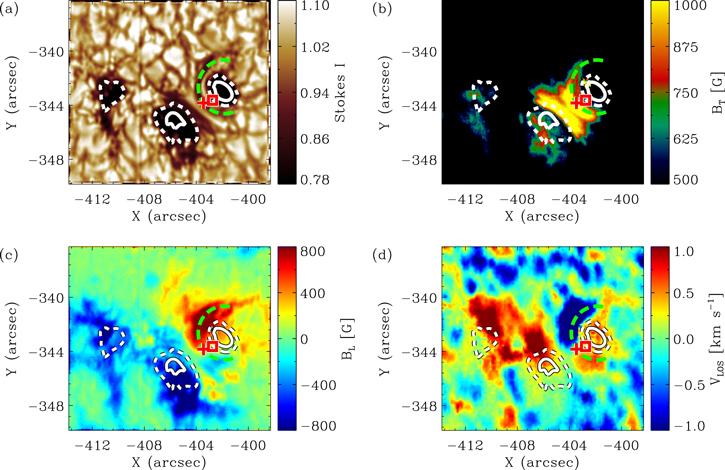
Figure 2. Images of (a) the Stokes I, (b) the transverse magnetic field, (c) the longitudinal magnetic field, and (d) the line-of-sight velocity in the photosphere. Overplotted white contours indicate the intensity values at  (dashed lines) and
  (solid lines), where I0 is the average intensity of the Stokes I image. The plus and square symbols are the same as the ones described in Figure 1.
Download figure:
Standard image High-resolution imageOur observation implies the existence of a tangential discontinuity of magnetic fields around the pore in the photosphere. Since a pore represents a magnetic structure of strong vertical fields, our finding of the narrow structure of intense horizontal magnetic field encircling the pore implies that there is a very thin layer between the pore and this structure where magnetic field changes from the vertical to the horizontal direction. This layer of magnetic transition may correspond to the bright gap between the dark lane and the pore seen in the Stokes I map. Since the gap is very narrow (about 200 km), this transition layer may be practically considered as a tangential discontinuity of magnetic field that was predicted from the nanoflare theory of Parker (1988).
We find from Figure 2 some magnetic and dynamical characteristics of the dark lane. First, there is a change in magnetic polarity along the structure: from 1000 G of the positive polarity in the northern part to −350 G of negative polarity in the southern part. The important point is that the southern part of the structure and the pore have opposite polarities, and they are not magnetically connected. Thus, the magnetically discontinuous and non-potential nature of the layer between these is further pronounced. We think that this layer is the most likely place for nanoflare heating. Second, there is a change in the direction of vertical velocity, too, along the structure: upflows (blueshifts) of up to 2.3 km s−1 in the northern part and downflows (redshifts) of up to 1.4 km s−1 in the southern part. Since downflows exist in the pore itself, the sign of Doppler velocity is the same between the southern part of the dark lane and the pore, which is contrasted with the case of magnetic polarity. Third, the location of zero vertical velocity is co-spatial with that of zero vertical magnetic field, supporting that the velocity structure and magnetic structure are closely related to each other. These patterns of the velocity and magnetic field are distinct from those of an emerging Ω-shaped flux system, where upflows exist in the middle location of zero vertical magnetic field and downflows exist at the two footpoints of opposite polarity. They are more compatible with a U-shaped flux system along which plasma flows in one direction.
We find fast horizontal motions along the dark lane in the photosphere. The existence of the inclined dark streaks in the time–distance map of intensity constructed along the dark lane (Figure 3) indicates the intermittent occurrence of high-speed horizontal motion directed from the southern part to the northern part. The time intervals between the successive events are 10–15 minutes. The speed of such horizontal motion is estimated to be up to 5.0 km s−1, which is a fairly high speed in the photosphere. This is an apparent motion measured from brightness change, so that we cannot determine unambiguously whether it is a real plasma motion or it represents a wave instead or a brightness front, even though these horizontal motion seems to be closely related to the pattern of vertical velocity described above.
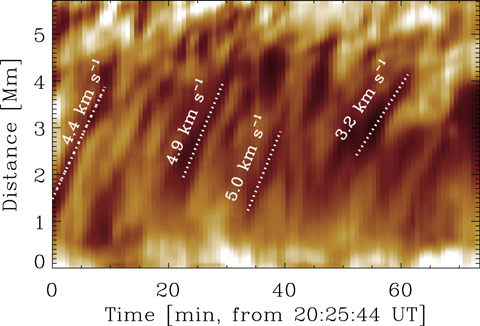
Figure 3. Time–distance map of intensity at 0.7 Å of the Fe i line center constructed along the dashed curve tracing the dark lane from the southern part. The color scale represents intensities from 0.78 to 1.10 times the mean value of a quiet region.
Download figure:
Standard image High-resolution imageOur observations present ample evidence that the transient brightenings of the coronal loop seen in EUV are closely related to the fine-scale discontinuity of photospheric magnetic fields. Most of all, the bright kernels of the 304 Å image and the chromospheric images occur at the very same location where the magnetic discontinuity is likely to be the most pronounced as described above. The bright kernels in fact correspond to a footpoint of the coronal loop. Moreover, we find from Figure 4 that the loop brightened during the footpoint brightening. From the time sequence of EUV 171 images, we find that intense brightenings were localized at four locations along the loop: the loop top, the two footpoints, and the middle of the loop top and the eastern footpoint. The footpoint brightenings occurred rather impulsively, but the loop brightening did relatively gradually. The peak brightening of the loop top lagged behind the peak brightening of the footpoints by two time steps, 24 s. With the distance of about 4000 km, this time lag yields a characteristic speed of 170 km s−1. This behavior of the loop brightening we found is qualitatively similar to that of Reale et al. (2000a), but we could not find any signature of moving brightness fronts such as reported by Reale et al. (2000a). Interestingly, the time plot of 304 Å intensity at the footpoint displays a weak brightening (blue arrow) before the major brightening (red arrows), which may be considered a miniature preflare brightening in flares. This miniature preflare brightening is also discernible in the 171 Å intensity plot and the chromospheric intensity plots. Finally, we find that the brightenings are related to the change of intensity and magnetic field of the photosphere. Note that the variation of intensity is weakly anti-correlated with that of the transverse field. The important thing is that the miniature preflare brightening occurs around the time when the lane is the darkest and the transverse field is the strongest. The transverse field increases and reaches a peak, the brightenings start, and then the field decreases with the variation of transverse field being about 100 G. This behavior of the magnetic field related to the brightenings is similar to the storage-and-release picture of free magnetic energy that often has been considered the scenario of a major flare.

Figure 4. Temporal variations of the intensities at the loop top (top), the loop footpoint (from the second to fifth rows), and the dark lane (sixth row). The blue and red arrows indicate the weak and major brightenings of the loop, respectively. The bottom panel presents the temporal variation of the transverse magnetic field strength inside the dark lane.
Download figure:
Standard image High-resolution image
4. DISCUSSION
We have reported an unprecedented detection of a fine-scale discontinuity of photospheric magnetic fields that is related to coronal heating, using the high spatial resolution data taken by the FISS and IRIM of the NST. The tangential discontinuity of magnetic field was formed in the layer between a pore with strong vertical fields (2000–3000 G) and a very narrow dark structure of intense horizontal fields (1000 G) partially encircling around the pore. Our observation implies that a change of 1000 G or more occurred in the magnetic field at a distance smaller than 200 km. This kind of magnetic discontinuity cannot be detected unless the spatial resolution of observations is high enough to reveal fine details. Note that the dark lane is not well identified in the SDO/HMI intensity image whose spatial resolution is about 1''. Moreover, we presented ample evidence that this magnetic discontinuity was closely related to the brightenings of a coronal loop that may be considered a result of heating.
In a way, our results are similar to those of the recent studies that reported close connections between coronal loop brightenings and small-scale activities near the photosphere. Ji et al. (2012) found upward injection of hot plasma along ultrafine loops in He i 10830 Å images that originated from the intergranular lanes in the photosphere and were associated with brightenings in EUV (171 Å) images. Zeng et al. (2013) presented evidence that these kinds of plasma injections were produced by fine-scale magnetic reconnection driven by granular-scale emergence of magnetic flux. Tiwari et al. (2014) found that the brightenings (subflares) in a braided coronal magnetic structure occurred in association with the small-scale brightenings of the transition region temperature at the regions of mixed-polarity magnetic flux. These studies as well as ours suggest that some coronal heating events may occur in relation to magnetic reconnection in the low atmosphere.
The distinctive feature of our results is the first clear detection of a magnetic discontinuity. In this regard, our observational results support the nanoflare theory of Parker (1988) since the tangential discontinuity of magnetic field is a crucial component of the theory. We note, however, that there exist subtle differences between our observational results and the classical nanoflare theory. First, the magnetic discontinuity was detected not in the corona, but in the photosphere, whereas Parker's original idea was to suppose magnetic discontinuities existed in the corona. Second, the photosphere and chromosphere near a footpoint of the coronal loop were found to be more active than the loop itself, suggesting that small-scale magnetic reconnection may be occurring in the low atmosphere rather than in the corona. This result deviates a little from the original nanoflare theory that predicts small-scale magnetic reconnections in the corona, but is very consistent with previous studies suggesting the importance of the activities near the footpoints of the coronal loops (e.g., Falconer et al. 1997; Moore et al. 1999; Aschwanden et al. 2000, 2001; Ji et al. 2012; Zeng et al. 2013). Finally, we have not found any evidence for the braiding of field lines by random motions in the photosphere predicted by the theory. In fact, we found a persistent pattern of photospheric flows in the region of the magnetic discontinuity, but it is not likely that these flows represent the braiding motions, and they are more likely to be associated with the fine-scale activities in the region, presumably small-scale magnetic reconnections occurring in the discontinuity. Rather, our observation that the helicity sign of this region is the same as that of the whole active region suggests that the magnetic discontinuity may be related to the helicity and current system of a larger-scale magnetic configuration.
The magnetic discontinuity we observed in the photosphere might be considered indirect evidence that such discontinuities exist in the corona as well and a coronal loop consists of many fine-scale braided strands that are regarded as an important feature of the nanoflare theory (Klimchuk 2006, 2015).
We are grateful to the referee for the constructive comments. This work was supported by the National Research Foundation of Korea (NRF-2012 R1A2A1A 03670387). BBSO operation is supported by NJIT, US NSF AGS-1250818, and NASA NNX13AG14G, and NST operation is partly supported by the Korea Astronomy and Space Science Institute and Seoul National University. The SDO data were provided by the Korea Data Center (KDC) for SDO in cooperation with NASA and SDO/HMI Team, which is operated by the KASI. K.-S.C. acknowledges support by a grant from the U.S. Air Force Research Laboratory, under agreement number FA 2386-14-1-4078 and by the "Planetary system research for space exploration" from KASI.