


ABSTRACT
We report Gemini Planet Imager H-band high-contrast imaging/integral field spectroscopy and polarimetry of the HD 100546, a 10 Myr old early-type star recently confirmed to host a thermal infrared (IR) bright (super-)Jovian protoplanet at wide separation, HD 100546 b. We resolve the inner disk cavity in polarized light, recover the thermal IR-bright arm, and identify one additional spiral arm. We easily recover HD 100546 b and show that much of its emission plausibly originates from an unresolved point source. The point-source component of HD 100546 b has extremely red IR colors compared to field brown dwarfs, qualitatively similar to young cloudy super-Jovian planets; however, these colors may instead indicate that HD 100546 b is still accreting material from a circumplanetary disk. Additionally, we identify a second point-source-like peak at rproj ∼ 14 AU, located just interior to or at the inner disk wall consistent with being a <10–20 MJ candidate second protoplanet—"HD 100546 c"—and lying within a weakly polarized region of the disk but along an extension of the thermal IR-bright spiral arm. Alternatively, it is equally plausible that this feature is a weakly polarized but locally bright region of the inner disk wall. Astrometric monitoring of this feature over the next 2 years and emission line measurements could confirm its status as a protoplanet, rotating disk hot spot that is possibly a signpost of a protoplanet, or a stationary emission source from within the disk.
Export citation and abstract BibTeX RIS
1. INTRODUCTION
The ∼10 Myr old early-type star HD 100546 provides an excellent laboratory for studying newly formed/forming Jovian planets and the interaction between protoplanetary disks and embedded (proto)planets. Its disk is cleared of small dust out to at least 10–15 AU (Panić et al. 2014; Walsh et al. 2014; Wright et al. 2015) and contains numerous (planet-induced?) spiral arms (Grady et al. 2005; Boccaletti et al. 2013; Currie et al. 2014d). Independent studies confirm the existence of a ≈1–10 MJ protoplanet, HD 100546 b, at ≈ r ∼ 0 5 (50 AU; Quanz et al. 2013, 2015; Currie et al. 2014d). Additionally, rovibrational CO gas monitoring suggests the presence of an unseen infant planet at/near the inner disk cavity wall (Brittain et al. 2014). HD 100546's circumstellar environment is likely an evolutionary precursor to systems of multiple super-Jovian–mass planets (e.g., HR 8799; Marois et al. 2008, 2010).
Near-infrared (near-IR; 1–2.5 μm) photometry/spectroscopy could constrain HD 100546 b's emission source and colors. However, efforts with conventional adaptive optics (AO) imaging have yielded only non-detections (Boccaletti et al. 2013; Quanz et al. 2015). However, extreme (Strehl Ratio ≳80%–90%) AO imaging, such as with the Gemini Planet Imager (GPI; Macintosh et al. 2014), yields contrasts 10–100 times deeper at HD 100546 b–like angular separations. Near-IR extreme-AO data can also improve our knowledge of HD 100546's disk via polarimetry and image/place strict limits on the predicted second companion.
In this Letter, we present GPI H-band coronagraphic integral field spectroscopy (IFS) and polarimetry of HD 100546.11 We resolve the inner disk cavity, reimage the thermal IR-bright spiral arm, and recover the HD 100546 b protoplanet. We identify a bright emission source at 13 AU along the thermal IR-bright spiral arm, consistent with a second protoplanet (a candidate "HD 100546 c") or a weakly polarized and particularly luminous region of the inner disk wall.
2. OBSERVATIONS
2.1. H-band IFS Data
We observed HD 100546 with GPI on 2015 January 18 under exceptional (03 in the optical) seeing conditions in the H band (λo = 1.6 μm, R = 44–49; 0014166 pixel−1) behind the apodized pupil Lyot coronagraph (rmask ∼ 012) and in angular differential imaging mode (Marois et al. 2006). Due to a slight off-centering of the mask edge, our inner working angle on the south side of the field is smaller (∼011) than the north side (∼013). Our observations consist of 55 co-added 59.5 s frames, yielding a total integration time of ≈55 minutes and a field rotation of 24°, or 1.3 (5) λ/D at 013 (05). Basic data reduction utilized the Gemini Data Reduction Pipeline, version 1.2.1 (Perrin et al. 2014).
For point-spread function (PSF) subtraction, we used the adaptive, locally optimized combination of images algorithm (A-LOCI; Currie et al. 2012, 2014b) considering a moving pixel mask and exploring a range of algorithm settings: the rotation gap criterion (δ), the optimization area (NA), the singular value decomposition (SVD) cutoff (SVDlim). Our previous detection of HD 100546 b favored algorithm settings including a large rotation gap, high SVD cutoff, and pixel masking since HD 100546 b is embedded in a strong, azimuthally varying disk signal (Currie et al. 2014d). A small rotation gap allows us to access regions down to the coronagraph mask edge. As a compromise, we incorporated a moving pixel mask and a small rotation gap (δ = 0.5–0.6) but an aggressive SVD cutoff (SVDlim = 0.001–0.01), the latter similar to including the first few principle components in KLIP-based PSF subtraction (e.g., Soummer et al. 2012). We constructed a final data cube from a median-combination of PSF-subtracted cubes and collapse the cube to yield a band-averaged image.
To separately assess the HD 100546 disk structure in total intensity, we rotated each data cube to north up, median-combining the cubes using a σ-clipped mean, collapsing the cube to form a final image, and spatially filtering this image using a 15 × 15 moving box.
2.2. H-band Coronagraphic Polarimetry (PI)
We downloaded public HD 100546 H-band coronagraphic polarimetry obtained during GPI commissioning on 2013 December 12, consisting of four 58.2 s exposures at four waveplate position angles with the same coronagraph mask as used with the IFS data, although better centered. For basic processing, we subtracted a dark frame, determined the position of the lenslet spots, destriped the image, and interpolated over bad pixels. We constructed a registered polarization data cube consisting of two orthogonal polarizations, subtracting the mean stellar and instrumental polarization as estimated from the signal within the mask. We use double differencing to clean the polarization pairs, rotate each image to north up, and combine the sequence to produce a total intensity image and the Q, U, and V polarized intensity images.
Combining the Q and U images as in Avenhaus et al. (2014) yields linear polarized intensity images along the perpendicular and parallel directions (P⊥ and P//). We equate P⊥ with the true polarized intensity. To conservatively estimate the polarization measurement uncertainty, we equate P// with noise.
3. DETECTIONS
3.1. PI Data and Spatially Filtered IFS Data
Figure 1 shows the reduced PI image (left), the image rescaled by its stellocentric distance squared (center), and the spatially filtered wavelength-collapsed IFS image (right). The disk's PI maxima are exterior to our inner working angle (r ∼ 012) at r ∼ 015, 016 and PA ∼340° and 50° for the northwest and southeast sides, respectively (see also Avenhaus et al. 2014). In contrast to previous results, the northwest region closest to the star has the highest polarization, roughly 1.5× that of the southeast region.

Figure 1. HD 100546 stellocentric distance-scaled disk images; an "x" denotes the positions of HD 100546 b and the candidate "HD 100546 c." (left) Polarized intensity image showing the inner working angle (magenta dashed line) and the star's position (cross). The polarized intensity drops interior to 015–02. The dark blue regions west of the visible disk identify the dark lane (Grady et al. 2001, 2005). (right) Spatially filtered, wavelength-collapsed IFS image showing the thermal IR-bright spiral-like feature (1), a second spiral (2), the position of the proposed spiral identified by Avenhaus et al. (2014) (3), and the western rim of the visible disk (4).
Download figure:
Standard image High-resolution imageThe spatially filtered IFS image recovers the thermal IR-bright arm seen (Currie et al. 2014d) plus a second (fainter) candidate spiral arm located clockwise from the thermal IR-bright one. Avenhaus et al. (2014) identify another clockwise wrapping spiral at small angular separations: our data recover this feature, although its nature (a spiral or a spiral-like feature made by a lack of dust emission at PA ∼45°) is unclear. In both polarized and total intensity, the disk signal drops precipitously beyond ∼05–055.
3.2. PSF-subtracted IFS Data
The A-LOCI-reduced IFS data easily recover HD 100546 b at a location (r ∼ 0469 ± 0012, PA = 7 04 ± 139) consistent with previous detections (Figure 2). Adopting the conservative signal-to-noise ratio (S/N) calculations described in Currie et al. (2014d)12
, the protoplanet appears in the wavelength-collapsed image at S/N ∼ 7. However, its true significance compared to residual speckle noise is far higher since the +/− 2–3σ wings of the probability density distribution of the convolved image at HD 100546 b's location are dominated by real astrophysical features (e.g., the thermal IR-bright spiral and its self-subtraction footprints), not residual speckles. Defining the noise from a ring radius at least 3 pixels more distant, a better assessment of residual speckle noise (just beyond the disk edge in polarized and scattered light), HD 100546 b has an S/N > 11.
04 ± 139) consistent with previous detections (Figure 2). Adopting the conservative signal-to-noise ratio (S/N) calculations described in Currie et al. (2014d)12
, the protoplanet appears in the wavelength-collapsed image at S/N ∼ 7. However, its true significance compared to residual speckle noise is far higher since the +/− 2–3σ wings of the probability density distribution of the convolved image at HD 100546 b's location are dominated by real astrophysical features (e.g., the thermal IR-bright spiral and its self-subtraction footprints), not residual speckles. Defining the noise from a ring radius at least 3 pixels more distant, a better assessment of residual speckle noise (just beyond the disk edge in polarized and scattered light), HD 100546 b has an S/N > 11.
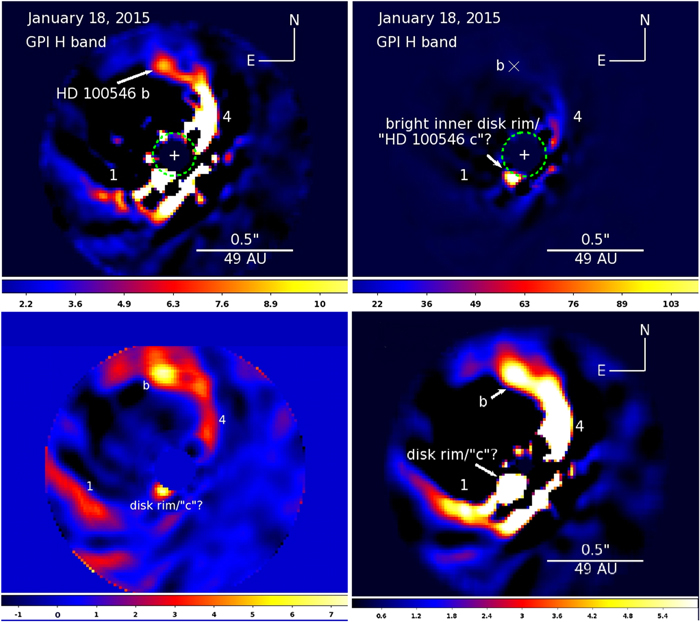
Figure 2. PSF-subtracted, wavelength-collapsed image of HD 100546 from IFS data, showing HD 100546 b (top left) and a second point-source-like feature that may be a bright disk rim or a candidate planet "HD 100546 c" (top right; image stretch multiplied by 10). HD 100546 b and "c" are about 5.5% and 9.4% as bright as the rms of the speckle halo+disk in the raw data, about a factor of 2–3 brighter relative to the halo noise than HR 8799 bcde in H-band extreme-AO data from Project 1640 (Oppenheimer et al. 2013). (bottom left) S/N map for the IFS image and (bottom right) the positions of the (candidate) protoplanets relative to disk material in a box-car smoothed (5 × 5 pixel) image.
Download figure:
Standard image High-resolution imageThe IFS data reveal evidence for additional protoplanets. We recover the thermal IR-bright spiral arm albeit partially subtracted such that only the spine is visible. Additionally, our image and S/N map identify a second peak at r ∼ 0131 ± 0009, PA ∼ 15085 ± 198 with an S/N of ∼7, consistent with being a second protoplanet, "HD 100546 c," lying along an extension of the thermal IR-bright arm. Multiple additional reductions spanning a range of algorithm space confirm our interpretation that this peak is a real astrophysical feature.
4. ANALYSIS
4.1. The HD 100546 Disk in Polarized Light
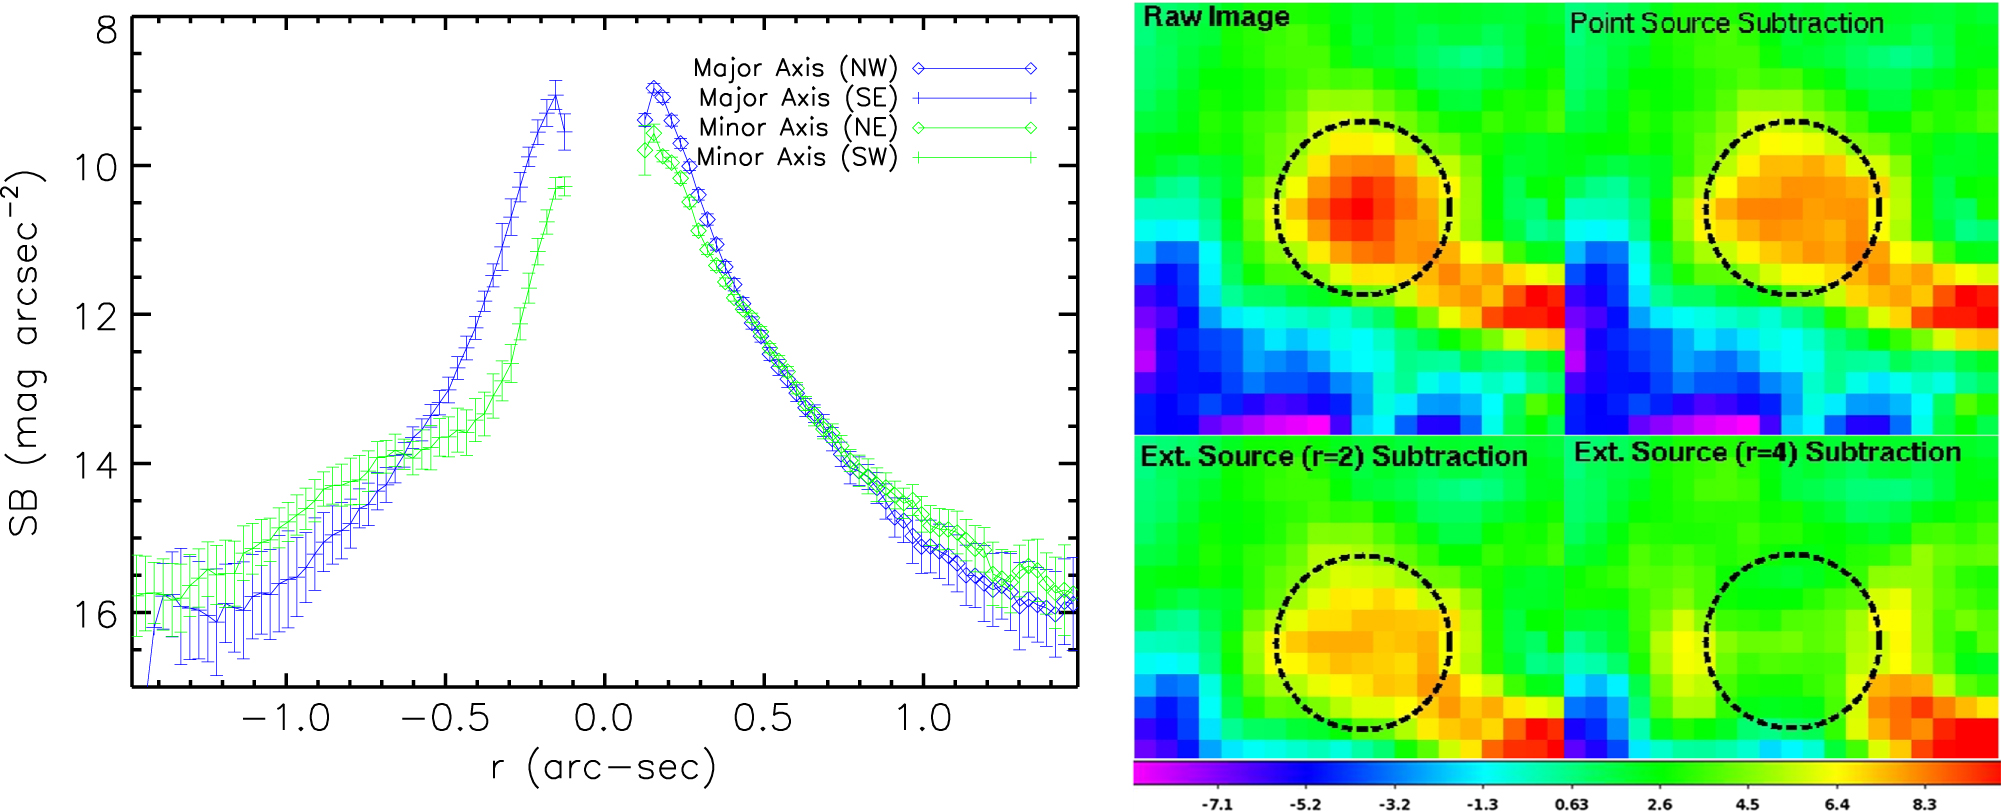
Our polarimetry data clarify the morphology of the HD 100546 disk. Following Avenhaus et al. (2014) and Quanz et al. (2011), we determined the disk's surface brightness (SB) profile along the major and minor axes (Figure 3, left panel), fixing the northwest major axis brightness at 015–90 mag arcsec−2 as measured in these papers. While our PI profiles generally agree with these studies, polarization is lower at r > 1''. In agreement with Avenhaus et al. (2014), we see evidence for a turnover in SB at r ∼ 015–016 consistent with the presence of the disk's inner cavity at a projected separation rproj ≈ 14 AU. Following the methods outlined in Avenhaus et al. (2014), our derived disk position angle is ≈148° as measured from the location of the brightest pixels on the northwest and southeast sides or ≈154° from the "centroid" of the brightest regions of these sides. We cannot disentangle the stellar PSF from the disk in total intensity nor can we use the interpolation method of Perrin et al. (2014) to extract the total intensity disk signal because the disk is not confined to a ring but essentially covers 2π radians from r ∼ 014 to r ∼ 06. Thus, we cannot derive a map of the disk fractional polarization.

Figure 3. (left) PI surface brightness profile of the HD 100546 disk computed in 10° wedges as in Avenhaus et al. (2014). (right) Close-up of final IFS image showing the region around HD 100546 b and the subtraction of HD 100546 b assuming point source and 2 or 4 pixel wide extended sources. The background disk emission covers a circular region (dotted circle).
Download figure:
Standard image High-resolution imageThere is no polarized intensity peak at the location of HD 100546 b (Figure 1(a), white "x"); the southeast polarization peak is not coincident with but counterclockwise of the candidate companion's position. The thermal IR-bright spiral arm and other (candidate) spiral arms do not appear in polarized light.
4.2. Characterization of HD 100546 b
4.2.1. HD 100546 b with a Point-source Component
Currie et al. (2014d) find that HD 100546 b plus the surrounding circumstellar disk material can be matched by a simple Gaussian whose FWHM is consistent with a slightly extended emission source; Quanz et al. (2015) model HD 100546 b's emission as originating from a point source and spatially resolved emission from the circumstellar disk, reporting photometry for the point-source component. With a smaller PSF core, GPI data allow us to determine whether HD 100546 b is better interpreted as a point source or extended source.
To study HD 100546 b's morphology, we simulate the detection and annealing of signals with a variety of spatial scales using A-LOCI forward-modeling (Currie et al. 2015). We derive the GPI PSF in each wavelength slice from the average of satellites in the an unsharp-masked, median-combined stack of data cubes. We consider an unresolved point source and extended sources up to 4 pixels in radius, comparable to sizes found by Currie et al. (2014d) to be consistent with HD 100546 b's L' detection and determine the proper scaling between the model PSF and the data by minimizing the determinant of the Hessian matrix at HD 100546 b's position (see Quanz et al. 2015).
Subtracting a best-fit point source at HD 100546 b yields a flat disk signal without over subtracting the disk (Figure 3, right panel), providing evidence that HD 100546 b likely has a point-source component. A two-pixel radius extended source cannot easily be ruled out, but produces higher residuals along the PSF y-axis and some evidence of oversubtraction (i.e., a slight depression in signal at HD 100546 b's location fainter signal). A four-pixel radius extended source yields very strong residuals: brighter, nonphysical peaks lying just exterior the circular region defining the background disk feature.
4.2.2. HD 100546 b's IR Colors and Circumplanetary Material
Assuming HD 100546 b is a point source at its core, we can estimate the point-source component's photometry and colors. Using the best-fit point-source scaling, HD 100546 b's apparent magnitude: mH = 19.40 ± 0.32, where the errors consider the intrinsic S/N, the uncertainty in the satellite spot calibration, and the uncertainty in the throughput correction. Using the models of Mulders et al. (2011, 2013) adopted in Quanz et al. (2015), the disk extinction at HD 100546 b's location is AH = 3.4. Assuming a distance of 97 ± 4 pc (Berriman et al. 1994), the unreddened absolute magnitude is then MH = 11.06 ± 0.33.
As shown in Figure 4, the protoplanet's H absolute magnitude is comparable to that for objects near the M/L transition, but with H–L' ≈ 3.2 it is redder than all but the reddest L/T transition dusty/cloudy young super-Jovian planet, HD 95086 b (Rameau et al. 2013; Galicher et al. 2014). Red near-to-mid-IR colors have been cited as evidence for thicker clouds than present in field brown dwarfs with similar temperatures (Currie et al. 2011). However, HD 100546 b lies redward of the AMES-DUSTY model locus, the rough limit of a realistic cloudy atmosphere filled with submicron-sized dust.

Figure 4. (left) H–H–L' color–magnitude diagram comparing HD 100546 b to the MLT dwarf sequence from Leggett et al. (2010), imaged planet-mass companions (PMCs), the COND and DUSTY limiting-case planet/brown dwarf atmosphere model loci (Allard et al. 2001; Baraffe et al. 2003), and the loci of colors for accretion-dominated protoplanets (Zhu 2015). PMCs draw from the compilation in Currie et al. (2013) updated to include new ROXs 42Bb photometry (Currie et al. 2014a, 2014c). (right) PSF-subtracted image and model disk rim compared to a simulated, PSF-subtracted disk rim and a rim+point source.
Download figure:
Standard image High-resolution image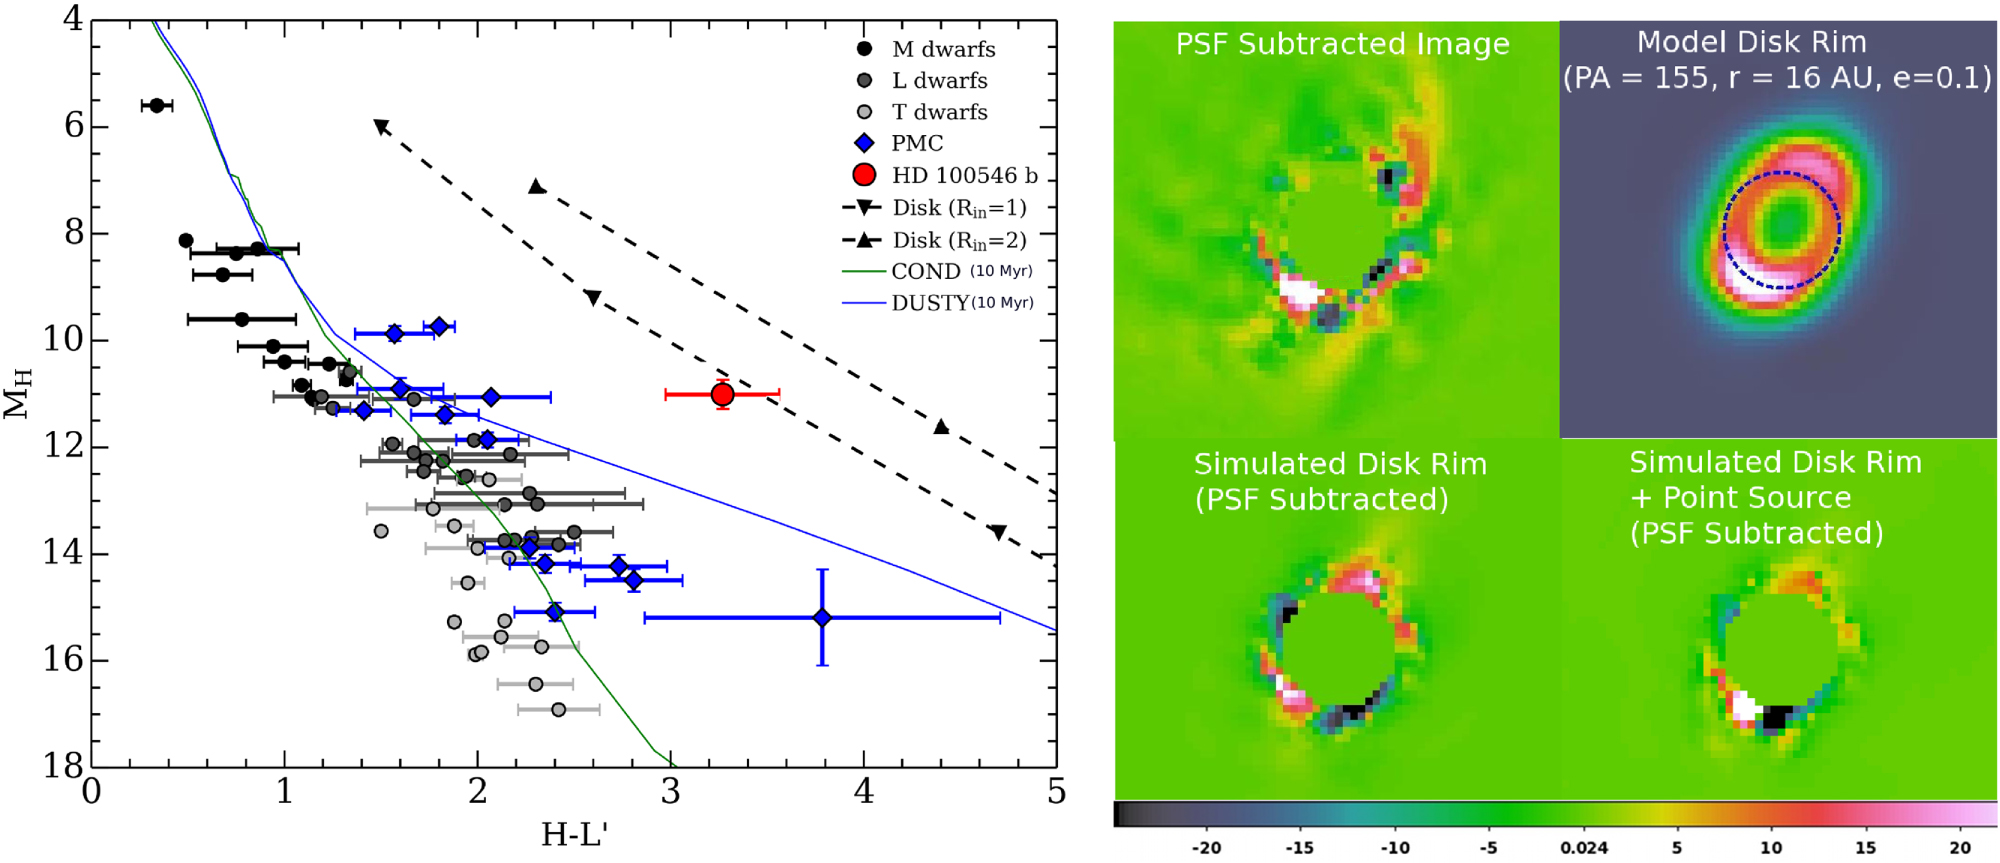
The IR colors of HD 100546 b's point-source component suggest the presence of a circumplanetary disk as hypothesized by Currie et al. (2014d). The object is redder than GSC 06214B, a substellar companion whose accreting circumsecondary disk produces a broadband mid-IR excess (Bowler et al. 2011; Bailey et al. 2013). The predicted diagram positions for accreting protoplanets from Zhu (2015) matches HD 100546 b's position for an inner radius of 1 RJ and an accretion rate of 3 × 10⁻⁶ M/MJ × (MJ yr−1). For an inner radius of 2 RJ, comparable to the estimated radii for the youngest imaged planets (Currie et al. 2013, 2014b), the models are about 0.75 mags too red. The inconsistency can be reconciled if the H-band emission originates from a higher-temperature planetary photosphere (e.g., Teff ≈ 1000–2000 K), while the disk dominates the L' emission. HD 100546 b's H-band photometry then implies a mass of 3–4 MJ if the companion is newly born (e.g., 1 Myr old; cf. Baraffe et al. 2003; Spiegel & Burrows 2012).
4.3. "HD 100546 c": A Weakly Polarized Disk Feature or a Second Protoplanet?
The putative "HD 100546 c" requires careful scrutiny despite its high detection significance. On one hand, its position is at an identical separation to and within 2σ of the position angle predicted for a second protoplanet ("HD 100546 c") orbiting HD 100546 near the inner disk wall (r ≈ 014, 130° ± 10° for 2015 January 18). It is not the same feature as the local peak in polarized intensity; it appears interior to the PI-inferred disk wall. However, the candidate is located very close to the mask edge (Δr"c"-mask ≈ 0020): disk emission continuing at smaller separations would be preferentially extincted on one side. If "HD 100546 c" is instead the brightest region of an inner disk rim that extends to r < 012, the mask extinction in combination with PSF annealing could make it appear like a point source.
To assess these effects, we simulated "HD 100546 c" with forward-modeling as a partially subtracted (1) disk ring coplanar with the main disk, (2) extended source 4 pixels wide, (3) point source, and (4) combinations of 1–3. For scenario (1), we constructed a grid of models using GRATER (Augereau et al. 1999), varying the position angle (145°–155°), eccentricity (0–0.1), density power law (αin = 10, 5), and radius (14–16 AU).
Figure 4 (right panel) compares representative simulated images to the data and to the disk rim model. The simulated rim model struggles to reproduce the shape of the candidate: the emission confined far too narrowly in angular separation and shifted clockwise. The 4 pixel wide extended source model (not shown) fails in a similar manner. While the simulated point source (not shown) shows far better agreement at the location of the candidate, combining its signal with that of the simulated disk rim model (especially for PA = 150°–155°) fares even better, reproducing both the main signal and the residual trail of residual emission wrapping clockwise from the seven o'clock position to the nine o'clock position.
Photometry for "HD 100546 c" is broadly consistent with that expected from a young protoplanet. If it lies interior to the disk, our forward-modeling suggests an upper limit on the point-source component's apparent magnitude of 13.08 ± 0.64, comparable to a 10–20 MJ newly formed planet (Baraffe et al. 2003; Spiegel & Burrows 2012), consistent with estimates based on modeling the inner disk's morphology (Mulders et al. 2013).
5. DISCUSSION AND FUTURE WORK
HD 100546 b likely includes a point-source component and derives some of its emission from circumplanetary material. Its H-band spectrum could provide the first assessment of how a protoplanet spectrum compares to that of fully formed planets and brown dwarfs (R. Cloutier et al. 2015, in preparation). Given extreme computational challenges in forward-modeling, the complex HD 100546 disk structure and our lack of knowledge about what an infant protoplanet's spectrum (likely including planet and circumplanetary signal) should look like, extracting a spectrum for the disk to compare with that of HD 100546 b and decisively interpreting the protoplanet is not feasible right now. However, future observations utilizing a reference PSF may obviate the need for forward-modeling of the disk and allow us to at least directly compare the disk's spectrum to that of the protoplanet.
Although circumstantial evidence suggests that the putative "HD 100546 c" may be the proposed second planet responsible for clearing out the inner disk cavity, our analysis is not conclusive since the source is close to the disk wall and the GPI coronagraph mask edge. Alternate scenarios include a stationary, weakly polarized disk feature and an orbiting (unresolved?) disk hot spot that may or may not be induced by a planet. If the candidate is a planet and is rapidly accreting gas, it may show up as unusually bright in Hα or Paβ.
Orbital monitoring may also clarify the nature of this candidate. A planet in Keplerian orbit at 13 AU around a 2.4 M⊙ star and coplanar with the disk moves ≈12° yr−1 in the Brittain et al. model. Projected on the sky, this motion is ≈2 GPI pixels over the next two years and thus may be too small to confirm orbital motion to distinguish this candidate from a stationary disk feature. However, the predicted companion from Brittain et al. should have been at an orbital phase of ≈154° on 2015 January 18. Once its orbital phase reaches 180°, it will be positioned directly behind the disk wall in projection. Thus, if the candidate "HD 100546 c" is the predicted protoplanet inferred from CO rovibrational measurements, not a stationary disk feature or a planet-induced hot spot on the disk wall, it will likely disappear from view sometime in 2017. CO monitoring and GPI multi-epoch imagery combined with wider parameter space of simulated disk rim models should soon determine the nature of this candidate and clarify the inner circumstellar environment of HD 100546.
We thank Gijs Mulders, Wladimir Lyra, Nienke van der Marel, and the anonymous referee for helpful comments. This work is supported through NASA Origins of Solar Systems program NNG13PB64P.
Footnotes
- 11
This Letter's analysis is limited to photometry extracted for any (candidate) planets. A separate, later work will analyze spectra (R. Cloutier et al. 2015, in preparation).
- 12
All S/N estimates are corrected for final sample sizes (Mawet et al. 2014).