

Abstract
Polycationic photosensitizers (PS) are not susceptible to aggregation in solutions, but their high local concentrations in Gram-negative bacteria can be sufficient for aggregation and reduced effectiveness of antibacterial photodynamic treatment. By measuring fluorescence spectra and kinetics we were able to evaluate the degree of aggregation of polycationic PS ZnPcChol8 in Gram-negative bacteria E. coli K12 TG1. Binding of ZnPcChol8 to E. coli K12 TG1 leads to an appearance of groups of molecules with shorter PS fluorescence lifetime, a decrease in fluorescence intensity and a shift in the fluorescence spectral maximum. However, we evaluated that about 88% of the fluorescing PS molecules in the bacteria were in an unaggregated state, which indicates only a small reduction in the generation of reactive oxygen species.
Export citation and abstract BibTeX RIS
Antibacterial photodynamic treatment (APDT) is a promising method of inactivation of bacteria, especially considering the issue of the bacteria developing resistance to antibiotics. APDT operates through production of reactive oxygen species (ROS) by photosensitizer (PS) molecules under light illumination. The main advantages of APDT are the lack of resistance development after exposure, selective binding to pathogens, local administration of a PS and localized irradiation with light, minimizing the side effects [1–4].
The role of hydrophilic PS molecule charge in aqueous compositions plays an important role in APDT of bacteria [5, 6]. High concentrations of PS molecules can result in their aggregation, which leads to the reduction in their excited state lifetime and, as a consequence, in the fluorescence and ROS quantum yield. The Coulombic electrostatic repulsion between PS molecules with the same charge prevents their aggregation in aqueous solutions, resulting in sustained high quantum yields of ROS of polycationic PSs based on phthalocyanines across a broad range of concentrations [7]. Polycationic photosensitizers effectively bind to Gram-negative bacteria, which are in general more resistant to photodynamic effects, and effectively inactivate them [8]. At the same time, fluorescence correlation spectroscopy findings [7] indicate that due to the high local concentration of polycationic PS molecules near Gram-negative bacteria, local aggregation of PS molecules can occur there. To confirm this assumption and assess potential levels of aggregation, spectral-fluorescence and kinetic studies of Gram-negative bacterial dispersion fluorescence when sensitized with a polycationic photosensitizer were carried out in this work.
Materials and methods
Research was carried out on Gram-negative genetically engineered bacteria E. coli K12 TG1 [9]. As a photosensitizer, solutions of octacationic ZnPcChol8 [7] of various concentrations (75%–85% purity by element analysis, Organic Intermediates and Dyes Institute, Russia) were used. The synthesis details of the used PS are described in [10]. This PS is known to efficiently bind to these bacteria and inactivate them [8].
The measurements were done in the range of PS concentrations 1 μM to 5 μM. The samples were prepared both as aqueous solutions, PBS solutions, and as bacterial dispersions after incubation with the PS for 10 min, centrifugation for 15 min at 15 000 rpm, and in the withdrawn supernatant.
Spectra and integral fluorescence studies of the ZnPcChol8 in aqueous solutions and in E. coli K12 TG1 bacterial dispersion were carried out under excitation by He-Ne laser light (wavelength 633 nm) using a LESA-01-Biospec fiber spectrometer (Biospec, Russia). The exciting laser radiation and the fluorescence was delivered via optical fibers (with the probe consisting of one central excitation fiber and six receiving fibers), and measured in the backward mode in quartz optical cell (cell length 1 cm, cell wall 1 mm thick).
The fluorescence kinetics of the ZnPcChol8 in aqueous solutions, in PBS, and in the supernatant and were measured using a spectroscopic complex (Hamamatsu, Japan) based on a C10627-13 streak camera with a PLP-10 pulsed picosecond laser (FWHM 65 ps, 637 nm) for the PS excitation [11]. The signal was measured in the single photon counting mode of the streak camera. The measurement allowed obtaining the distribution of the registered fluorescence photons according to their wavelength (620–780 nm, 0.26 nm/pixel) and delay time (figure 1). The camera sweep time was set to 10 ns with 20 ps/pixel, while the accumulation time per frame was 7 ms with total accumulation time of 10 min per sample. We used a stock Hamamatsu color glass long-pass optical filter with 50% absorption at 660 nm.
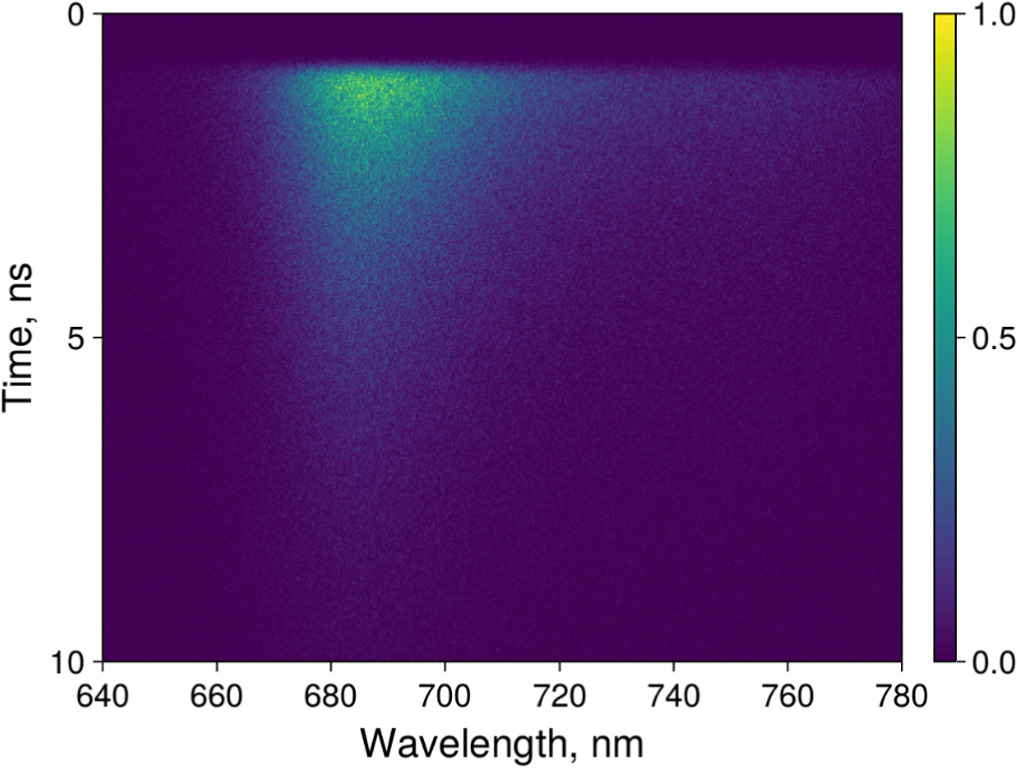
Figure 1. Spectrally and time-resolved signal of ZnPcChol8 in 1 μM aqueous solution.
Download figure:
Standard image High-resolution imageThe fluorescence kinetics of ZnPcChol8 in bacterial cells and in supernatant were investigated using laser scanning confocal microscope LSM-710-NLO (Carl Zeiss AG, Germany). The fluorescence spectra and the fluorescence images were obtained under He-Ne laser excitation at 633 nm. The fluorescence lifetime kinetics were obtained under two-photon excitation with Coherent Ultra II (Coherent, USA) Ti-sapphire laser (140 fs pulse width, 80 MHz repetition rate) at 770 nm (two-photon excitation at 385 nm), which excites the PS in the Soret band. The excitation laser power was set to 1% in the microscope control software, which corresponded to 1 mW (measured with LabMax-TO laser power meter, Coherent, USA), to avoid PS photobleaching or cell destruction. A short-pass interference filter from stock Zeiss filter set with cutoff wavelength 760 nm was used to attenuate the laser light. Time-resolved fluorescence signal was measured with a FLIM module (Becker & Hickl GmbH, Germany) attached to the microscope, consisting of a time-correlated single photon counting system SPC-150, a GaAsP HPM-100-07 hybrid photodetector, and controlled with SPCM software. This system allowed measuring the fluorescence decay kinetics in a single channel, with 12 ps/pixel binning.
The instrument response function (IRF) of the picosecond laser coupled with streak-camera has FWHM consistent with the technical documentation and is narrower than the gaussian distribution, the actual time offset is subject to fluctuation with ambient temperatures for long accumulation times. Due to the laser attenuation with the utilized optical filter, the setup didn't allow us to simultaneously measure the IRF and the fluorescence signal. In an attempt to take the possible blurring into consideration, we approximated it with a gaussian.
In general, fitting data synthesis is done by convolution of the IRF and the exponential function. But with the assumption of gaussian-like IRF we can utilize an exponentially modified gaussian function [12]:
where μ and σ — central time and width of the exciting laser pulse, and erfc is the complementary error function
This function is an exact solution for convolution of gaussian with exponent, so as to not consider specific measurement binning.
The investigation of fluorescence decay lifetime of the ZnPcChol8 molecules in association with the bacteria was done with maximum entropy method approach [13–15] to evaluate individual lifetime components in bacteria and in supernatant. This method allows calculating decay amplitude distribution A(τ), which is equivalent to probability density that the observed fluorescence decay occurred with lifetime τ. On this distribution, individual components are presented as separate peaks and their total amplitude and intensity can be calculated. In this work, we used 200 values of τ, that were evenly distributed on a logarithmic scale between 10−2 and 10 ns and are not based on the expected values of fluorescence decay lifetime. For each  a scaled synthetic fluorescence decay curve
  was generated with the shared values of μ and σ. Optimization package Optimization.jl of Julia programming language was used to evaluate the values of μ and σ that produce the best fitting data [16]. By taking into account the results [17] of the studies of the fluorescence lifetime values for non-aggregated phthalocyanine molecules, their dimers, and higher-order aggregates, the percentage of intensity from the non-aggregated PS can be calculated.
The separation of the fluorescence decay amplitude distribution was done according to local minima between peaks. The sum  is equal to the total fluorescence decay amplitude of the component, while the
  is the observed fluorescence intensity of the component. The mean value of τ for a component was calculated as
Results
The fluorescence intensity of sensitizing solution of studied PSs is noticeably higher compared to fluorescence intensity of sensitized bacterial dispersions, especially at low PS concentrations (figures 2, 3). However, this difference decreases from 5 times at 1 μM to 2 times at 5 μM. The dependence of the fluorescence intensity of ZnPcChol8 solutions in water on its concentration in the range of 1–5 μM is close to linear or slightly sublinear, while in the bacterial dispersion of E. coli K12 TG1 the dependence becomes superlinear.

Figure 2. Fluorescence spectra of ZnPcChol8 in aqueous solutions (1, 2, 3) and in a bacterial dispersion of E. coli K12 TG1 (4, 5, 6) with different concentrations: 1, 4–1 μM; 2, 5–2.5 μM; 3, 6–5 μM.
Download figure:
Standard image High-resolution image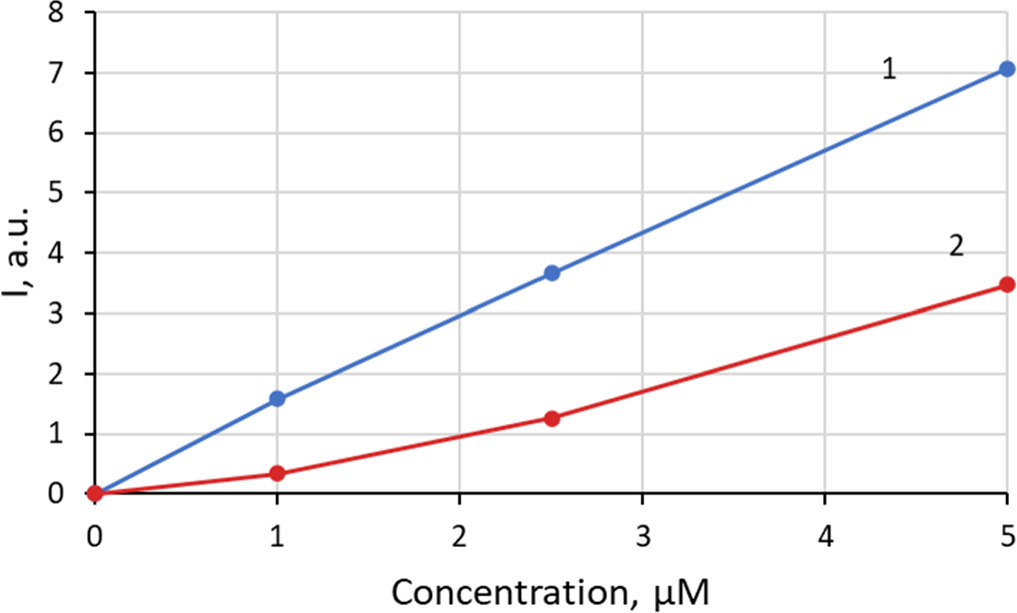
Figure 3. The dependence of the integral intensity of fluorescence on ZnPcChol8 concentration in solutions (1) and E. coli K12 TG1 sensitized bacterial dispersions (2).
Download figure:
Standard image High-resolution imageStudies of the fluorescence kinetics of ZnPcChol8 in solutions and supernatant with a streak-camera revealed only one type of fluorescent species with a rather long (>2.5 ns) lifetime (figure 4, table 1). According to [17] it corresponds to non-aggregated molecules of this PS (although with increasing concentration and adding PBS in accordance with the composition of the sensitized bacterial dispersion, the lifetime decreases slightly).

Figure 4. Normalized decay kinetics of ZnPcChol8 fluorescence in solutions (A); distribution of fluorescence lifetime of ZnPcChol8 in solutions over the range 1–10 ns, normalized to decay kinetics amplitude (B). Fluorescence was excited at 637 nm with 65 ps laser pulses.
Download figure:
Standard image High-resolution imageTable 1. Fluorescence lifetime of ZnPcChol8 in solutions at different concentrations and in supernatant obtained after centrifugation of bacteria after sensitization with ZnPcChol8 5 μM.
| Medium | τ, ns |
|---|---|
| 1 μM | 2.59 ± 0.68 |
| 1 μM+PBS | 2.54 ± 0.74 |
| 5 μM | 2.60 ± 0.70 |
| 5 μM+PBS | 2.51 ± 0.68 |
| Supernatant | 2.50 ± 0.68 |
The fluorescence images of the bacterial dispersions were obtained on the confocal microscope. They show the accumulation of the PS in the bacteria with uniform distribution (figure 5). The study of fluorescence of solutions and bacterial dispersions sensitized with ZnPcChol8 of different concentrations, as well as re-suspended bacteria and supernatant showed that the shape of the spectra in aqueous solutions and bacterial dispersions practically does not change in the studied concentration range, the half-width of the fluorescence band remains narrow (less than 30 nm, figures 2, 6), but the spectral maximum of the fluorescence band of sensitized bacteria is shifted to the long wavelength side by about 4 nm compared to the fluorescence spectrum of the solution or supernatant.

Figure 5. Laser scanning microscope images in control and after incubation with ZnPcChol8. Grayscale obtained in the transmission mode, red color — ZnPcChol8 fluorescence excited at 633 nm.
Download figure:
Standard image High-resolution image
Figure 6. Fluorescence spectra of the supernatant and re-suspended sensitized bacteria.
Download figure:
Standard image High-resolution imageThe study of ZnPcChol8-sensitized E. coli K12 TG1 bacteria fluorescence kinetics was done on laser scanning confocal microscope and revealed three fluorescing groups with different lifetimes (figure 7, table 2). The relative intensity of the fluorescing group with highest lifetime of about 2.3 ns, which is close to the lifetime of non-aggregated ZnPcChol8 in solutions, is about 88%. The intensity was calculated as a  for each component, which means that even with a lower decay amplitude, the higher lifetime component can have a higher fluorescence intensity.

Figure 7. Normalized decay kinetics of ZnPcChol8 fluorescence in supernatant and E. coli K12 TG1 bacteria (A); Distribution of evaluated fluorescence lifetime in supernatant and E. coli K12 TG1 over the range 0.01–10 ns, normalized to decay kinetics amplitude (B). Fluorescence was excited by two-photon excitation at 770 nm with 120 fs laser pulses.
Download figure:
Standard image High-resolution image
Table 2. Fluorescence lifetime of ZnPcChol8 groups bound to E. coli K12 TG1 bacteria and their contribution to fluorescence. Amplitude is the percentage of decay kinetic amplitude explained by the decay component, intensity is the percentage of observed photons that come from the decay component.
| Supernatant | E. coli | |||||
|---|---|---|---|---|---|---|
| i | Amplitude | τ, ns | Intensity | Amplitude | τ, ns | Intensity |
| 1 | 3.82% | 0.166 ± 0.017 | 0.28% | 42.24% | 0.054 ± 0.002 | 2.34% |
| 2 | 2.92% | 0.712 ± 0.149 | 0.87% | 20.53% | 0.481 ± 0.094 | 10.06% |
| 3 | 93.26% | 2.438 ± 0.516 | 98.85% | 37.23% | 2.300 ± 0.780 | 87.60% |
Discussion
As suggested in [7], the local concentration of polycationic molecules near bacteria can significantly exceed the average volume values due to the electrostatic attraction of these molecules to gram-negative bacteria. This leads to ZnPcChol8 aggregation in local zones near bacteria and can be seen in a decrease in the fluorescence intensity of ZnPcChol8 sensitized dispersions of E. coli K12 TG1, as well as in the appearance of groups with different fluorescence lifetimes, which can be interpreted as groups of ZnPcChol8 molecules associated with bacteria with different degrees of aggregation (a group with a relatively long lifetime of 2.3 ns, which corresponds to bacteria-associated non-aggregated molecules, and two groups with short (0.288 ns) and very short (0.094 ns) lifetimes, presumably corresponding to dimers or higher-order aggregates, or molecules bound to biological macromolecules) [17]. Aggregation leads to a noticeable decrease in the number of PS molecules in the non-aggregated state (taking into account that the number of PS molecules bound in aggregates (multi-particle associates) is more than the number of aggregates) and the fluorescence intensity in the sensitized bacterial dispersion compared to solutions. Since the PS fluorescence and the generation of singlet oxygen or other ROS are competing processes (one is the radiative transition from the excited singlet state of the molecule, the other involves transition of the molecule into triplet state), the decrease in the fluorescence lifetime is a sign of another competing relaxation pathway that significantly reduces the rate of ROS production. It can also be expected such decrease in the number of unbound photoactive molecules associated with bacteria also reduces the efficiency of APDT. With an increase in the concentration of ZnPcChol8 in bacterial dispersion, the decrease in the intensity of its fluorescence compared to solutions is noticeably smaller (presumably due to the limited number of binding sites [7]), as a result of which the dependence becomes superlinear (figure 3).
The long-wavelength shift of the ZnPcChol8 luminescence spectral maximum in the re-suspended bacterial dispersion compared to the supernatant and sensitizing solutions can be associated both with fluorescence reabsorption in local zones near bacteria, where the PS concentration is much higher than the volume average, with subsequent reemission [18], or with the spectral shift of the absorption and fluorescence bands of phthalocyanines upon binding to cell membranes [19, 20].
Similar features of the spectral and fluorescent properties of multi-charged phthalocyanine molecules were observed in area of their high local concentration caused by the electrostatic binding of these molecules to the polymer shell of chalcogenide nanocarriers (quantum dots) [21].
It should be noted that many tetrapyrroles that are promising for APDT, including derivatives of phthalocyanines [22] and synthetic bacteriochlorin [23], have not a planar, but rather a three-dimensional spatial structure, and are less susceptible to aggregation in an aqueous medium and, presumably, when bound to gram-negative bacteria.
Conclusions
Polycationic photosensitizers effectively inactivate Gram-negative bacteria due to the effective binding of their molecules to bacteria and low aggregation in aqueous compositions, which positively affects the efficiency of APDT. However, as demonstrated by the results of this work, the electrostatic attraction of a large number of polycationic photosensitizer molecules to Gram-negative bacteria can cause to such a high concentration of PS molecules near the bacterial surface that a significant part of them aggregate upon binding to the bacterial membrane. This reduces the fluorescence efficiency and, in principle, can reduce the APDT efficiency. In particular, spectral and kinetic studies of the sensitization of Gram-negative bacteria E. coli K12 TG1 with the octacationic antibacterial photosensitizer ZnPcChol8 demonstrated that the proportion of non-aggregated molecules of this PS associated with bacteria during sensitization is around 88%.
To improve the photodynamic inactivation of bacteria, it is necessary to take into account all the properties of the PS that affect aggregation and binding to bacteria, including the aggregation caused by this binding, and optimize these properties, primarily, the concentration, the number of cationic substituents and three-dimensional spatial structure of photoactive molecules.
Acknowledgments
The research of Igor D Romanishkin, Gennady A Meerovich, Victor B Loschenov was supported by the Ministry of Education and Science of the Russian Federation (grant No. FFWF-2023-0005 for fundamental scientific research of state academies of sciences and grant No. 075-15-2022-315 for the creation and development of world-class research centers 'Photonics'), the Center for collective use No. 74834 'Technological and diagnostic center for the production, research and certification of micro and nanostructures' in GPI RAS. The research of Marina G Strakhovskaya was supported by the Interdisciplinary Scientific and Educational School of Moscow University 'Fundamental and Applied Space Research'.
Data availability statement
All data that support the findings of this study are included within the article (and any supplementary files).
Declaration of competing interest
The authors declare no conflict of interest.