

Abstract
Metal phosphorous trichalcogenide is an important group of layered two-dimensional (2D) materials with potentially diverse applications in low-dimensional magnetic and spintronic devices. Herein we present a comprehensive investigation on the lattice dynamics and spin–phonon interactions of mechanically exfoliated atomically thin 2D magnetic material—iron phosphorus trisulfide (FePS3) by Raman spectroscopy and first principle calculations. Layer-number and temperature dependent Raman spectroscopy suggests a magnetic persistence in FePS3 even down to monolayer regime through the spin–phonon coupling, while the Néel temperature decreases from 117 K in bulk to 104 K in monolayer sample. Our studies advocate the intriguing magnetic properties in 2D crystals and suggest that FePS3 is a promising candidate material for future magnetic applications.
Export citation and abstract BibTeX RIS
1. Introduction
Recently, graphene and other two-dimensional (2D) materials, such as transition metal dichalcogenides and black phosphorus, have attracted considerable interest for potential applications in ultrathin devices [1–9]. For instance, as the layer number of molybdenum disulfide (MoS2) decreases from few-layer to monolayer, the bandgap exhibits an indirect-to-direct transition [10], while strong spin–orbit coupling leads to fascinating valleytronic properties [11, 12]. Contrary to extensive progresses on 2D electronic and optoelectronic devices, 2D materials with non-trivial magnetic properties are rarely explored [13–16]. Magnetic materials are widely used in data storage, memory devices and medicine [17, 18]. 2D magnetic materials may provide solutions for high density data storage and retention time of nonvolatile memories constrained by conventional magnetic materials. Therefore, it is timely to explore novel 2D magnetic materials, particularly to understand how the spin properties are affected in atomic thickness. However, the studies on atomically thin 2D magnetic materials are rarely reported, in part due to unavailability of such samples.
Metal phosphorous trichalcogenide (MPT) (MPX3; M = Fe, Ni, Mn, etc.; X = S and Se) is an important group of 2D materials, especially in the field of intercalation chemistry [19–21], magnetism [21–27] and spintronic devices [28]. Among them, iron phosphorus trisulfide is expected to be mechanically exfoliatable due to its weak van der Waals inter-layer interaction [29]. FePS3 has been of interest for its realization of antiferromagnetic 2D Ising model on a honeycomb lattice [24, 27]. As temperature decreases across ∼118 K, FePS3 would undergo a magnetic phase transition from the paramagnetic to the antiferromagnetic phase [23, 30]. Two most accepted models of magnetic structure were proposed by Le Flem and Kurosawa, respectively [23, 30]. The primary spin interaction was explained differently in the two modes, which would be the key point to predict the magnetic stability in the ultrathin sample. Therefore, a better knowledge of spin interaction will be useful for the design of future atomically thin 2D device applications. However, previous studies on magnetic structure of FePS3 were all performed on bulk crystal with standard bulk measurements, such as magnetic susceptibility [23], neutron diffraction [30] and x-ray diffraction [31], which could only access macroscopic magnetic properties. Since FePS3 is of a 2D nature, its reduced dimensionality provides us the opportunity to distinguish between the intra-layer and the inter-layer magnetic interactions. Raman spectroscopy provides a powerful technique to probe the phonon and electronic properties down to monolayer regime. Beyond that, several studies on spin properties in various systems using Raman spectroscopy were reported based on spin–phonon coupling and quasi-elastic scattering [32, 33]. For example, the onset of magnetic ordering lowers the crystal symmetry, resulting in Raman intensity variation and possibly activation of new Raman modes [34]. The spin-dependent Raman scattering of bulk FePS3 has been extensively investigated in both experiments and theory [35, 36]. The results showed that additional phonon peaks (88 and 95 cm−1) were observed below the Néel temperature, due to the spin–phonon coupling [36–39].
In this work, we have conducted a systematic investigation of the layer-number dependent lattice dynamics of FePS3 using Raman spectroscopy. Supported by first principle calculations, our results verify the magnetic persistence in monolayer sample, elucidating that the intra-layer spin arrangement dominates the magnetic structure. Moreover, the layer-number dependent Raman spectra show that the magnetic phase transition temperature decreases from bulk to monolayer samples.
2. Experimental section
2.1. Crystal synthesis of FePS3
FePS3 crystals were grown by the chemical vapor transport method (figure S1) as reported at our previous paper [29].
2.2. General characterizations
The experimental powder x-ray diffraction (PXRD) agrees with the pattern of JCPDS # 30-0663 very well with C2/m space group (figure S2(b)). Because PXRD was directly performed on a big plate crystal, the (00l) peak preferred orientation was identified. Selected area electron diffraction also confirmed the crystal symmetry (figure S3). The exfoliated FePS3 flakes were characterized by using optical microscopy (Olympus BX51) and atomic force microscopy (AFM) (Asylum Research Cypher S) in a tapping mode.
2.3. Raman characterization
Raman measurements were carried out on a triple-grating micro-Raman spectrometer (Horiba-JY T64000). A cryostat (Cryo Industry of America, USA) was used to provide a continuous temperature from 77 to 300 K by liquid nitrogen flow. A solid state laser (λ = 532 nm) was used to excite the sample. The backscattered signal was collected through a 50× long focus objective, dispersed with a 1800 g mm−1 grating. To avoid sample heating by the laser beam only few hundreds of microwatts laser excitation was used in the experiments.
2.4. Calculation method
First-principles density-functional theory (DFT) calculations were used to study the electronic structures and magnetic phase stability of bilayer and bulk FePS3. The generalized gradient approximation (GGA) [40] was used to describe the exchange-correlation potential. The cell dimensions and ionic positions were optimized using the Vienna ab-initio simulation package [41, 42] with the full-potential projector augmented wave method [43, 44] DFT-D2 method [45] was used to describe van de Waals interactions. The Hubbard potential U of 6.8 eV and J = 0.89 eV for the correlation effects on the localized d-orbital of iron atoms were used. To get converged results, a plane-wave energy cutoff of 500 eV and an 8 × 4 × 8 mesh for the Brillouin-zone integration were used. Atomic relaxation was stopped when the forces on all the atoms were less than 0.003 eV Å−1. The phonon dispersion relations of FePS3 were calculated using the density-functional perturbation theory [46, 47].
3. Results and discussion
In FePS3 crystal, Fe atoms are coordinated with six S atoms, while P atoms are tetrahedral coordinated with three S atoms and one P atom to form a [P2S6]4− unit (as shown in figure 1(a)). The [P2S6]4− units are connected with six Fe atoms, which are arranged in a honeycomb plane structure. Each layer has the same atomic arrangement, with an inter-layer spacing (between two layer centers) of about 6.42 Å (figure 1(b)). The mono- and few-layer FePS3 flakes were mechanically exfoliated from the bulk crystal by Scotch tape and prepared on freshly cleaned Si substrates with a 285 nm thick SiO2 top-layer (figure 1(c)), confirmed by AFM (figures 1(d) and (e)) [48]. The samples with different layer number on the surface of SiO2 layer showed different optical contrast due to the interference, which would also affect the signal intensity in subsequent Raman spectroscopy measurement. However, it is hard to conduct an explicit calculation on the interference now due to the absence of the reflective index of FePS3 even for its bulk counterpart, while a systematic study is indeed necessary in the future.

Figure 1. (a) Crystal structures of FePS3 bulk crystal on top view. (b) The unit cell (black line) and the primitive cell (red line) of FePS3. (c) Optical microscopy image of exfoliated FePS3 nanoflakes on a 285 nm silicon oxide/Si substrate. (d) The original atomic force microscopy (AFM) image and (e) the plot of height of the monolayer and bilayer samples.
Download figure:
Standard image High-resolution imageRaman spectrum of bulk FePS3 sample at room temperature (293 K) was shown in figure 2(a). Six Raman peaks, whose values were shown in table S1, could be resolved in the spectrum. Most previous analyses on phonon modes in FePS3 had been interpreted in a simplified way with the unit cell of FePS3 being considered as a pseudo-cell constituted by two iron cations and a [P2S6]4− anion [29, 36, 49]. Nonetheless, to assign the Raman modes more accurately, it is significant to consider the FePS3 unit cell as a whole.

Figure 2. (a) Raman spectrum of FePS3 bulk sample obtained with an excitation wavelength of 532 nm and power ∼0.5 mW at 296 K. (b) Calculated phonon dispersion relations of FePS3.
Download figure:
Standard image High-resolution imageThe bulk FePS3 crystal belongs to C2/m symmetry group, which is expected to have 30 irreducible zone-center phonon modes denoted by Γ = 8Ag + 6Au + 7Bg + 9Bu, among which Ag and Bg are Raman active modes. The corresponding Raman tensors are [50]


To further explore the origin of all the Raman modes shown in the spectra, a first-principle study on the phonon dispersion was performed. As shown in figure 2(b), thirty branches were observed at the Γ point, in accordance with the number of modes in the C2h point group. After the normal modes were analyzed, the assignment of modes and frequencies were listed in table S2. The Raman modes observed at the high frequencies (>130 cm−1) in our experiment agree with the calculated branches at the Γ point within experimental accuracy.
When the temperature was decreased to 77 K, the high frequency Raman modes showed a blue shift due to the lattice contraction (table S1). However, the modes below 130 cm−1 changed dramatically with temperature (figure 3(a)): at 77 K, two strong and symmetric peaks located at 88 and 95 cm−1 were resolved in the antiferromagnetic phase whereas when the temperature was increased to 150 K, the two peaks disappeared accompanied by the appearance of a broad and asymmetric peak at around 100 cm−1 in the paramagnetic phase. As these Raman signals are related to the iron atom and vary in the different magnetic phases, we conclude that these phonon modes are strongly dependent on the magnetic properties of this material and the interaction between iron moments plays a crucial role in determining the low frequency part (<130 cm−1) of the Raman spectrum. To explore the origin of these spin-dependent Raman peaks, the corresponding phonon modes are expected to be found in phonon dispersion relations. However, no Raman modes are obtained from first-principle calculations in the frequency range of 0–130 cm−1 at the Γ point.

Figure 3. (a) Temperature-dependent Raman spectra of bulk FePS3 sample obtained with an excitation wavelength of 532 nm and power ∼0.5 mW around Néel temperature. The line shapes of fitting curves are Fano asymmetric and two-Lorentzian peaks above and below Néel temperature, respectively. (b) Plot of magnetic susceptibility of FePS3 bulk crystal versus temperature measured in (black) cooling and (red) heating process. The first derivation of susceptibility were shown in the inset whose inflection points are both around 118 K. (c) Temperature-dependent Raman spectra of mono-, tri- and five-layer FePS3 obtained with an excitation wavelength of 532 nm and power ∼0.5 mW.
Download figure:
Standard image High-resolution imageThis result suggests that the spin-dependent modes, including two spin-order-induced modes at 88, 95 cm−1 and a spin-disorder-induced mode at 100 cm−1, do not arise from lattice vibrations alone, but are instead, spin-related. To explore the origin of the spin-dependent Raman signals, a detailed temperature dependent study was performed around Néel temperature. As shown in figure 3(a), the intensity of the spin-order-induced Raman peaks located at 88 and 95 cm−1 decreased strongly near the Néel temperature. Above the Néel temperature of 118 K, these peaks disappeared completely and were replaced with a spin-disorder-induced Raman peak at about 100 cm−1. Magnetic susceptibility measurement of FePS3 bulk sample was carried out in the physical property measurement system (PPMS) apparatus (figure 3(b)). The first derivative of susceptibility curve indicates a transition temperature of ∼118 K—in agreement with previous studies [23, 30], as well as the transition temperature of Raman spectra. Besides that, the spin-order-induced Raman peaks broaden at around the Néel temperature without any shift in their frequencies. These observations exclude the hypothesis of one-magnon Raman scattering, because the magnon bands generally broaden and soften around the magnetic ordering temperature [51, 52]. The fact that spin-order-induced peaks totally disappear above Néel temperature is contrary to the behavior of two-magnon Raman scattering, which could persist at the temperature far above Néel temperature due to the presence of large regions with short-range antiferromagnetic-order [53]. According to previous studies, zone boundary phonons can be activated by magnetic superstructure under certain conditions [54, 55]. The lattice modes in the material mediates the exchange interaction and provide an additional term to the phonon Raman tensor, leading to the observation of the zone-boundary phonon modes in the Raman spectrum. The spin order of Fe atoms in FePS3 induces the magnetism and accompanying Raman modes variation in magnetic phase. However, from theoretical point of view, the magnetic fluctuations would increase when the dimension of system reduces, and affect the stability of spin, which is a main obstacle to fabricate the atomically thin magnetic device with high density data storage and retention time. Besides that, the superexchange will also be modified with the dimensional reduction of the system, due to the breaking of inversion symmetry or the modification of the electronic/lattice structure [56]. Therefore, it is significant to study the magnetism and spin properties in 2D system. Even so, as a 2D magnetic crystal, the related properties of FePS3 have not been studied in ultrathin samples before.
As we mentioned above, the spin-order-induced Raman signal at 88 cm−1, which reflects the ordered spin of iron atoms, can be treated as an ingenious 'probe' of the magnetic phase for mono- and few-layer FePS3 samples down to a few micrometers in size. As shown in the figures 3(c) and S7, the disappearance of the 88 cm−1 peak can be identified as a signature of magnetic phase transition from the antiferromagnetic to paramagnetic phase around Néel temperature. Figure 4(a) displays the integrated Raman intensity of 88 cm−1 mode as a function of temperature for various samples with thickness from bulk to monolayer. The intensity of Raman peak has been normalized in each sample to exclude the effect from interference among the flakes with different thickness. The 88 cm−1 Raman peak in the bulk sample completely disappears around 117 K, in good agreement with the susceptibility measurement considering the measurement accuracy. Therefore, a correlation between the magnetic phase transition and the disappearance of the 88 cm−1 Raman peak is identified. Following this correlation, the relationship between the phase transition temperature and the layer number was plotted in figure 4(b). As a general trend, the magnetic ordering temperature decreases as the layer number reduces. Moreover, the peak located at 88 cm−1 exhibited noticeable broadening, which indicates a coexistence of the paramagnetic and the antiferromagnetic phases around the Néel temperature. This result was proved in the previous report on the Mossbauer measurements [31]. The FWHMs of the 88 cm−1 peak in few-layer started to broaden at lower temperature, which also showed a slightly less magnetic stability, compared to the bulk sample (figure 4(c)).

Figure 4. (a) Plots of intensity of Raman peak at 88 cm−1 versus temperature of samples in different thickness. (b) Plot of Néel temperature (TN) measured by optical method versus thickness of samples, compared with the result of bulk sample measured by PPMS. (c) Plots of FWHM of Raman peak at 88 cm−1 versus temperature of trilayer and bulk samples.
Download figure:
Standard image High-resolution imageTo further understand the mechanism, we calculated the electronic structures and magnetic stability of FePS3 based on the van der Waals density functional (DFT-D2) and correlation from the Hubbard potential. The density functional theory was carried out with a full structural optimization using GGA [40, 45]. The electronic structures of paramagnetic, antiferromagnetic, and non-magnetic phases were calculated to determine the magnetic stability for both the bilayer and bulk FePS3. Antiferromagnetic phase is the most stable state with the lowest energy in both cases. With corrections from the GGA + U and DFT-D2 calculation, the energy required to undergo from the antiferromagnetic to the paramagnetic phase for bilayer sample was 848.2 meV f.u.−1, while that for bulk sample was 874.1 meV f.u.−1 (table S3). Therefore, the few-layer structure needs less energy for the magnetic transition, which results in the descending of Néel temperature from the bulk to the monolayer sample. In the thin layer case, the higher magnetic energy, which would leads to a lower Néel temperature, is attributed to the absence of long-range superexchange between the Fe atoms from adjacent layers. As a typical 2D Ising model, the magnetic order in FePS3 is mainly dominated by three in-plane magnetic exchanges (J1, J2 and J3). The superexchange along c-axis is much weaker compared with in-plane ones, but it indeed exists and contributes to a lower magnetic energy and higher Néel temperature in bulk case [56, 57]. However, the magnetic phase transition temperature increases ∼2.0 K in monolayer sample. The hardening of magnetism in monolayer is possibly caused by the various reasons, such as the modification of the electronic or lattice structure [56], which may need further investigations on both magnetic experiments and theoretical calculations.
The spin-dependent Raman spectroscopy provides us a special method to detect the magnetic structure of FePS3. Although the magnetic structure of FePS3 has been investigated for over three decades, it is still controversial. For instance, Le Flem et al proposed that the intra-layer spin moments are arranged ferromagnetically in chains, but are coupled antiferromagnetically with their neighboring chains (figure 5(a)). The planes were also coupled ferromagnetically along the c direction (figure 5(b)) [23]. However, Kurosawa et al reported that the ferromagnetic chains of Fe atom are rotated by 60° compared with Le Flem's model (figure 5(c)), while the planes were coupled antiferromagnetically along the c direction (figure 5(d)) [30].

Figure 5. Magnetic structure of FePS3 within the layer (a) and one fourth of the volume of the magnetic cell (b) proposed by Le Flem. For simplicity, only Fe atoms are plotted. The blue and red balls represent the Fe atoms with up- and down-spin, respectively. Magnetic structure of FePS3 within the layer (c) and the magnetic cell (d) proposed by Kurosawa.
Download figure:
Standard image High-resolution image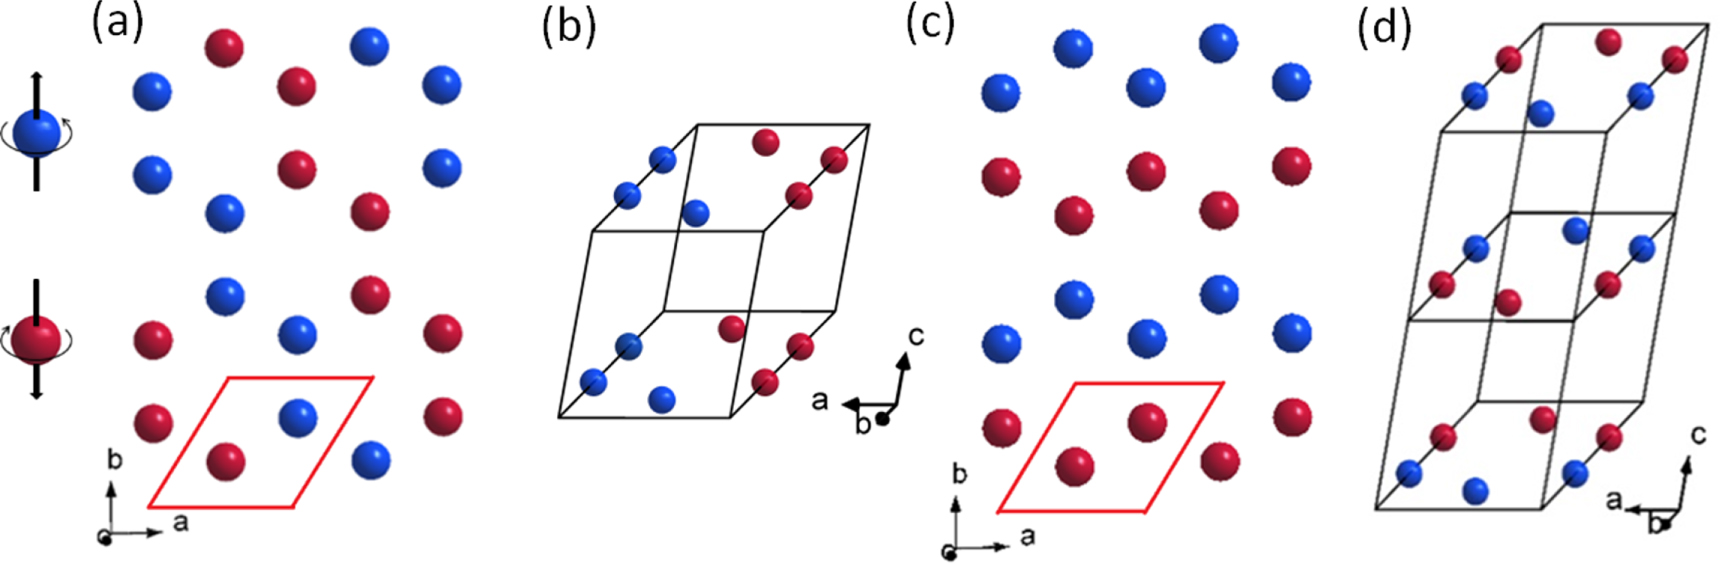
According to the explanation of a previous report, the changes in the spin-dependent Raman signal around the Néel temperature were due to Brillouin-zone folding caused by the magnetic cell doubling along the c axis [36]. This effect neglects the intra-layer interactions that determine the spin texture in the ab plane and is attributed to primarily the inter-layer interactions between the Fe spins, which can largely affect the magnetic property when sample is decreased to few-layer regime. However, it was also claimed that the Brillouin-zone folding could occur in ab plane [58]. Our Raman spectroscopy measurement on exfoliated few- to mono-layer FePS3 samples provided an opportunity to distinguish the intra-layer interaction from inter-layer one. The most striking result is exhibited by the spectrum of monolayer sample, where two pronounced peaks centered at 88 and 95 cm−1 are observed at 77 K. This result directly confirms the conjecture that the spin-order-induced Raman modes are attributed to the Brillouin-zone folding in ab plane, because monolayer FePS3 only has a layer of iron atoms, which is impossible to have double-sized magnetic cell along the c axis.
The spin–phonon coupling activates Raman scattering from selected phonon modes on other symmetric points induced by a modulation of the exchange interaction [59–61]. The additional peak appearing in the antiferromagnetic phase is attributed to the inelastic scattering from the zone-boundary phonons induced by the elastic magnetic scattering from the magnetic superstructure. However, only the modes providing a modulation of the spin–orbit coupling or the exchange interaction could activate spin-dependent phonon on Raman scattering [55]. From the calculated phonon dispersion curve shown in figure 2(b), two branches located at 86 and 95 cm−1 were found at the M point. In general, since the FePS3 magnetic cell is doubled within ab plane with respect to the crystallographic one, the Brillouin zone is halved in the reciprocal space. The inversion center of the magnetic cell in the antiferromagnetic phase is at the middle of two crystallographic cells, leading to the u mode on M point becoming g mode. As a consequence, the zone-boundary phonons at 88 and 95 cm−1 on M point are activated, leading to an observation of additional peaks in the Raman spectrum in the antiferromagnetic phase.
4. Conclusion
In conclusion, the layer-number dependent Raman spectroscopy of high quality atomically thin 2D magnetic materials FePS3 has been investigated for the first time to study the spin–phonon coupling and the magnetic property. With the thickness decreasing from bulk to monolayer, FePS3 exhibits the same magnetic transition from the antiferromagnetic to the ferromagnetic phase, which can be traced by the characteristic Raman active modes at ∼88 cm−1. This result suggests that intra-layer spin interaction dominates the magnetic structure of FePS3, leading to a magnetic persistence even in mono- and few-layer samples. Furthermore, the Néel temperature shows pronounced dependence on the layer number, suggesting that magnetic ordering even occurs in-plane at monolayer regime. Our work motivates further systematic studies on the 2D magnetic systems, which are significant for not only the potentially diverse applications in future ultrathin magnetic device, but also the fundamental understanding in physics of areas, such as nonlinear optics, magneto-optics and high-temperature superconductivity.
Acknowledgments
QX gratefully acknowledges the financial support from Singapore National Research Foundation via Investigatorship Award (NRF-NRFI2015-03), Singapore Ministry of Education via two Tier2 grants (MOE2012-T2-2-086 and MOE2013-T2-1-049) and two Tier1 grants (2013-T1-002-232 and 2015-T1-001-175). CK gratefully acknowledges the financial support from Tier1 grant (RG125/14). JZ acknowledges the support from the National Natural Science Foundation of China (grant no. 11574305 and no. 51527901), National Basic Research Program of China (grant no. 2016YFA0301200), National Young 1000 Talent Plan of China and LU JIAXI International team program supported by the K.C. Wong Education Foundation and CAS.