
Abstract
A combined scanning tunneling microscopy, x-ray photoelectron spectroscopy, angle-resolved photoemission spectroscopy, and density functional theory study of graphene on a Fe–Ir(111) alloy with variable Ir concentration is presented. Starting from an intercalated Fe layer between the graphene and Ir(111) surface we find that graphene–substrate interaction can be fine-tuned by Fe–Ir alloying at the interface. When a critical Ir-concentration close to 0.25 is reached in the Fe layer, the Dirac cone of graphene is largely restored and can thereafter be tuned across the Fermi level by further increasing the Ir content. Indeed, our study reveals an abrupt transition between a chemisorbed phase at small Ir concentrations and a physisorbed phase above the critical concentration. The latter phase is highly reminiscent of the graphene on the clean Ir(111) surface. Furthermore, the transition is accompanied by an inversion of the graphene's induced magnetization due to the coupling with the Fe atoms from antiferromagnetic when chemisorbed to weakly ferromagnetic in the physisorption regime, with spin polarizations whose magnitude may be tuned with the amount of Fe content.
Export citation and abstract BibTeX RIS

Original content from this work may be used under the terms of the Creative Commons Attribution 3.0 licence. Any further distribution of this work must maintain attribution to the author(s) and the title of the work, journal citation and DOI.
1. Introduction
Since the discovery that graphene (Gr), the two dimensional carbon allotrope, can be isolated and incorporated into electronic devices [1] intense research efforts have been triggered. Driving forces behind the experimental and theoretical studies of Gr are, e.g., the exceptional electronic properties, in particular the high electron mobilities, the long spin coherence lengths [2] and the possibility to access exciting physical effects such as the integer quantum Hall effect or Klein tunneling. These effects arise due to the relativistic behavior of electrons near the Dirac point (DP), where the band structure of Gr is characterized by a linear dispersion [3]. While the DP is a direct consequence of the topology of the honeycomb lattice of Gr, it may be severely altered or completely destroyed when Gr is interfaced with another material [4]. A Gr–metal interface can be classified as either a strongly or weakly interacting one. The two scenarios can be rationalized in terms of hybridization between the Dirac cones (DC) and metal bands [5]. In the case of strong interaction, the linear dispersion is either removed or strongly altered due to a substantial hybridization between localized d-states and Gr's π-bands. Such effect is observed, for example, in Gr on Ni [6, 7], Co [7–11], and Fe [12, 13]. By contrast, in the case of weak interaction, the DP is only shifted with respect to the Fermi level of the metal leading to an effective n-type or p-type doping of Gr, as observed, for example in Gr on Au [14, 15], Cu [16–18] or Ag [19]. Similar physisorption regimes are also found for Gr on Pt [20, 21], Ir [22, 23] or Pd [24], where, despite the weak hybridization with metallic d states near the DP, the DCs are largely preserved and the characteristic linear dispersion is observed [20, 22]. As a rule of thumb, in the weakly interacting (physisorbed) regime Gr is hardly corrugated and resides at a large distance from the metal (∼3 Å) while in the strongly interacting case this distance is reduced by around 1 Å.
Among the above mentioned systems, the interface between Gr and a 3d ferromagnetic (FM) substrate, Gr/FM, has been extensively studied due to Gr's well recognized potential in the generation of spintronic devices [2]. These interfaces are characterized by a substantial magnetization induced in Gr together with a strong charge transfer from the FM surface to Gr. As a consequence, Gr shifts its (proximity induced) exchange-splitted π-band towards higher binding energies, while its strong hybridization with the 3d bands tends to destroy the DCs [25].
However, refinements occur due to dynamic hybridization effects: when one spin component of the DP falls in surface projected bulk band-gaps, half cones, i.e. one spin component of the DC, are reported at a binding energy (BE) of 2.6 eV in the minority channel for Gr on Co(0001) and Ni(111) [7, 11]. Additionally, spin-polarized Dirac-like mini cones are observed close to the Fermi level in the majority channel [10, 11]. In particular the mini cones are characterized by a strong metal weight and present very reduced Fermi velocities.
Nevertheless, such subtleties in the electronic structure strongly depend on the actual Gr's adsorption geometry, like the formation of a moiré pattern versus a well oriented (1 × 1) structure or the precise stacking of the C atoms relative to the topmost layer atoms, which dictates the rupture of the sublattice symmetry and possible gap openings.
In view of the technological interest of Gr/FM interfaces, it is desirable to design a robust route to decouple Gr from the FM surface in a continuous way, thus, enabling to fine tune the magnetic properties induced in the Gr layer as well as the doping level and magnitude of the hybridization gap.
In this sense, it can be conjectured that an appropriate mixture of strongly and weakly interacting metals will allow a precise control of the Gr–substrate hybridization. Indeed, bi-metallic surface alloys of Ni–Sn [26], Ni–Al [26, 27], and Ni–Si [28] formed in-between the Gr and the Ni(111) substrate were demonstrated to strongly modify the bonding of the Gr upon alloy formation. However, based on ab initio studies [29, 30], the coexistence on the same surface of a Gr chemisorbed stable minimum and a metastable physisorbed one has been anticipated even for the Gr/Ni(111) system alone. Experimentally, physisorption to chemisorption transitions have also been envisaged after intercalation of a FM film between the Gr and the substrate in different systems: Gr/Fe/Pt(111) [12], Gr/Co/Ir(111) [8] or Gr/Ni/Ir(111) [6]. Inversely, the strong Gr–FM hybridization was successfully removed by Au intercalation at the Gr/Ni(111) interface [14]. Despite these efforts a highly desirable correlation between the amount of alloyed material and the changes in the Gr electronic properties has not been attempted so far.
Furthermore, the use of surface alloys for Gr–substrate adhesion [31] and improved Gr growth [32] has been explored. In fact, the Gr layer itself was shown to have profound influence on the kinetics and activation barriers of alloy formation [33]. Thus, Gr may potentially open a route toward stabilizing new interface alloy compositions such as highly Ir diluted γ Fe. In bulk systems γ Fe was seen to undergo a phase transition into α Fe for Ir concentrations above 0.225 [34]. Generally, the interface between Gr and Fe in the fcc(111) plane has been scarcely studied [12, 35, 36] compared to the wealth of works reported for Gr on Ni(111) and Co(0001) [7, 8, 10, 11, 25, 29, 30, 36–40] .
Here, we trace the structural, chemical and electronic properties of a Gr layer during Fe and Ir intermixing at the Gr/Ir–Fe/Ir(111) interface obtained after intercalating one Fe monolayer (ML) between the Gr and the Ir surface. We follow a multitechnique approach employing scanning tunneling microscopy (STM), low energy electron diffraction (LEED), x-ray photoelectron spectroscopy (XPS), angle-resolved photoemission spectroscopy (ARPES), and first principles density functional theory (DFT) calculations to demonstrate that Ir atoms begin to alloy with the Fe layer already at relatively moderate annealing temperatures of about 650 K and, notably, the amount of alloyed material can be precisely tuned by gradually raising the temperature up to 1000 K. At a critical Ir concentration of around 0.25 a transition in the Gr layer from chemisorption to physisorption takes place, which is accompanied by severe changes in the structural, electronic and magnetic properties of the Gr. Although the transition is abrupt, we are still able to tune the Gr's doping level in the physisorbed phase by further increasing the Ir content.
2. Results and discussion
We have grown Gr on Ir(111) following standard procedures [22]. Afterwards, the intercalation of about one monolayer of Fe between Gr and the Ir(111) substrate was achieved by depositing Fe onto the surface at a temperature of about 600 K (see SI #1 for additional experimental details). The Gr/Fe/Ir(111) samples were post-annealed to increasingly higher temperature. In a first set of experiments, the evolution of the C 1s, Fe 2p, and Ir 4f core levels was characterized as a function of annealing time and temperature by XPS. These XP spectra were used to gauge the Fe concentration at the interface Fe–Ir top most layer, as described in the next section. In a second set of experiments, samples were prepared under identical conditions for STM imaging. In this way, we could obtain a local characterization of the system at different Fe concentrations and, therefore, also achieve a first insight into the structural changes at the Fe–Ir interface. The last set of experiments was again performed on samples prepared under nominally the same conditions and characterization was done by LEED and ARPES to directly access the valence band of Gr in contact with the various Fe–Ir interfaces. Finally, the experimental findings were compared (and interpreted) with first principles DFT calculations of both the geometric and electronic structure of the Gr/Fe–Ir/Ir(111) system.
2.1. XPS of Gr/Fe/Ir(111) as a function of post-annealing temperature
The waterfall plots in figure 1(a) demonstrate that the Fe 2p core level intensity decreases above annealing temperatures of 650 K (details of the temperature dependent measurements can be found in the supplementary information (SI)), while the C 1s (Ir 4f ) intensity remains rather constant up to about 1000 K. At higher annealing temperatures the C 1s (Ir 4f ) intensity decreases (increases) suggesting the rupture of C–C bonds and the eventual desorption or absorption of carbon atoms. For moderate annealing temperatures the decrease in Fe 2p intensity indicates a gradual removal of Fe atoms from the topmost layer but with the Gr layer still preserved on top. In the following, we quantify the integrated photoemission intensity (I) of the Fe 2p core level with respect to the as-prepared Gr/Fe/Ir(111) sample and the determined Fe coverage as deduced from STM images. Specifically, we define the relative intensity (Ir) for a given post-annealing step as ( ). Furthermore, we tentatively assign
  to quantify the dilution of the Fe layer by Ir following the nomenclature Gr/Fe
 Irx/Ir(111). Note that in this nomenclature x = 0 corresponds to Gr/1 ML Fe/Ir(111) and x = 1 corresponds to Gr/Ir(111), respectively. We estimate that the error of the assignment in x is of the order of 0.1 (see SI appendix A.3 for additional information). The evolutions of x and
  are plotted as a function of annealing temperature in figure 1(b).
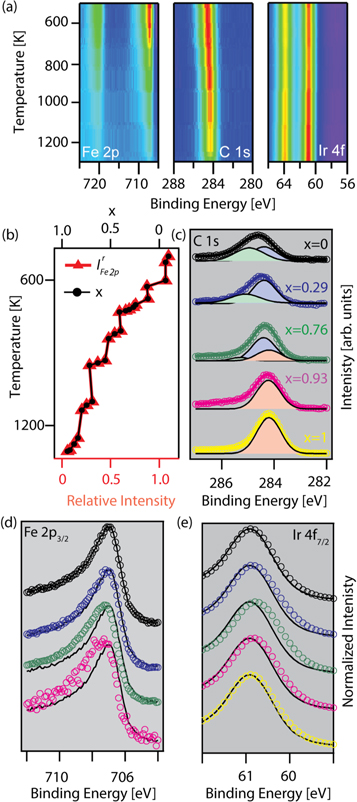
Figure 1. XPS characterization of Gr/Fe Irx/Ir(111) as a function of post-annealing temperature: waterfall plots of the Fe 2p, C 1s and Ir 4f levels (a), the value of
  of the relative integrated Fe 2p (
 ) core level intensity (b), and detailed spectra of the C 1s (c), Fe 2p (d), and Ir 4f (e) for selected x are presented. In (d) and (e) the black trace corresponds to the XP spectrum of x = 0 and has been plotted for all other x (color coded markers) to visualize the slight shift of the respective core levels. Spectra in (c)–(e) have been vertically offset for clarity.
Download figure:
Standard image High-resolution imageThe influence of intercalated Fe on the Gr layer is best visualized by deconvolution of the C 1s core level for various x: the C 1s level for x = 1 (figure 1(c), yellow trace) is characterized by a single spectral feature (light red area) at about 284.4 eV. The spectral feature observed for x = 0 (black trace) appears broader and shifted towards higher BE. It may be deconvoluted into two components at BEs of 286.2 eV (green shaded area) and 285.3 eV (blue shaded area), respectively. Upon annealing above a moderate temperature of about 700 K the XPS lineshape for x = 0.29 (blue trace) has become more asymmetric and is shifted slightly toward lower BE again. When using the same deconvolution as for x = 0 a substantial increase in intensity of the lower BE feature (blue area) over the higher BE (green area) one is apparent. Annealing at even higher temperatures close to 950 K (green trace) leads to an x = 0.76 sample which shows a further shift of the C 1s core level features toward lower BE. Now, we deconvolute the observed spectral shape with the three components introduced before: the low BE component (light red area, appearing in the x = 1 sample), together with the high and intermediate BE features (green and blue areas, respectively). Annealing at temperatures above 1200 K leads to an x = 0.93 sample where the C 1s line shape (magenta trace) is no longer distinguishable from that in the x = 1 case (yellow trace).
We assign the three features of the C 1s level as follows. The single feature observed for sample x = 1 stems from the chemically equivalent sp2 bonded C atoms in the Gr layer while the absence of any further components reflects the weak interaction between Gr and the Ir substrate which is primarily of van der Waals type, in agreement with literature [41–43]. Indeed, the subtle chemical modulation within the moiré unit cell was not observed to modify the XPS line shape for this system [41]. In contrast, other components in the XP spectrum appear at higher BE as the Fe concentration increases, i.e., when the Gr layer interacts strongly with a ferromagnetic 3d metal. The energy shift towards higher BE with respect to the previous peak is substantial and has also been observed for Gr/Ni(111) [44].
However, in our case under study the interaction with the substrate is further modulated as a consequence of substantial lattice-mismatch between Gr and the metal support, as it is the case for, e.g. Gr/Ru(0001) [42, 45], Gr/Rh(111) [42, 44], Gr/Ni/Ir(111) [6], and Gr/Co/Ir(111) [9, 46], the consequence being the observation of a double peak in XPS. This structure is attributed to the superposition of strongly and weakly interacting areas [42, 44] of the Gr. Therefore, in complete agreement with previous works [8, 35, 36] and our STM observations (see below), we assign the green feature to the strongly interacting valley parts of the Gr/Fe/Ir(111) moiré unit cell and the blue feature to the weakly interacting hills, respectively. Interestingly, we note qualitative similarities between the changes in the C 1s core level observed here with previous reports upon alloying below Gr for Gr/Ni–Si/Ni(111) [28] and Gr/Ni–Al/Ni(111) [27] systems.
The resolution of the normalized Fe  (figure 1(d)) and normalized Ir 4f7/2 (figure 1(e)) levels does not allow for an unambiguous deconvolution. However, compared to the x = 0 spectrum, which we plot as a guide to the eye as the black trace for each value of x, we clearly resolve a shift of the Fe 2p (Ir 4f) core level as a function of x toward higher (lower) BE up to x = 0.76. Indeed, such chemical shifts in the Fe 2p and Ir 4f level, respectively, can be interpreted as a successive oxidation of the Fe atoms accompanied by a successive reduction of Ir atoms with increasing x. Thus, we tentatively assign the origin of the chemical shifts to alloying of Fe and Ir below the Gr layer. This in turn drives the chemisorption to physisorption transition in Gr as inferred from the evolution of the C
  line shapes with x.
2.2. Structural characterization by STM
In the previous section we have put forth the hypothesis that Fe–Ir alloying drives a transition from chemisorption to physisorption in the Gr. To corroborate this hypothesis, we have performed STM measurements on samples for various x. A typical STM image of Gr on Ir(111) (x = 1) is shown in figure 2(d). Gr on Ir exhibits a hexagonal moiré pattern with a periodicity of about 2.5 nm [47] due to the lattice mismatch between Gr and Ir. It leads to a supercell consisting of about (10 × 10) C atoms per (9 × 9) Ir atoms. The corrugation of about 25 pm (see line profile in figure 2(e), yellow trace) reflects the existence of different regions within the supercell, which are known to slightly differ in chemical reactivity [41, 48]. Upon intercalation of slightly more than a ML of Fe (x = 0 sample), the moiré pattern exhibits the same periodicity of 2.5 nm as is evident in figure 2(a) and, thus, reflects the pseudomorphic growth of the Fe layer with respect to the Ir(111) surface. Intercalated second layer Fe islands are distinguished by their triangular shape. Note, however, that the corrugation within the moiré cell now amounts to about 100 pm (black trace in figure 2(e)). This substantial increase in corrugation is in complete agreement with previous reports [8, 35, 36, 49] and is due to the local enhancement of the p–d interactions [8, 50] in valley regions of the moiré lattice.
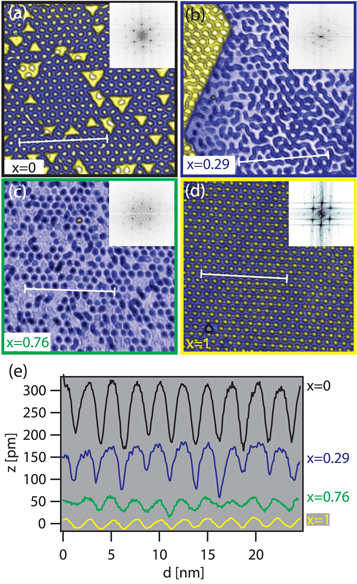
Figure 2. STM topographs of Gr/Fe Irx/Ir(111). Close to 1 ML of Fe intercalated between Gr and Ir (x = 0, (a)), ∼1 ML of Fe intercalated and post annealed at about 700 K (x = 0.29, (b)), ∼1 ML of Fe intercalated and post annealed above 950 K (x = 0.76, (c)), and pristine Gr on Ir (x = 1, (d)). Fast Fourier transformations of (a)–(d) are given in the respective insets and demonstrate that the Gr/Ir moirè pattern stays intact. Line profiles along the indicated white lines in (a)–(d) are given in (e).
Download figure:
Standard image High-resolution imageWhen post-annealing such a surface at a temperature close to 700 K for 15 min significant changes become visible in the STM data (x = 0.29 figure 2(b)): small second layer Fe islands have coalesced into much bigger islands and the moiré pattern of the first layer appears more diffuse and with less structural coherence. Interestingly, the moiré pattern of the second layer appears largely intact suggesting that the origin of changes is the Fe–Ir interface rather than the Gr–Fe one. A closer look at the corrugation of the Gr layer (blue trace in figure 2(e)) reveals values between 40 and 100 pm. A similar change in appearance was observed previously in low temperature STM data [36] but its origin could only be speculated upon. We propose that the change in apparent height is a consequence of the dilution of the Fe layer by Ir atoms.
After annealing close to 950 K for an hour the STM image (figure 2(c)) of sample x = 0.76 shows no more second layer Fe islands and the corrugation of the Gr layer amounts to about 30 pm (green trace in figure 2(e)) i.e., close to that for the x = 1 sample and in line with the assumption that Fe atoms dilute into the Ir layers as the temperature increases until there are only few left in the topmost layers.
2.3. Valence band structure as determined by ARPES
The chemical and structural characterization given above in previous sections strongly suggests a tuning of the Gr properties from strongly to weakly interacting regimes, although the electronic properties at the interface cannot be directly inferred. In order to assess the electronic band structure we use ARPES. First, we have probed the full valence band along the  –
– direction schematically depicted in figure 3(b). The results are summarized in figure 3(a).
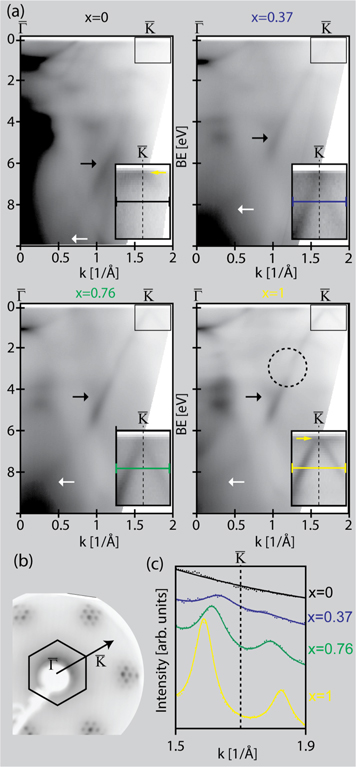
Figure 3. ARPES of the valence band (VB) of Gr/Fe Irx/Ir(111) along the
  –
– direction (a). The insets show high resolution scans near the Gr
  -point (marked by rectangle). The measurement direction is illustrated in (b). Momentum distribution curves (MDCs) were taken at BE
  along the direction indicated by the color coded lines in the insets of (a) and are displayed in (c). Several features are marked for detailed discussion in the text.
Download figure:
Standard image High-resolution imageFor the x = 1 sample (figure 3(a), bottom right panel), which we have measured as a reference, the Gr's π-band can be traced from its bottom (white arrow close to the  -point) to the top, with the DP located (after extrapolation) slightly above the Fermi energy (EF).
High resolution data (see inset) taken near the  -point shows also the Ir-derived surface state [22, 51] (marked by the yellow arrow in the inset of figure 3(a), bottom right panel) that is situated at the Fermi energy. Note that at a photon energy of 21.22 eV this surface state has a high intensity, while another Ir-surface state, situated at the
  -point [52] has low intensity and is therefore hard to discern in figure 3(a) (see SI figure A1 for higher resolution data). Furthermore, we note the existence of an area of particularly high photoemission intensity of the Gr π-band at a wave vector around
  Å−1 and energy BE
  (horizontal black arrow) as well as the previously reported [23] gap at BE
  which opens due to hybridization with the Ir 5d states (dashed circle).
In comparison, the photoemission data for about one ML of Fe intercalated between Gr and Ir (x = 0, top left panel in figure 3(a)) looks very different. In particular, no traces of a DC near the expected DP are resolved (see inset). Remaining intensity at the Fermi energy (yellow arrow in the inset) and clearly visible in the corresponding Fermi surface (see SI figure A4), suggests that it originates from the same Ir derived surface state observed for x = 1 and not from Gr. Indeed, traces of the π-band can only easily be identified at the same k-region of increased photoemission intensity as for the x = 1 sample (marked by a horizontal black arrow) but now located at BE  , indicating a large 2 eV shift of the π-band towards higher BEs.
Upon annealing the sample to about 750 K for 10 minutes drastic changes are again visible: for sample x = 0.37 (figure 3(a), top right panel) the entire π-band is fully restored, although significantly broadened compared to the x = 1 case. The broadening can be conveniently gauged by the momentum distribution curves (MDCs) taken at BE  and displayed in figure 3(c). A closer inspection of the DP (inset of figure 3(a), top right panel) indicates that the top of the band is below EF. This assignment is further substantiated by the iso-energy surface analysis shown in SI figure A4. However, due to the additional intensity arising from the Ir-derived surface state it is difficult to assess if the DC is n-doped or, conversely, a gap has opened at the DP. Photoemission data for the sample x = 0.76, which was annealed close to 950 K (figure 3(a), bottom left panel), clearly shows additional enhancement of the photoemission intensity from the Gr's π-band. The DC at the
  -point now presents an almost linear dispersion and extrapolation yields a position of the DP precisely at EF.
Overall, a clear trend is seen in high resolution scans of the  -point and the MDCs: upon restoration of the DP, a successive opening of the DC takes place as x increases suggesting a change from n to p-type doping.
Given the aforementioned difficulties for a precise determination of the DP, we have performed a second set of measurements along the  –
– direction, the results of which are depicted in figure 4. This k-direction allows for a more precise characterization of the evolution of the Gr's π-band as a function of x, since the band maximum (BM) around the
  -point (indicated by the horizontal black arrow in figure 4(a)) can be nicely resolved in all experimental stages. Hence, its position can be more accurately determined than the DP. The BM was determined by fitting Lorentzians (see SI figure A3 for the complete fit results) to the photoemission intensity in the corresponding energy distribution curve (EDC) at the
  -point. The results of the fit (solid lines) are superimposed on the experimental data (dotted lines) in figure 4(b)).

Figure 4. ARPES of the valence band (VB) of Gr/Fe Irx/Ir(111) along the
  –
– direction (a). Energy distribution curves (EDCs) are taken along the color coded lines in (a) and are displayed in (b).
Download figure:
Standard image High-resolution imageThe most salient feature in the plots is the 1.8 eV jump that the BM experiences upon increasing the Ir concentration from x = 0 to x = 0.29 (BE = 4.8 and 3.0 eV, respectively) which confirms the large π-band shift inferred from the  –
– analysis. As x is further increased with successive post-annealing, the BM continues to shift gradually further up in energy until it reaches a value of about
  for x = 0.76, which correlates nicely with the position found for the x = 1 sample (also included in the figure) located 2.7 eV below EF, in reasonable agreement with previous work [53]. This gentle shift further substantiates our assignment of a change in the Gr's doping from n to p-type.
2.4. Comparison with first principles calculations and further discussion
The experimental analysis presented above demonstrates that we may tune the Fe Irx alloy ratio at the metal surface by intercalating Fe atoms between the Gr layer and the Ir(111) surface and subsequent annealing to successively higher temperatures. Most notably, at a critical concentration of
  a sudden shift of the Gr's π-band is found. Such a shift, together with the C 1s XPS core level analysis and the corrugation changes seen in the STM, may be tentatively assigned to a chemisorption to physisorption transition. In order to confirm that this is indeed the case, as well as to understand its origin, we have performed extensive DFT calculations, described in this section.
2.4.1. Theoretical model
The experimental  moiré pattern of Gr/Fe/Ir contain a very large number of atoms, which even for few Ir layers is computationally extremely demanding. Therefore, we have employed instead a simplified and computationally lighter model, by assuming a (4 × 4)/(
 )
)  periodic supercell. This model yields commensurability between the Gr and the Ir lattices by a slight (0.5%) compressive strain of the Gr lattice. This supercell, denoted as (4 × 4) hereafter, contains 32 C and 13 metal atoms per layer. We constructed Ir(111) oriented slabs, on top of which we placed the Gr layer (see figure 5). The Fe/Ir alloying was simulated by considering a Fe
 Irx topmost layer after randomly replacing Ir atoms by Fe atoms. Our choice of supercell provides us with 13 different possible Ir/Fe ratios, x. However, as it will become clear below, it was enough to consider the following nine values for the ratio: x = 0.00, 0.07, 0.15, 0.23, 0.31, 0.38, 0.46, 0.54 and 1.00, thus covering the Fe-rich conditions and the pristine Ir case.
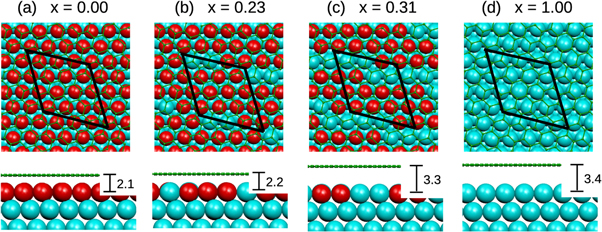
Figure 5. Top and side views of the optimized Gr on Fe Irx/Ir(111) structures for several Ir first layer concentrations, x. Red, cyan and small green balls correspond to Fe, Ir and C atoms, respectively. The Gr/Ir(111) (4 × 4)/(
 )
)  commensurate supercell is indicated by the black parallelogram. The average distance between the Gr and the first metal layer,
  , is shown in Å in the side views.
Download figure:
Standard image High-resolution imageThe use of a reduced (4 × 4) cell may be viewed as a somewhat crude approximation to simulate different local Gr environments (hills and valleys) which are known to coexist within the large moiré pattern [36, 41]. It is nevertheless large enough to account for different registries of the C atoms with respect to the metal substrate, including (close to) high-symmetry top, hcp, fcc and bridge sites within the same cell. Moreover, during the relaxations the Gr was treated as a rigid unbuckled (1 × 1) layer in order to allow the unfolding of its projected band structure and, thus, a one to one comparison with ARPES data. The reasonably good agreement achieved with the ARPES data (see below) justifies our approach.
Further details of the DFT-based calculation as well as results for Gr unconstrained relaxations can be found in the theoretical details and SI appendix D, respectively.
2.4.2. Energetics and geometries
In figure 6(a) profiles of the adsorption energy versus the Gr–metal distance, zGr–M, for Ir concentrations of x = 0, 0.23, 0.31, and 0.38 are displayed. For small x, and similar to theoretical predictions for Gr/Ni(111) [29] , we find the coexistence of a weakly chemisorbed phase ( 2.2 Å) and a physisorbed one (
 3.3 Å) depending on the initial Gr height used in the relaxations. The physisorbed regime, being mainly driven by the van der Waals (vdW) interaction, is characterized by a shallow minimum that attains a value of ∼0.14 eV/C over the entire
  range. By contrast, in the chemisorbed case, we find a deep minimum at x = 0 with a larger adsorption energy of 0.25 eV/C, although it progressively decreases until x = 0.38, where the minimum no longer exists. The energy barrier (see theoretical details) associated with the chemisorption to physisorption transition decreases from 0.10 over 0.03 to just 0.01 eV/C for Ir contents of 0, 0.23, and 0.31, respectively. Note that the chemisorbed phase for x = 0.31, albeit still being a local minimum, becomes energetically less favorable than the physisorbed one. This is best seen in figure 6(b), where we display the difference in adsorption energies between the two adsorption minima as a function of x, showing that the transition from the chemisorbed to the physisorbed phase occurs at x = 0.3. It is worth to note, however, that the precise critical concentration will depend on the particular approach employed for the vdW interactions, and we estimate an error in a range similar to the experimental one, i.e. of the order of 0.1. Interestingly, the difference in adsorption height between the two phases (shown in figure 6(c)) as a function of x correlates nicely with the corrugation observed with STM (compare figure 2) and further justifies our local (4 × 4) theoretical model which seems to capture both the chemisorbed as well as physisorbed areas of the large experimental unit cell. We also note that, as can be visualized for e.g. x = 0.23 in figure 5, in the Fe rich alloys the diluted Ir atoms are unusually close to the Gr layer, something that is expected to induce exchange fields in the Gr layer due to the proximity of Fe and Ir atoms.

Figure 6. (a) Gr adsorption energy, Eads, as a function of the average adsorption height  , for several first layer Ir concentrations x (see legend). (b) Difference in adsorption energies among the chemisorption and physisorption phases as a function of x. The blue arrow indicates the ∼0.1 uncertainty on the critical concentration xcrit at which the transition between the two adsorption regimes occurs. (c) Average adsorption height
  of the Gr on the Ir(111)/FexIr
  − (4 × 4) surface as a function of x. Dark (gray) solid lines correspond to the chemisorbed (physisorbed) phase.
Download figure:
Standard image High-resolution image2.4.3. Band structures
The spin resolved Gr projected band structures along the Gr-
 –
– –
– direction corresponding to the most stable phases at each concentration x are displayed in figure 7 in the form of PDOS(
 ) maps after unfolding those computed for the (4×4) supercell (the latter shown in the SI figure B1 including the projections on the metal atoms). In each map we merged the majority (
 ) and minority (
 ) spin contributions after employing red and blue colors for each component, respectively (in case of spin degenerate bands both colors merge as dark features). For Gr chemisorbed (
 ) the DCs are almost completely destroyed—the typical situation for a strong Gr–metal interaction. Furthermore, given the large substrate-induced spin-splitting, both spin components show marked differences specially around EF: in the
  bands (red) only traces of the DCs with large gaps of a few eV can be recognized at the
  -point, while in the
  projections (blue), and although slightly distorted, the π-bands can be resolved around
  , with an ∼200 meV gapped DP located at a high BE of almost 3 eV. All these features are reminiscent of previous spin resolved band structures calculated for other Gr/FM systems [10, 11]. As x increases there is an overall blurring of the bands (see also SI figure B1) as a result of the large overlap between the C and Ir atoms at such unusually small distances but, otherwise, the bands do not experience any significant shifts. In contrast, the physisorption configuration reveals almost intact DCs and only a very reduced spin-splitting of the bands. The largest value of this splitting is 100 meV at the
  -point band maximum and less than 80 meV at the π-band dispersive regions but only where traces of certain hybridization are visible. The weak Gr–metal interaction leaves the DP close to the Fermi energy, with moderate dopings which evolve from n-type at low Ir concentrations to p-type in pure Gr/Ir, in perfect agreement with the experimental trends.

Figure 7. Spin-resolved PDOS( ) maps for the Gr/Fe
 Irx/Ir(111) semi-infinite surface system projected on Gr after k-unfolding along the
  –
– –
– paths of the Gr-(1 × 1) primitive BZ. Red/blue colors represent spin majority/minority components. For the pure Gr/Ir(111) case (x = 1), the system is non-magnetic and hence the bands are spin degenerate. For each Fe/Ir ratio x, we present results for the most stable Gr adsorption phase (chemisorbed for
  and physisorbed for
  ).
).
Download figure:
Standard image High-resolution imageA visual comparison of the calculated Gr band structures versus the ARPES data is given in figures 8(a)–(d), while in panel (e) the evolution of the π-band energy location versus x both at the  and
and  points in the two adsorption regimes is plotted against the experimental values as determined from various measurements on different samples (see also SI table A2 and table A3). Apart from a systematic slight underestimation of the π-bandwidth, which may be ascribed to the well-known DFT deficiencies [53, 54], as well as the fact that neither the bottom of the band at
  nor the DP at
  are easily identified in the experiment for the chemisorbed phases, the overall theory-experiment agreement is very satisfying. This fact again confirms the validity of the (4 × 4) rigid Gr model employed, as well as the Fe/Ir alloying at the surface that was already inferred from the experimental data. The plots also reveal an overall decrease in BE of the band offsets for all cases as the Fe concentration increases, which may be assigned to a stronger Gr–Fe interaction as compared to that for Gr–Ir. Most notably, upon chemisorption the Gr π-bands undergo a strong (∼2.2 eV) shift towards higher binding energies in good agreement with the ARPES data. Indeed, such an abrupt shift in the binding energies constitutes a robust fingerprint of the Gr physisorption-chemisorption transition.

Figure 8. (a)–(d) experimental ARPES data from figure 3 and figure 4 plotted as second derivative and superimposed with calculated band structures for selected x. Blue and red bands denote spin-down and spin-up components, respectively. (e) Binding energy (BE) of the top of the π band at the  point (left panel) and of the Dirac cone (doping) at the
  point (right panel) for all calculated concentrations, x. Red/blue lines correspond to the chemisorption / physisorption regimes, and black symbols show the experimental values inferred from a collection of several independent ARPES measurements (see SI table A2 and A3). Gray double arrows indicate the abrupt rise in the BEs associated to the chemisorption to physisorption transition. We note that whereas for Gr physisorbed the calculated bands are sharp and their energy position can be accurately determined, in the case of chemisorbed Gr they are broad due to the hybridization with the metal and their location cannot be unambiguously identified—the associated uncertainties are of several hundreds of meV.
Download figure:
Standard image High-resolution image2.4.4. Origin of the destabilization of the chemisorbed phase
The evolution of the net atomic charges in the first surface layers (as obtained from a Mulliken population analysis) is shown in figure 9(a) as a function of x and for both Gr adsorption regimes. In the chemisorption regime (left panel) there is a considerable ( per unit cell, i.e.
  per C-atom) electron transfer from the metal (mainly from Fe atoms) to the Gr, leaving the latter negatively charged. The Fe atoms also transfer a substantial amount of charge to the Ir layer below (Ir2), while the iridium atoms within the Fe layer (Ir1) remain essentially neutral. Interestingly, all net charges remain fairly constant with x, which implies that in the case of Fe each atom donates more electrons as its concentration is reduced (i.e. it becomes more ionized).
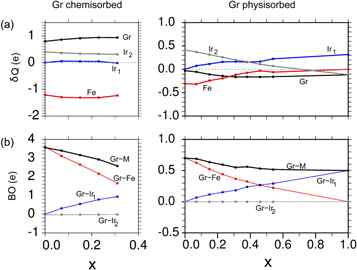
Figure 9. (a) Mulliken net charges on the Gr, the Fe and the first and second Ir layers (Ir1 and Ir2, respectively) as a function of x. (b) Bond orders (BOs) between the Gr and the metal atoms. Left panels correspond to Gr chemisorbed and right panels to Gr physisorbed.
Download figure:
Standard image High-resolution imageThe evolution of the bond order (BO) between the C atoms in the Gr layer and the Fe–Ir atoms at the two top most metal surface layers is displayed in (b). The BOs provide a qualitative measure of the charge shared between two species or, equivalently, their bonding character. The plot shows that the total BO between the Gr and the metal decays with increasing x because the Gr–Fe contribution decays faster than the increase of the Gr–Ir1 contribution. This weakening of the Gr–M bonding together with the high ionization state of the Fe atoms and the Gr may be considered as the main sources of destabilization of the chemisorbed phase.
A completely different picture arises in the physisorption case: the Gr layer is neutral at x = 0 but with increasing Ir1 concentration it donates a small amount of charge ( ) to the metal surface while the Fe atoms transfer electrons to the Ir atoms at small x (mainly to the Ir2) and become almost neutral for
  . The BOs follow a similar behavior as in the chemisorbed case but with a much smaller Fe–Gr contribution due to their reduced overlap—we recall that the stability of the physisorbed phase is mainly due to the vdWs interactions.
2.4.5. Magnetic structure
Here, one should bear in mind, that the Fe monolayer on Ir(111) exhibits a complex non-collinear spin configuration [55] clearly beyond our model. However, experimental and theoretical evidence suggests that the same Fe layer becomes ferromagnetic when covered by a Gr layer [8, 35]. Therefore, in a first approximation, we assumed in our model that all Fe atoms are ferromagnetically coupled and we disregarded any spin–orbit coupling (SOC).
Inspection of the magnetic moments (MMs), shown in figure 10, also reveals a different Gr response to the metal's magnetization depending on the adsorption regime. When chemisorbed, relatively large MMs are induced in the Gr (up to 0.9 μB per unit cell, i.e. about 0.03 μB per C atom, at x = 0), always in opposite direction to those of the iron atoms (antiferromagnetic (AF) coupling). Nevertheless, the Fe magnetization decays rapidly with x, as so does that of the Gr as the number of Fe atoms decreases. Note, however, that the MM per Fe atom increases (from 2.6 to 2.9 μB), in line with an earlier nuclear gamma resonance study of Fe–Ir bulk alloys [34]. When physisorbed the Gr layer now couples ferromagnetically to the Fe atoms, although as expected, the induced MM is much smaller ( ) and already vanishes for
  . The Fe magnetization behaves similarly as in the previous regime, but it attains 5%–10% larger values. Finally, the Ir atoms also reverse their induced magnetization from FM when chemisorbed to AF when physisorbed. In the latter case it is surprising that its net MM increases with Ir concentration at least up to x = 0.54, since it ultimately vanishes for the Gr/Ir clean case. As revealed in the magnetization densities plots shown in the SI #3 (figure C1), the induced spin polarization is not evenly distributed throughout the Gr layer. Instead, those C atoms that reside above Fe rich areas always tend to show larger magnetizations with a well defined pz character (i.e. it is the π-band which holds all the spin). Furthermore, in the chemisorbed (physisorbed) cases the largest MMs are found for carbons located at top (hollow) sites.
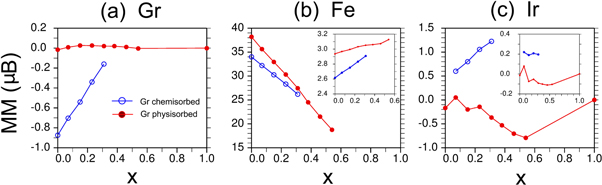
Figure 10. Total magnetic moments, MMs, projected on the (a) Gr, (b) Fe atoms and (c) all Ir atoms in the first and second layer (Ir1 and Ir2) as a function of the Ir1 concentration, x and for the Gr chemisorbed (blue) and physisorbed (red) regimes. Insets in (b) and (c) provide the MMs normalized by the number of atoms of each species.
Download figure:
Standard image High-resolution imageA similar behavior was theoretically obtained for Gr on Ni(111) [37] and Co(0001) [8], whereby C atoms located at top and hollow sites coupled FM and AFM to the metal, respectively.
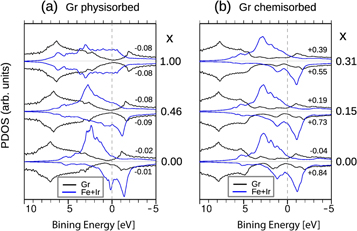
In order to understand the origin of the Gr–M magnetic couplings as well as the magnitude of the induced MMs, we plot in figure 11 the spin-resolved DOS(E,σ) projected on the Gr (dark) and the first metal layer (blue) at selected concentrations, x, both for the physisorption and chemisorption regimes (panels (a) and (b), respectively). In the graphs we also indicate the total net charge associated to each Gr's spin component above and below each plot.
Figure 11. Spin resolved DOS projected on the Gr (dark lines) and the first metal layer (Fe+Ir1) for Gr on Fe Irx/Ir(111) at various x concentrations (see right axis), and for (a) Gr physisorbed and (b) Gr chemisorbed. The Gr's integrated charge for each spin component is indicated above or below the corresponding PDOS plots.
Download figure:
Standard image High-resolution image
This net charge is defined as the total charge of each spin component minus one half of the pristine (unpolarized) Gr's total charge.
For the physisorbed case the PDOS onto Gr is highly reminiscent of that for the pristine phase but with an overall shift towards lower binding energies as x increases (n- to p-type doping transition). Due to the weak Gr–M interaction there are only very subtle differences between the Gr spin components leading to very small induced MMs. In the chemisorbed regime, however, there is an overall 2 eV shift of the Gr states towards higher binding energies (recall that the net Gr total charge remains almost unchanged (0.9e) throughout the entire x range). As could be expected, now there are marked differences between the  and
and  components in the overlap region between the π-band and the spin-split Fe d-bands due to a stronger Gr–M hybridization. Focusing first at x = 0 (lower curves in (a) and (b)), Gr chemisorption induces a broadening of the metal states and a large shift (
 eV) of the first (occupied) peak in the minority d-band. A closer inspection reveals that the Gr's π-band edge at
  (∼5 eV) and the double peak structure at ∼1.5 eV are the main reasons for the charge accumulation in the minority channel, while for the majority there is only one clear peak (∼3 eV) in this energy region. As a result, almost all the Fe–Gr charge transfer occurs via the
  channel with the
  channel remaining essentially neutral. This leads to a substantial charge imbalance between the two spin components that translates into large MMs AF coupled to the metal. As the Ir concentration increases the peaks in the π-band start to smear out and the asymmetry between the two channels (that is, the MM) is gradually reduced.
The net AF coupling found here for the Gr/Fe/Ir(111) system is in agreement with experimental observations and theoretical predictions for other Gr/FM interfaces such as Gr/Ni(111) [25, 37], Gr/Fe/Ni(111) [56], Gr/Fe/Ir(111) [35] or Gr/Co/Ir(111) [8, 9] although overall ferromagnetic coupling has been theoretically determined for Gr/Ni(111) as well [39, 40].
However, we note that Gr net MMs of the order of 0.03– per C atom are a challenge for both ab initio methods and current experimental techniques while the actual sign of the net MM may depend on fine details such as the balance between opposite magnetizations between the two graphene sublattices [40] or local modulations of the Gr–M distance [8].
3. Final discussion and conclusions
We have demonstrated via a multi-technique approach that alloying between Ir and Fe at the Gr/Fe–Ir/Ir(111) interface already sets in at relatively moderate temperatures around 700 K. This onset temperature of alloy formation is lower than temperatures typically used in other Gr intercalation experiments and may thus similarly take place in other extensively studied systems such as Gr/Au/Ni(111) [14, 57, 58] or Gr/Au/Fe(110) [13]. Indeed, surface alloying was recently also observed for Gr/Ni–Sn/Ni(111) [26], Gr/Ni–Al/Ni(111) [26, 27], Gr/Si–Ni/Ni(111) [28], and Gr/Co/Ir(111) [33].
Our results demonstrate that a critical dilution of about 0.25 Ir in the Fe layer on Ir(111) triggers a transition of the Gr layer from chemisorption to physisorption which is characterized by a shift of the Gr π-band of about 2 eV toward the Fermi energy, the restoration of the DC, and an increase of the Gr–metal distance above 3 Å. Beyond  0.3, further Ir dilution into the Fe layer leads to a continuous shift of the DP across the Fermi edge. A similar transition is also present when 0.25 Si is diluted in Gr/Ni(111) [28] suggesting that the critical ratio determined here is a general value of concentration at which the Gr's strongly interacting adsorption regime is destabilized.
Furthermore, the chemisorption to physisorption transition is accompanied by an inversion of the graphene's induced magnetization with tune-able spin polarizations due to the coupling with the substrate: the net antiferromagnetic coupling of the Gr layer to the Fe atoms in the chemisorption regime changes to weakly ferromagnetic in the physisorption one.
4. Methods
4.1. Experimental methods
Experiments were carried out in ultrahigh vacuum at base pressures of 10−10 mbar. The Ir(111) single crystal was prepared by repeated cycles of sputtering (Ar+, 1.5 keV) and annealing in a partial pressure of  mbar of O2 at
  K) and final high temperature heating at
  K for a few minutes. Surface quality was insured by a sharp (1 × 1) LEED pattern, STM imaging, and in ARPES measurements by the presence of Ir surface states [51]. Graphene layers were grown by thermal decomposition of C2H4 or C3H6 at different temperatures (from 900 to 1300 K) and partial pressures from
  to
to  mbar for times between 30 to 60 min. Additional details on the sample preparation are found in SI #1. The quality of the Gr layer was always ensured by a sharp, rotational domain free LEED pattern of the Gr on Ir(111) moiré pattern [22].
Scanning tunneling microscopy was carried out at room temperature using either an Omicron VT-STM or a SPECS Aarhus STM. STM images were recorded at constant tunneling current of 50–200 pA and constant bias voltage of −2 V, applied to the sample. Image processing was done with the WSxM software [59]. XPS experiments were performed using a Phoibos photoelectron spectrometer equipped with an Al Kα x–ray source (16 mA, 12.5 kV) as the incident photon radiation. The overall resolution of the instrument is approximately 0.9 eV.
Angle resolved photoemission measurements were performed using a Phoibos 150 SPECS high-resolution hemispherical electron analyzer. The sample was cooled down to 150 K. He-I (hν = 21.2 eV) radiation was provided by a high intensity UVS-300 SPECS discharge lamp coupled to a TMM-302 SPECS monochromator.
4.2. Theoretical details
Our spin-polarized DFT calculations were performed with the SIESTA code [60] under the generalized gradient approximation following the parametrization of Perdew, Burke, and Ernzerhof [61] for the exchange-correlation (XC) interaction. We took into account the vdW dispersion forces following the semi-empirical scheme proposed by Ortmann and Bechstedt [62]. Core electrons were replaced by norm-conserving pseudopotentials of the Troulliers-Martin type, with core corrections included for the metal atoms. The atomic orbital (AO) basis set consisted of double-zeta polarized numerical orbitals strictly localized—we set the confinement energy in the basis generation process to 100 meV. Real space three-center integrals were computed over 3D-grids with a resolution of 0.05 Å3 (equivalent to 1000 Rydbergs mesh cut-off). Brillouin zone (BZ) integration was performed over k-supercells of (24 × 24) relative to the Ir-(1 × 1) lattice while the temperature kT in the Fermi–Dirac distribution was set to 25 meV.
In an initial stage, all Gr/Fe Irx/Ir(111) structures were relaxed employing four Ir layers thick slabs plus the alloy layer and the Gr. In order to eliminate dipole-dipole interactions among image slabs, a large vacuum region of almost 200 Å thick was used. During the relaxations we fixed the bottom two Ir layers to bulk like positions and allowed the rest of metal atoms to relax. For the Gr we considered two different scenarios; one in which all C atoms could relax independently, and a second one where the Gr was relaxed as a rigid layer thus preventing any buckling among the C atoms. The latter constraint is necessary in order to calculate unfolded Gr-projected band structures (see below). Indeed, all results presented in the manuscript correspond to the rigid Gr case, leaving a short discussion on the buckled geometries to the SI #2. Furthermore, since in the (4 × 4) supercell the 32 C atoms reside at different positions relative to the topmost metal layer, test calculations showed that launching several relaxations with different initial Gr registries did not alter the results, with differences in the total energies below 1 meV/C.
Once all systems were relaxed we recomputed the self-consistent Hamiltonian for the optimized structures after adding six further Ir bulk like layers at the bottom of the slab and increasing the Brillouin zone sampling to a (48 × 48) k-supercell in order to obtain accurate doping values. The new generated slabs were then employed for both the calculation of the atomic charges and MMs as well as for creating semi-infnite surface systems [63] from which the unfolded band structure, in the form of Gr projected density of states maps, PDOS( ), was extracted. The PDOS(
 ) is calculated from the system Green's function according to:
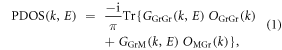
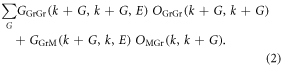
where GGrGr and GGrM are the system Green's function connecting the Gr with itself and the metal below, respectively, and OGrGr and OMGr stand for the corresponding intra and interlayer overlaps.
In order to unfold the PDOS( ) we note that any k-point within the BZ of the Gr-(1 × 1) layer, kGr, may be expressed as
  , where k belongs to the BZ of the (4 × 4) supercell and G is a so-called G-vector that relates the reciprocal lattices of the Gr and the supercell [64] (there are 16 G-vectors in total—see SI figure B1 (e)). Taking into account that, for a given k, the presence of the metal surface will mix all G-vectors, the terms entering the trace in equation (1) may then be rewritten as:
Unfolding the Gr's BZ is thus easily carried out by extracting the contributions of each  term individually prior to performing the sum over the G-vectors. The above scheme is exact as long as translational symmetry is strictly preserved in the Gr layer, as is the case for those structures where the Gr was rigidly relaxed. In the unfolded PDOS(
 ) maps shown in figure 7 we employed a resolution of 0.01 Å−1 in k-space and 10 meV in energy while the imaginary part of the energy entering the Green's function calculation (self-energy or broadening) was accordingly set to 5 meV, so that the computed (k,E) grids consisted of (164 × 2400) points.
Additionally, folded PDOS( ) maps have been computed with the same resolution and presented in figure S1, this time also including the projections on the first metal layer.
Acknowledgments
We are grateful to José Ignacio Pascual for providing the Ir(111) crystal. This work has been funded by the Spanish MINECO under contract Nos. FIS2013-48286-C2-1-P, MAT2013-47878-C2-R, MAT2015-66888-C3-1R, and MAT2013-46593-C6-4-P as well as the Basque Government Grants IT621-13 and IT-756-13.