
Abstract
The family of antiferromagnetic layered metal hexathiohypo diphosphates, M2P2S6 represents a versatile class of materials, particularly interesting for fundamental studies on magnetic properties in low dimensional structures, and yet exhibiting great potential for a broad variety of applications including catalysis, energy storage and conversion, and spintronics. In this work, three representatives of this family of 2D materials (M = Fe, Ni, and Mn) are exfoliated in the liquid phase under inert conditions and the nanosheet's properties are studied in detail for different sizes of all three compounds. Centrifugation-based size selection is performed for this purpose. The exfoliability and structural integrity of the nanosheets is studied by statistical atomic force microscopy and transmission electron microscopy measurements. Further, we report size and thickness dependent optical properties and spectroscopic metrics for the average material dimensions in dispersion, as well as the nanomaterials' magnetic response using a combination of cryo-Raman and superconducting quantum interference device measurements. Finally, the material stability is studied semi-quantitatively, using time and temperature dependent extinction and absorbance spectroscopy, enabling the determination of the materials' half-life, portion of reacted substance and the macroscopic activation energy for the degradation.
Export citation and abstract BibTeX RIS

Original content from this work may be used under the terms of the Creative Commons Attribution 4.0 license. Any further distribution of this work must maintain attribution to the author(s) and the title of the work, journal citation and DOI.
1. Introduction
Transition metal hexathiohypo diphosphates, alternatively also known as metal thiophosphates are well known material systems, first reported in the late eighteenth century [1–3]. The layered antiferromagnetic materials exhibit a general structure of M2P2S6, being comprised of bivalent metal ions (M = Co, Fe, Mn, Ni) and, as inferred by the name, hexathiohypo diphosphate ions (P2S6 4−), forming a honeycomb lattice in monoclinic space group C2/m (see SI, figure S1 for a schematic crystal structure) [2, 4–7]. While these materials were already identified as suitable candidates for electrochemical energy storage and conversion applications several decades ago [8–10], they were rediscovered soon after the experimental demonstration of the exfoliation of van der Waals materials into nanosheets [11–15]. This is because it is expected, that the materials' potential can further be exploited for nanostructured architectures due to the increased effective surface area, as readily demonstrated for other material systems [16–18].
In addition, recent advances in antiferromagnetic spintronics suggest the use of magnetization dynamics in antiferromagnetic structures for ultrafast and robust data reading and writing via relativistic magnetoresistance and torque effects, making these materials potential candidates for detection, transmission and generation of spin currents. However, for reasonable use of these materials in such circuits, it is beneficial to use nanosheet inks allowing for easy and scalable processing. Therefore, it is important to understand if and how their properties change upon delamination and exchange of the chemical environment. Yet, studies on the magnetic properties of metal thiophosphate nanosheets are strictly limited to micromechanically-exfoliated (ME) material [19–21]. To the best of our knowledge, nothing is reported on nanosheets dispersed in or exposed to a liquid environment, which is an important part of this work, as discussed further below.
Metal thiophosphates are also of interest due to their catalytic activity, particularly in the hydrogen and oxygen evolution reaction [22–24]. To this end, a high surface area is typically beneficial for catalysis, which further renders the exfoliability of these material systems important. However, as reported in previous work on Ni2P2S6, an enhanced effective surface area typically goes in hand with an increased chemical reactivity [13], which makes studying the stability of these compounds an important topic, especially to decouple effects arising from catalytic activity and chemical decomposition of the material, respectively.
While a broad palette of methods for the preparation of nanosheets is available today (e.g. mechanical milling [25–27], micromechanical exfoliation [20, 28], controlled growth [29, 30], electrochemical [31–33], and sonication-assisted exfoliation [34, 35]), a widely used approach on the lab scale is sonication assisted liquid phase exfoliation (LPE), which allows for the preparation of different sizes and thicknesses of nanosheets with yet inherent properties (i.e. undoped) in different solvents or solvent blends. In general terms, two conditions must be fulfilled for successful preparation of a nanosheet dispersion via sonication assisted approaches [36–40].
- (a)The surface energy of the solvent and the solute have to match in order to form a colloidally stable dispersion [40].
- (b)The energy exerted to a layered crystal has to exceed the interlayer attraction for successful delamination [38].
In this context, it is important to keep in mind that, in a simplified picture, the event of nanosheet exfoliation (i.e. out-of-plane layer separation) is accompanied by the cleavage of covalent bonds (in-plane tearing of the material) [38, 39]. While both processes can be considered as statistic events, their balance is given by the ratio of the in-plane to out-of-plane binding energy of the material, which means that the applicable size range is predetermined by the materials intrinsic binding strength anisotropy [38, 39]. While this represents an inherent limitation of the process, it is expected for the materials under study to have a comparable bonding situation and hence similar nanosheet sizes are expected at a given layer thickness for all materials studied in this work.
In this report, we demonstrate the sonication-assisted exfoliation of three different metal thiophosphates, namely Fe2P2S6, Ni2P2S6 and Mn2P2S6 under inert conditions in the organic solvent N-cyclohexyl-2-pyrrolidone (CHP). To reduce the polydispersity of the nanosheet dimensions in the resulting stock dispersion after sonication, established liquid cascade centrifugation (LCC) protocols were applied for size selection. The structural integrity and elemental composition of the nanomaterial were confirmed by a combination of transmission electron microscopy (TEM), selected area electron diffraction (SAED), and energy dispersive x-ray spectroscopy (EDX). In order to assess the exfoliability of all three material systems, here represented by the lateral size to thickness aspect ratio, we used statistical atomic force microscopy (AFM). The size-dependent photo spectroscopic response using extinction and absorbance spectroscopy was assessed and quantitatively linked to the nanosheet dimensions to establish spectroscopic metrics for the nanosheet lateral size, and layer number, using two different fitting functions, in agreement with previous reports [41, 42]. Furthermore, the magnetic characteristics of the nanosheets were studied for different nanosheet sizes and composites of exfoliated nanosheets and carbon nanotubes (CNTs) were fabricated and used as anodes for sodium ion batteries (SIBs) with near theoretic capacities. Finally the nanosheets' environmental stability was studied by performing time and temperature dependent extinction and absorbance measurements, which enables the determination of the macroscopic material half-life and is an important parameter for further processing [13]. First order decay kinetics were observed in all cases with time constants following Arrhenius-type temperature dependence which allows for the estimation of the size-dependent activation energy for the degradation of all three material systems.
2. Results and discussion
2.1. Characterisation of the starting material: Fe2P2S6, Ni2P2S6 and Mn2P2S6
Metal hexathiohypo diphosphate crystals were prepared by a solid state diffusion reaction at elevated temperatures as reported previously [13, 43]. The crystallites of each compound show the characteristic layered structure albeit with different morphologies for each material as indicated by scanning electron microscopy images (SEMs, figures 1(A)–(C); for overview images see SI, figure S2). Fe2P2S6 crystallites (figure 1(A)) are loosely agglomerated in millimetre-sized clews of rod-like single crystals with a typical size of 10–30 µm (longest dimension), and an aspect ratio of ∼5 (see also SI, figures S2(A) and (B)). In contrast, Ni2P2S6 crystallizes in brick-like structures, well above a hundred micrometres in their lateral size (see SI, figure S2(C)). Individual layers are clearly resolved at higher magnification (figure 1(B)). For Mn2P2S6, crystallite sizes of up to 50 µm are observed (see SI, figure S2(E)). However, smaller layered, slab-like structures with a typical size below one micrometre are found to be spread over the larger crystals (figure 1(C)). Overall, every material shows different characteristic crystallite sizes and morphology in the starting material despite similar synthesis conditions. To confirm the purity and crystallinity of the bulk material, x-ray diffraction (XRD) and Raman measurements have been carried out. The measured patterns of all compounds match the calculated diffractograms from literature and only minor impurity peaks are present (see SI, figure S3) [3, 44]. Slight intensity differences compared to the theoretical patterns are caused by the preferred orientation of the crystallites, which is a well-known phenomenon for 2D materials, documented in various reports [5, 45–47]. Raman spectra acquired for the different excitation wavelengths (532, 633 and 785 nm) show only the characteristic lattice vibrations of the C2/m hexathiohypo diphosphates (see SI, figure S4) [20, 48]. The same modes are observed for all excitation wavelengths with minor changes in the relative intensities for the different resonance conditions. XRD and Raman measurements overall suggest the high crystallinity and purity of all starting materials.

Figure 1. Comparison between the starting material and exfoliated nanosheets. (A)–(C) SEM images of Fe2P2S6 (A), Ni2P2S6 (B) Reprinted with permission from [13]. Copyright (2019) American Chemical Society. and Mn2P2S6 (C) crystallites as used for liquid phase exfoliation. The different starting materials clearly show distinct crystal morphologies and aspect ratios. The Fe2P2S6 crystals used for this study (A) are rod-like with a typical size of 10–30 µm for the longest dimension and an aspect ratio of 5. For Ni2P2S6, the crystals of the bulk material are brick-like with sizes of up to several hundreds of micrometres. The Mn2P2S6 crystals used for this study (C) show a wide range of particle sizes. Comparatively small, slab-like structures with typical sizes of ∼500 nm are often observed on larger (20–50 µm) crystals. (D)–(F) Diffraction patterns from intermediate-sized nanosheets of the respective materials (from left to right, Fe2P2S6, Ni2P2S6 Reprinted with permission from [13]. Copyright (2019) American Chemical Society., and Mn2P2S6). Bright field TEM images of the nanosheets from which the patterns were taken are shown in the inset. Similar nanosheet sizes are observed in the intermediate fraction for all three materials. In all cases, the nanosheets show high crystallinity with only the expected electron diffraction peaks.
Download figure:
Standard image High-resolution image2.2. Production and basic characterisation of nanosheets
For the preparation of nanosheets, the bulk materials were subjected to liquid phase exfoliation by bath sonication in a nitrogen atmosphere using standard Schlenk techniques. Ground bulk crystals were immersed into distilled, degassed, and dried CHP for this purpose (see Methods Section in the SI for further details). This way, oxidation is prevented which enables to study inherent nanosheet properties. While the resulting stock dispersion after exfoliation is a polydisperse mixture of different nanosheet sizes and thicknesses, previously established centrifugation-based size selection (i.e. LCC) can be used to split the stock dispersion into fractions of defined size and thickness distributions (See SI, figure S5 for a schematic illustration of the process) [49]. To achieve this, unexfoliated material was first separated from the nanomaterial by centrifugation at low speed (here at 50 g for 2 h). Note that the unit 'g' refers to a relative centrifugal acceleration expressed in multiples of the earths' gravitational field. The supernatant was separated from the sediment and centrifuged further at higher speed (e.g. 100 g), which in turn leads to sedimentation of comparatively large and thick nanomaterial. The supernatant was decanted from the sediment and used for the subsequent step at further increased centrifugation speed, while the sediment was redispersed in reduced volume of fresh solvent. This procedure was repeated in multiple iterations, giving access to smaller and thinner nanosheets in each sediment fraction along the cascade, until ultimately mostly defective and oxidised material remains in the supernatant [13, 50], which is not subjected to analysis in this study. While the overall procedure is time consuming, it has the advantage of low material wastage, as all fractions can be collected for analysis and further processing to study size effects on fundamental material properties and device performance.
In this work, two different cascades were applied for size selection respectively. The first cascade (Cascade 1) consists of 7 consecutive centrifugation steps, splitting the stock dispersion into six fractions of different sizes and thicknesses (Cascade 1: 50 g, 100 g, 400 g, 1000 g, 5000 g, 10 000 g, 30 000 g). In contrast, the second cascade (Cascade 2) consists of four centrifugation steps, giving access to 3 fractions with a broader size and thickness distribution compared to the fractions extracted in Cascade 1, but with greater masses of material being accessible in each fraction (Cascade 2: 600 g, 3000 g, 10 000 g, 50 000 g).
Having two different cascades is useful for two reasons: first, the robustness of the size selection can be demonstrated as the average nanosheet size and thickness distribution is expected to scale with the midpoint of the upper and lower centrifugation boundaries between two consecutive centrifugation steps [49, 51, 52], which is discussed in more detail below. Second, different techniques have different requirements on the material: studying the size-dependent optical properties requires insignificant material mass, but benefits from multiple fractions (as produced in the first cascade), while for the magnetic studies, higher masses are favourable, which makes the second cascade procedure advantageous as it gives access to larger amounts of material in each fraction.
To confirm that the nanomaterial did not undergo any structural changes upon exfoliation and centrifugation in the liquid medium, scanning transmission electron microscopy (STEM) and SAED measurements, as well as single flake EDX spectroscopy was performed on different size-fractions of the nanomaterial. Figures 1(D)–(F) show the respective diffraction patterns of Fe2P2S6, Ni2P2S6 and Mn2P2S6 nanosheets (left to right) deposited from an intermediate size-fraction, trapped between centrifugation steps performed with the supernatant resulting after centrifugation at 3k g and the sediment collected at 10k g, hence labelled as 3–10k g (see SI for a detailed description on the labelling). The inset in each panel shows a high-angle annular dark field STEM image of the nanosheet with the location of the SAED measurement indicated by the yellow circle. Corresponding measurements on Fe2P2S6 and Mn2P2S6 nanosheets from other size fractions, as well as EDX elemental distribution maps are shown in the SI (figures S6 and S7). The SAED measurements on nanosheets of all fractions show sharp diffraction spots consistent with single crystalline nanosheet morphology (SI, figure S6). High resolution STEM images show ordered crystal lattices of the nanomaterial, further implying high crystallinity of the freshly prepared nanomaterial (see SI, figure S6(D) and H for Fe2P2S6 and Mn2P2S6, respectively; for Ni2P2S6 see [13]). STEM EDS mapping suggests a uniform elemental distribution with the expected stoichiometry across different sizes of the nanomaterial (see SI, figure S7 and [13]). Overall, STEM experiments suggest a high purity and crystallinity of the exfoliated specimens. Hence, it can be assumed that only insignificant oxidation of the nanomaterial occurred within the timeframe required for the material exfoliation and size-selection under inert gas conditions. The spectroscopic response of the freshly dispersions under study is hence considered as the materials' inherent size-dependent response.
To investigate the size-dependent properties of the exfoliated nanosheets, it is essential to quantify the size and thickness distribution in each fraction of the size selection for both cascades. To this end, drop cast nanomaterial was subjected to statistical AFM analysis [41, 53–55]. Representative images for a fraction containing relatively large and thick (0.1–0.4k g, figures 2(A) and (B) and small and thin (10–30k g, figures 2(C) and (D)) nanosheets are shown for Fe2P2S6 (upper row) and Mn2P2S6 (lower row), respectively (for all sizes see SI, figures S8–19). The nanosheets observed in AFM are of similar morphology as measured in TEM. In each fraction >200 nanosheets were counted for a representative demonstration of the size distributions in the individual fractions. Note that the measured nanosheet lateral dimensions were corrected for cantilever broadening and pixilation effects as previously suggested by a comparative study on TEM and AFM statistics for other 2D materials [42]. To convert the measured, apparent thickness to the nanosheet layer number, it is important to consider contributions from solvent residues, measuring parameters and chemical characteristics of the surface [56–59]. Thus, the measured height ( ), is proportional but not identical to a multiple of the crystallographic interlayer distance of the nanosheets and
  can be converted to the number of 2D layers (N) by careful analysis of step heights of incompletely exfoliated nanosheets [13, 42, 60]. Due to the similar crystallographic dimensions of all three materials studied in this work, and the fact, that the measurement setup, as well as the chemical environment were kept constant across all samples, it seems reasonable to use the same step height as previously reported for Ni2P2S6 nanosheets exfoliated in CHP (1.5 nm) [13] for conversion of the apparent height of Fe2P2S6 and Mn2P2S6 into their layer number. In addition to the thickness, the length (
 ) of a nanosheet defined as the longest dimension of a sheet and the width (
 ) (i.e. the dimension perpendicular to the length) was measured consistent with previous reports [13, 41, 61].
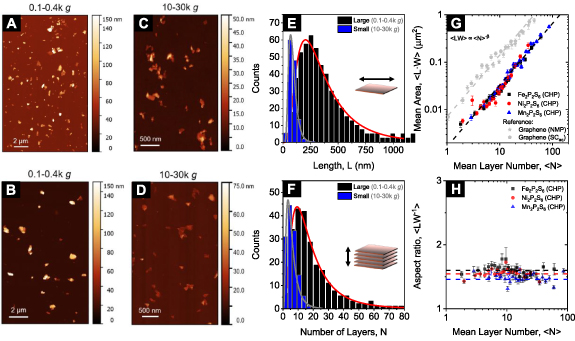
Figure 2. Quantification of the size and thickness distributions of Fe-/Ni-/Mn2P2S6 nanosheets. (A), (B) AFM images of drop-cast nanosheets of Fe2P2S6 (A) and Mn2P2S6 (B) for a fraction containing relatively large nanosheets, isolated at low centrifugal accelerations (RCF = 0.1–0.4k g). (C), (D) AFM images of the same materials as shown in (A), (B), but for smaller nanosheets isolated at high centrifugal accelerations (Fe2P2S6 (C), Mn2P2S6 (D), RCF = 10–30k g). (E), (F) Histograms of the nanosheet lateral size (E) and layer number (F) distribution for the two fractions of Fe2P2S6 shown in (A) and (C), respectively. (G) Plot of the arithmetic mean nanosheet area over the mean nanosheet layer number. The nanosheet areas of all three materials fall on a master curve, following a power law increasing with the nanosheet layer number. Additional data on graphite exfoliated in different media is shown in grey for comparison. (H) Arithmetic mean nanosheet length/width aspect ratio as a function of the average layer number. The aspect ratio for nanosheets of different thicknesses shows no trend with material thickness and is around 1.5 for all three materials. Note, that the nanosheet length (L) is defined as the sheet's longest dimension, while the width (W) is the dimension perpendicular to the length. The nanosheet area is estimated as the product of L and W.
Download figure:
Standard image High-resolution imageThe nanosheet length and thickness distributions of the Fe2P2S6 nanosheets contained in the fractions shown in figures 2(A) and (C) are presented in figures 2(E) and (F), respectively. A significant narrowing of both the nanosheet length distribution (figure 2(E)) and the layer number distribution (figure 2(F)) is observed with increasing centrifugal acceleration (for the complete set of AFM statistics of all sizes and all three materials, see SI, figures S8–19). The nanosheet dimensions in the individual fractions follow a power law if plotted as a function of the midpoint of the centrifugal acceleration of two consecutive centrifugation steps used to produce the fraction (central centrifugal acceleration, see SI, figures S20(A)–(D)). Note that data from both cascades is included, merging on the same curve, which emphasizes the robustness of the size selection. While this is in line with previous work [13], it provides important input to further understanding of the sedimentation behaviour of the metal thiophosphates more broadly. To this end, the arithmetic mean values for the nanosheet layer number,  and length,
  are plotted as a function of central RCF on a logarithmic scale (see SI, figures S20(A) and (B)). For both observables, a clear linear decrease (i.e. power law dependence) is observed with increasing centrifugal acceleration. Fitting of the data reveals a universal proportionality for the layer number,
  and slightly different exponents for the nanosheet length,
  with
with  ,
,  , and
, and  . Note that a similar behaviour is observed for other 2D-material systems [54], even though an exponent of −0.5 is typically expected for
  due to the correlation between
  and the cut size, which is found to be proportional to the inverse rotation rate, as reported elsewhere [49, 51].
The determination of the nanosheet dimensions in the size-selected fractions on a statistical basis allows to compare the average nanosheet morphology across the materials. This is an important parameter to assess the exfoliation process, or rather the ease of exfoliation or exfoliation quality. The current understanding of the LPE process suggests that this is predominantly determined by the ratio of in-plane to out-of-plane binding strength as mentioned above [53]. There are a number of ways to assess this parameter quantitatively. For example, the arithmetic mean length/thickness aspect ratio could be calculated. Alternatively, it was suggested in literature [62] to analyse the natural logarithm of the aspect ratio which follows a Gaussian shape and can thus be fit reliably to determine the average. In addition, topological vectors were recently introduced to describe the nanosheet morphology and shape [63]. However, these require large datasets (of tens of thousands of nanosheets) that are not available in the case of the M2P2S6 nanosheets under study here.
In previous work, we used a plot of the fraction averaged length as function of thickness which was found to follow a power law to extract the characteristic monolayer length through extrapolation [53]. However, this methodology suffers from the drawback that it can be influenced by subtle differences in the centrifugation-based size selection. Here, we follow a different approach as a compromise between the two methodologies to take the influence of centrifugation out of the picture on the one hand and still allow for a reasonable comparison with published data on other materials. First, we combine all data points on nanosheet length, or rather nanosheet area (estimated as product of length and width) and the corresponding thickness across all fractions from both cascades for each material in one bigger dataset. This combined dataset represents accessible nanosheet lateral sizes and thicknesses (i.e. the size and thickness range of nanomaterial that can be produced by sonication assisted liquid phase exfoliation and accessed by centrifugation-based size selection within the boundaries of 50–50 000 g) for each material and can thus be regarded as qualitatively representative for the population of nanosheets in the stock dispersion. This is then grouped in bins of a certain thickness range so that at least 70 nanosheets fall within one bin (for further details see discussion in the AFM section in the SI). In each bin, the arithmetic average nanosheet area is calculated and plotted versus the nanosheet layer number in figure 2(G).
Similar to the fraction-averaged data, a powerlaw relation between area and number of layers is observed which can be fit to an empirical equation of the form [53]

where  represents the represents the characteristic lateral nanosheet size associated with monolayers.
This representation is comparable, but not identical to the one we previously used to determine the characteristic monolayer length through extrapolation which is best visualised by the direct comparison (see SI, figures S20(E) and (F)). The main difference between the two representations is a numerical inequality of the proportionality between the nanosheet area and the layer number, given by the exponent ( in equation (1)), extracted from fraction-averaged (
 ) [53] and N-averaged data (
 ), which will require further experimental and theoretical work to be fully rationalised. The important outcome of this analysis is a reliable comparison of the ease of exfoliation across the three materials under study and in comparison to other materials such as graphene which we re-analysed from out previously published work [54] in the same manner as point of reference. As clearly demonstrated in figure 2(G), the three metal thiophosphates show a similar quantitative relationship between area and layer number confirming that the ratio of in-plane to out-of-plane binding strength must be comparable. Overall, the nanosheets are laterally smaller at a given layer number than graphene by almost an order of magnitude.
Further, the aspect ratio between the nanosheet length and width ( ) was evaluated in a similar way since peculiar changes with nanosheet thickness have previously been observed for other materials [39, 53, 62]. In the case of the metal thiophosphates investigated here, the
  data of all three materials is scattered around 1.6 for all accessible nanomaterial thicknesses (see figure 2(H)).
To conclude, only insignificant differences are observed for the nanosheet dimensions for the three compounds despite the different morphology of the respective starting material. This further emphasizes that the size of the parent crystallites has no considerable impact on the resulting nanosheet dimensions, in line with previous findings for different starting materials of LPE MoS2 [64].
2.3. Size-dependent photo spectroscopic response
After quantification of the nanosheet dimensions in each fraction, potential changes in the spectroscopic response, for example in optical extinction and absorbance spectra, can be correlated to average nanosheet length or thickness, respectively. Such changes can best be visualized in normalized spectra. It was reported in previous work that a materials' optical response typically changes in a defined and systematic way as a function of its size and thickness [13, 41, 42, 65]. This observation can be attributed to changes of the intrinsic materials' properties due effects arising from confinement [66] and edge contributions [42]. Additionally, extrinsic parameters such as size-dependent light scattering [67] and screening of the dielectric environment [41, 68] have a characteristic impact on the optical spectra.
The normalised absorbance spectra of the different sizes of Fe2P2S6 nanosheets dispersions are shown in figure 3(A). The systematic change of the spectroscopic profile with the material size is illustrated by two grey arrows. We note that the obvious change of relative peak intensity ratios typically contains information on the lateral size of the nanosheets, which can be understood as the changing ratio of contributions from electronically different nanosheet edges and basal planes. For both the absorbance and extinction spectra of all three materials and for both cascades (see SI, figures S21 and S22), a systematic decrease of a wavelength ratio is observed (e.g. 350/500 nm for Fe2P2S6) with increasing average nanosheet length. The changes follow a simple model, previously derived to describe the impact of the two different contributions to the spectra (equation (2)) [42], where  represents the (extinction or absorbance) peak intensity ratio,
  is the average nanosheet length and the parameters
  and
and  are obtained from fitting. To reduce the degrees of freedom,
  was fixed to 1 [42].
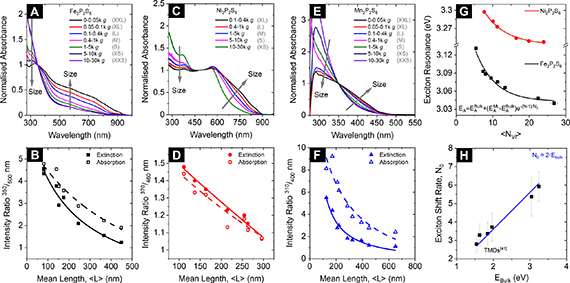
Figure 3. Size and thickness metrics from extinction and absorbance measurements. (A) Normalised absorbance spectra for different sizes of Fe2P2S6 nanosheets. (B) Extinction and absorbance intensity ratio at 350 over 500 nm as function of the nanosheet average lateral size in the different size-fractions of Fe2P2S6. (C)–(F) similar plots as shown in (A)–(B) for Ni2P2S6 (C), (D) and for Mn2P2S6 (E), (F) nanosheets. Systematic size-dependent changes in the absorbance spectra are indicated by the grey arrows, respectively (A), (C), (E). The plots in (B), (D), (F) follow the fit function based on different contributions from material edges and basal planes and hence scale with the nanomaterial lateral dimensions. The fit parameters are used to derive equations to determine the nanosheet lateral size from extinction and absorbance measurements (table 1). (G) Shift of the excitonic resonance of Fe2P2S6 and Ni2P2S6 as a function of the volume-fraction weighted layer number. Reprinted with permission from [13]. Copyright (2019) American Chemical Society. Excitonic shifts follow an exponential function as indicated below in the panel. (H) Phenomenological decay constant ( ) as function of excitonic resonance of the bulk material (
 ) from extrapolation of the fitted trends. Previously reported data on four different TMDs (WS2, MoS2, WSe2 and MoSe2) is included for comparison. Reprinted with permission from [41]. Copyright (2019) American Chemical Society. The exciton shift rate follows the initial trend extracted for TMDs when the data for Fe2P2S6 and Ni2P2S6 is included. This is visualised by the grey dashed line which is a guide for the eye with direct proportionality N0 = 2Ebulk. No trends can be analysed for Mn2P2S6 as no excitonic transitions are observed.
Download figure:
Standard image High-resolution imageTable 1. Spectroscopic metrics for M2P2S6 nanosheet size and thickness. Reported equations [53, 65] are rearranged for direct determination of the nanosheet length,  and layer number,
  from photo spectroscopic intensity ratios and peak positions, respectively. Data for Ni2P2S6 is included from previous work for comparison [13].

|
| |||||||
|---|---|---|---|---|---|---|---|---|
| R |
 (nm−1) (nm−1) |

|
 (nm−1) (nm−1) |

|
 (eV) (eV) |
 (eV) (eV) |

| |
| Ni2P2S6 (Ext) [13] |

| −0.0185 | 1.72 | 0.0003 | 1 | 3.456 | 3.139 | 5.80 |
| Ni2P2S6 (Abs) | −0.0009 | 1.69 | 0.0011 | 1 | 3.414 | 3.243 | 5.93 | |
| Fe2P2S6 (Ext) |

| −0.0065 | 6.92 | 0.0053 | 1 | 3.199 | 3.041 | 6.31 |
| Fe2P2S6 (Abs) | −0.0054 | 5.88 | 0.0020 | 1 | 3.231 | 3.043 | 5.37 | |
| Mn2P2S6 (Ext) |

| −0.5212 | 999.14 | 1.3468 | 1 | n.a. | n.a. | n.a. |
| Mn2P2S6 (Abs) | −0.0140 | 18.05 | 0.0063 | 1 | n.a. | n.a. | n.a. | |
Equation (1) can be rearranged for  , which can be used to describe a metric for the average lateral nanosheet dimensions from extinction or absorbance intensity ratios (see table 1). The results for Fe2P2S6 are shown in figure 3(B). Despite some scatter, the fits seem reasonable for both extinction and absorbance spectra. Similar trends are observed for Ni2P2S6 (figures 3(C) and (D)) and Mn2P2S6 (figures 3(E) and (F)), with the corresponding metrics for the average nanosheet lengths for all three material systems listed in table 1.
In addition to the systematic changes of the intensity ratio with nanosheet size, slight shifts of the optical transitions are observed. This is a common phenomenon, which typically scales with the nanosheet layer number, and can be attributed to a combination of quantum confinement effects and the changing impact of the dielectric environment when varying the nanosheet surface to volume ratio. While such shifts of electronic resonances have recently been described by a phenomenological fit to a single exponential, as described in more detail elsewhere [41], it is important to consider that larger and thicker nanosheets have a bigger impact on the spectral profile than small and thin nanosheets. This is because the volume and not the number average of the nanosheets is probed. To account for this, the layer number is weighted with the nanosheet volume fraction ( ) and in the following, the volume fraction-weighted layer number, termed
  is used, which is related to the arithmetic mean layer number,
  in a similar way that the number- and weight-averaged molecular weight are related in polymer chemistry (for more details see SI, section 4.2) [41, 69, 70].
While Mn2P2S6 is bereft of features, the position of electronic resonances in Fe2P2S6 and Ni2P2S6 were extracted from the second derivative of the spectra (see SI, figure S23 for details). In agreement with other material systems reported in literature [16, 41, 65, 71–73], a systematic blue shift of the transition energy is observed for both thiophosphates. The change of the excitonic resonances with  for Fe2P2S6 and Ni2P2S6 extracted from absorbance spectra are shown in figure 3(G) (for extinction see SI, figure S24). As already discussed, a phenomenological fit function, as recently demonstrated on layer-dependent excitonic shifts in group VI transition metal dichalcogenides (TMDs) can be used to extract the expected optical gap for bulk material (
 ) and monolayers (
 ), as well as the empirical shift rate (
 ), at which the resonance energy transitions from the monolayer to the bulk response [41].
Furthermore, the relation between the phenomenological shift rate,  follows the same trend with the absolute energetic position of the excitonic resonance for the bulk material (
 , determined from extrapolation of the exponential trends in figure 3(G) to infinite layer numbers) as previously discussed for TMDs [41]. For better comparison, previously reported results on the relation between the exciton shift rate and the bulk resonance for TMDs are shown together with trends extracted for Fe2P2S6 and Ni2P2S6 in figure 3(H).
This is an important result, which suggests similar changes to the electron hybridization and Coulomb interactions upon decrease of the materials' layer number as previously discussed for TMDs [41]. In particular, changes to the Coulomb interactions can explain the dependence between  and
and  , using the Moss relation: a larger band gap leads to a smaller inherent material permittivity which would lead to a decreased impact of the materials' permittivity to the dielectric screening and therefore less contributions from Coulomb effects. Consequently, the phenomenological decay constant (
 ) increases, as observed in figure 3(H). A line as guide for the eye is included (direct proportionality with
  ). However, for a meaningful discussion, results on additional materials will be required, as well as additional theoretical calculations.
2.4. Magnetism of liquid-exfoliated M2P2S6 nanosheets
A particularly interesting aspect of the three different metal thiophosphates under study is that these materials can show antiferromagnetic ordering of different types depending on the magnetic exchange interactions of the magnetic moments at the metal sites. In the case of metal thiophosphates, the magnetic moments on the metal ions employed in between the P2S6 4− sublattice show different magnetic anisotropy which gives rise to different spin dimensionalities (Ns). This means that the moment can be directed only in one dimension (Ising type, M = Fe2+, Ns = 1), two dimensions (XXZ type, M = Ni2+, Ns = 2), or all three dimensions (Heisenberg type, M = Mn2+, Ns = 3) [74, 75]. Hence, these materials represent a unique platform to study magnetism of different types and its theory in a homogenous 2D periodical system without changing the materials' crystal structure.
While this is interesting for future work and discussed in more detail elsewhere [20, 75, 76], to harness the materials magnetic behaviour for applications it is important to determine whether and to what extent the magnetic properties change upon exfoliation. Recent studies report changes on the rotational anisotropy of the second harmonic generation [19, 77], Raman modes [20, 78], and magnetoresistance [79, 80] near the Néel temperature ( ) of different M2P2S6, indicative for magnetic ordering of the nanomaterials.
Temperature-dependent Raman measurements on micromechanically-cleaved nanosheets have recently suggested indirectly that magnetic properties can be preserved for the nanomaterial of any thickness above (Ni2P2S6, Mn2P2S6) [76, 78] or even down to a single layer (Fe2P2S6) [20], depending on the magnetic interactions of the material. In short, distortions of the spin alignment due to symmetry breaking vibrations including the metal atom in the lattice can lead to a change of the resonance conditions of the corresponding vibrational mode. Hence, apart from temperature induced changes in the spectra, differences between the spectra acquired below and above the Néel temperature of the antiferromagnetic material can be observed [20, 76, 81].
To test for indications of magnetic ordering of the LPE nanosheets, we use cryo-Raman measurements on drop cast nanomaterials for three different nanosheet sizes and thicknesses, as prepared by Cascade 2. The spectra of the intermediate size of Fe2P2S6 nanosheets (3–10k g) are shown in figure 4(A). In line with literature on ME nanosheets, the spectra of LPE Fe2P2S6 show a sudden jump of the peak area, corresponding to the vibrational mode with Eg
(2) symmetry at temperatures close to the Néel temperature of the bulk material ( = 118 K) [20, 81, 82]. While this does not confirm magnetic ordering in the nanomaterial, we consider this a strong indicator that the magnetic properties of our liquid-exfoliated Fe2P2S6 nanosheets are comparable to the bulk sample.
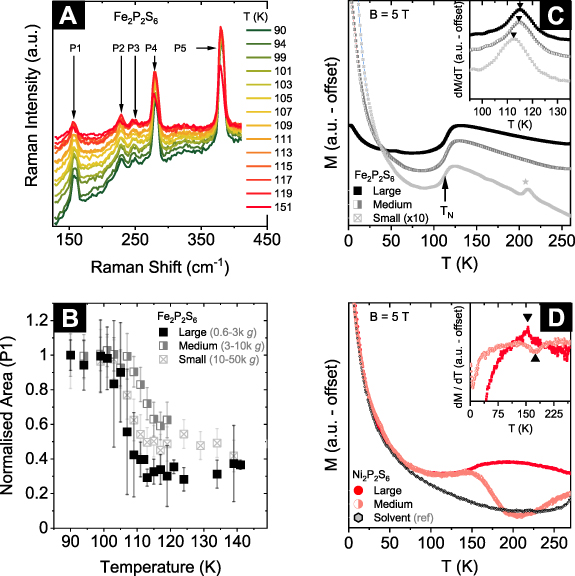
Figure 4. Antiferromagnetic response of liquid-exfoliated Fe2P2S6 nanosheets. (A) Temperature-dependent Raman spectra ( = 532 nm) of drop-cast, intermediate-sized Fe2P2S6 nanosheets. (B) Change of the area of peak 1, corresponding to the Eg
(2) mode of Fe2P2S6, normalised to the spectrum acquired at 90 K for comparison between differently sized nanosheets. The area decreases abruptly for temperatures above the Néel temperature of the bulk solid Fe2P2S6 (
= 532 nm) of drop-cast, intermediate-sized Fe2P2S6 nanosheets. (B) Change of the area of peak 1, corresponding to the Eg
(2) mode of Fe2P2S6, normalised to the spectrum acquired at 90 K for comparison between differently sized nanosheets. The area decreases abruptly for temperatures above the Néel temperature of the bulk solid Fe2P2S6 ( = 118 K) [20]. The transition change is observed for all three sizes of the nanomaterial. (C) Temperature dependence of the DC-magnetisation of Fe2P2S6 in an external magnetic field of B = 5 T, for three different flake sizes (note the different scaling of the data). The black arrow marks the antiferromagnetic ordering temperature. The asterisk marks a magnetic impurity or decomposition product of unknown nature. Inset: temperature derivative of the magnetisation. Black triangles mark the transition temperatures
  = 115.2 K, 114.8 K and 112.6 K for large, medium, and small-sized nanosheets, respectively. (D) Temperature dependence of the DC-magnetisation of Ni2P2S6 flakes measured in an external magnetic field of B = 5 T for two different flake sizes. The grey markers show the response of the solvent (CHP). The data is scaled to the magnetisation of the solvent in the low temperature regime. Inset: Temperature derivative of the magnetisation. The black triangles mark rather faint anomalies at 175.1 K and 154.3 K for the intermediate and large-sized nanomaterial, respectively.
Download figure:
Standard image High-resolution imageIn contrast to ME nanosheets, liquid phase exfoliation allows to prepare considerably larger quantities of nanomaterial, which enables additional characterisation of the magnetic properties of the M2P2S6 nanosheets. To this end, superconducting quantum interference device (SQUID) measurements have been carried out on different sizes of concentrated dispersions of M2P2S6 nanosheets in CHP. The temperature dependence of the magnetisation in an external magnetic field of 5 T for the same three sizes of Fe2P2S6 nanosheets as also subjected to cryo-Raman measurements (i.e. 0.6–3k g 'Large', 3–10k g 'Medium' and 10–50k g 'Small') are shown in figure 4(C). At low temperatures, the curvature resembles a Curie-like behaviour, which is attributed to (paramagnetic) contributions of CHP to the magnetic response (see also black trace in figure 4(D)). Upon heating, a broad step-like increase in the magnetisation at around 115 K is observed for all three nanosheet sizes under study. This feature can be ascribed to the evolution of long-range antiferromagnetic order which in the bulk material evolves at 118 K and is of a zig-zag-type where ferromagnetic zig-zag chains are coupled antiferromagnetically [75]. The actual transition temperatures can be determined from the derivative ∂M/∂T (see inset, figure 4(C)) and are read-off as  = 115.2 K,
  = 114.8 K and
  = 112.6 K, respectively. The observed values for TN are thus close to, but slightly smaller than the observed Néel temperature for the bulk material. The decrease of TN with the nanosheet thickness is in line with recent findings on mechanically-exfoliated Fe2P2S6 on Si substrates, in which TN is found to weakly depend on the sample thickness down to the monolayer [20]. This observation implies that, while anisotropy is a driving factor of the evolution of long-range magnetic order, the effect of interlayer coupling is rather small. This is corroborated by the fact that the actual order in the z-direction is rather incomplete and not well-established in the bulk material, but a short-range magnetic order perpendicular to the layers is observed even at low temperatures [83].
Similar to the measurements acquired on Fe2P2S6, temperature-dependent Raman (see SI, figures S26–S28), as well as SQUID measurements (figure 4(D)) have been carried out on different sizes of Ni2P2S6 nanosheets. Systematic changes are observed with decreasing temperature, similar to spectra acquired for Fe2P2S6. However, the signal broadening due to the random orientation of the deposited nanosheets does not allow to study the splitting of P2 (Eg
(2)) as demonstrated for ME nanosheets [78]. We therefore plot the change of the peak resonance of P1 as a function of temperature (see SI, figure S28). Close to the Néel temperature of the bulk material ( = 155 K) [45], a significant increase of the resonance energy is observed for the large and the intermediate-sized nanosheets, indicating magnetic correlations in the nanomaterial. In addition, a broad 2-magnon resonance is observed at ∼450 cm−1, which can be used as second indicator for magnetic ordering. Fitting reveals a systematic increase of the resonance frequency with decreasing temperature, as well as an increase of the peak area with decreasing temperature which has its maximum close to the Néel temperature (see SI, figures S28(D)–(F)). Further decrease of the temperature leads to a decrease of the peak area, which remains constant below ∼130 K.
The temperature dependence on the magnetic correlation of LPE Ni2P2S6 is therefore studied further by SQUID measurements. Like for Fe2P2S6, the magnetisation of different sizes of nanosheets is plotted as a function of temperature (figure 4(D)) and shows a Curie-like behaviour at low temperatures, attributed to contributions from the solvent (shown in black). In addition, the magnetisation of large-sized nanosheets (0.6–3k g) exhibits a maximum around 180 K and decreases below, indicating the onset of antiferromagnetic ordering. The actual ordering temperature is identified as small peak in the derivative ∂M/∂T (see inset figure 4(D),  = 154 K). While this is in nearly perfect agreement with the transition temperature reported for the bulk material (
 = 155 K) [45], the medium-sized nanosheets show a significant difference of the temperature dependence of the magnetisation compared to the large nanosheets. The magnetisation at room temperature seems to decrease upon cooling before steeply increasing at around T* = 175 K. This is a puzzling result and is in contrast to findings for the large nanosheet sample where the magnetisation monotonously increases upon cooling. The reason for this unexpected behaviour is unclear. The data acquired from SQUID measurements does not indicate antiferromagnetic ordering at lower temperatures. We note that measurements on a small fraction of Ni2P2S6 nanosheets (10–50k g) do not show any features apart from a Curie-like curvature and are therefore not included.
The appearance of an additional feature at higher temperatures for the medium-sized Ni2P2S6 nanosheets (3–10k g) is unexpected. In mechanically-exfoliated systems, long–range order persists down to the two-layer limit and the ordering temperature shows a slight dependence on the layer number [78]. One may hence speculate that, while antiferromagnetism in medium-sized flakes of Ni2P2S6 is similar to the one in large nanosheets, its response is superimposed by a ferromagnetic feature arising from a decomposition product of unknown nature.
At last, we note that, despite indirect implications from Raman spectroscopy (see SI, figure S28), no clear indication for magnetic ordering is observed from SQUID measurements for any size of Mn2P2S6 nanosheets. The SQUID magnetometry on Mn2P2S6 nanosheets is hence not shown. We note, that the Mn2P2S6 nanosheets show a behaviour distinct from Fe2P2S6 and Ni2P2S6 in both the photo spectroscopic as well as in the magnetic response, which might be indicative for partial sample decomposition and will be addressed in more detail further below.
2.5. M2P2S6 nanosheets as anode material for Na-ion storage
To test the utility of the liquid-exfoliated nanosheets of each material type produced in this work, we combined all three fractions of Cascade 2 to obtain sufficient mass of material for testing as anodes for Na-ion storage. To this end, nanosheets are fabricated into CNT composite films by filtration and subsequently tested as sodium-ion battery anodes. We note that characterizing the performance of 2D materials for sodium storage is an additional metric to test the quality of exfoliation. This is because the theoretical capacity of a conversion anode material is defined by the elemental composition and the amount of storable Na per formula unit (f.u.). While a reaction mechanism generating Na2S as final product (total uptake of 12 Na/f.u) was shown for bulk M2P2S6 [44], the generation of Na3P (total uptake of 18 Na/f.u) often is postulated in literature for exfoliated and nanosheet samples [8, 22, 84, 85]. Assuming a reaction involving 18 Na/f.u. yields values of 1317, 1298 and 1325 mAh g−1 for Fe2P2S6, Ni2P2S6 and Mn2P2S6, respectively (see section 6 in the SI for further details) [84]. In addition, the ability to experimentally achieve near theoretical capacities generally requires a reasonable degree of exfoliation. Thus, the achievement of near theoretical sodium storage capacity from these materials would indicate their elemental purity as well as a high quality of the exfoliation itself.
In various previous reports, we have found that when Li-storing active materials are incorporated into electrodes in the form of 2D or quasi-2D particles, extremely high capacities can be achieved, especially if single-walled carbon nanotubes (SWNTs) are used as both conductive additive and polymeric binder [50, 71, 86–92]. Such an electrode architecture combines a highly conductive and mechanically strong SWNT network to facilitate charge delivery allowing the maximising of capacity, rate capability and cyclability [71, 88–92].
In this work, we used solution-mixed nanosheets for each of the three materials under study with 20 wt% SWNTs and vacuum filtration to form electrodes with an approximate thickness of 5 µm (M/A = 0.55 mg cm−1 [2]). As shown by a cross sectional SEM image in figure 5(A), the electrodes are uniform with the nanotubes being very well dispersed into the nanosheet network. In terms of electrochemical characterization, galvanostatic charge discharge curves (figure 5(B)) were measured in the potential range of 0.05–2.5 V in a half cell assembled with fresh sodium foil and found to largely behave as expected for the three metal thiophosphates (see SI, figure S29 for the first five cycles), revealing initial capacities of 1589, 1278, and 1290 mAh g−1 for Fe2P2S6, Ni2P2S6 and Mn2P2S6, respectively [84, 93]. We note that the contribution from CNTs to the electrode capacity is negligible as demonstrated in previous work [94]. The voltage profiles indicate sodium intercalation into M2P2S6 nanosheets (xNa + M2P2S6→ Nax M2P2S6), as expected for Fe2P2S6 and Ni2P2S6. Conversely, two separate potential plateaus are observed for Mn2P2S6 well below the intercalation potential observed for Fe2P2S6 and Ni2P2S6, indicating a multi-step intercalation process. The indistinct course of the discharge curve upon further discharging indicates a conversion reaction. Differential voltage plots reveal a reductive process near the cutoff potential of the discharge reaction, which is unexpected as this was neither observed for the bulk material, nor for exfoliated/nanosheet samples (see SI, figure S29) [8, 9, 44]. This behaviour may be induced by surface reactions due to the increased surface area of the few-layered nanosheets.
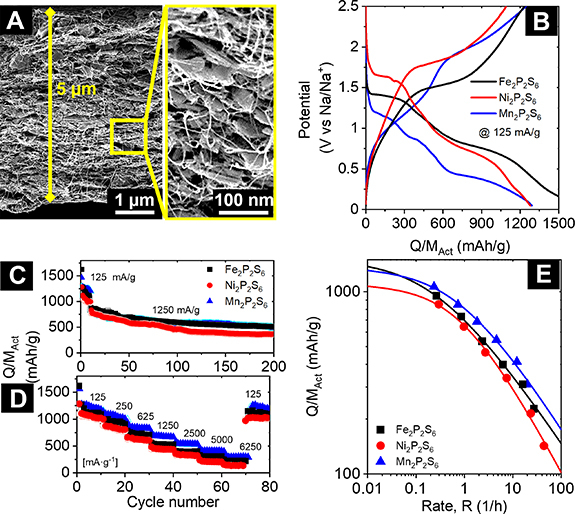
Figure 5. Electrochemical characterization of sodium-ion anodes based on M2P2S6/carbon nanotube composites (where M: Mn, Fe and Ni). (A) Cross-sectional SEM image of an electrode fabricated from a network of Mn2P2S6 nanosheets mixed with 20 wt% SWNTs. The zoomed-in image on the right side clearly shows that the nanotubes are well dispersed within the electrode. (B) Examples of galvanostatic charge–discharge curves for electrodes fabricated from each nanosheet type, each collected at a fixed current of 125 mA g−1. (C) Cycling stability data for each M2P2S6 nanosheet type. The first ten cycles were collected at 125 mA g−1 with subsequent cycles collected at 1250 mA g−1. (D) Rate performance data for each electrode type for increasing currents after each interval of 10 cycles. (E) Average capacity measured during each 10 cycle interval in (D) plotted against the parameter R which represents the charge discharge rate (R =I/Q). The solid lines are fits to (equation (2)).
Download figure:
Standard image High-resolution imageCycling stability measurements (figure 5(C)) show the falloff in capacity over the first few cycles, consistent with the formation of a solid electrolyte interface (SEI) layer. Subsequent cycling at higher rate showed reasonable stability albeit with some capacity fade. Rate performance measurements, shown in figure 5(D), show the expected reduction in capacity with increasing charge discharge current density. Although the constant current steps show some minor capacity fade, especially at low currents, these data show reasonable good stability and an almost complete return to the initial low-rate capacity after the rate performance test (i.e. cycles 70–80).
In contrast to investigations on bulk M2P2S6 anodes in SIBs, Na3P formation neither can be ruled out nor safely assumed based on the measured capacities. However, the obtained specific capacities point towards a discharge process, which is different from what is observed for bulk M2P2S6 anodes. Especially the rate performance measurements show intriguing results, as a high reversible sodium uptake is observed after high rates and multiple cycles (15.8, 14.3, and 17.2 Na/f.u @80th cycle for Fe2P2S6, Ni2P2S6 and Mn2P2S6, respectively), exceeding the amount of Na uptake needed for the discharge reaction in bulk anodes (12 Na/f.u). While this potentially indicates a reaction mechanism involving Nax P formation, other effects (besides formation of an irreversible SEI layer [84, 93, 95]) might as well be responsible for the enhanced capacities. Further investigations are necessary in order to unravel the reasons for these high reversible capacities by characterizing electronic and structural properties via sophisticated methods. This question is of particular interest for exfoliated nanosheet samples, as the formation of phosphites is controversially discussed in literature (for additional details, see SI, section 6) and often solely based on electrochemical performance [8, 22, 84, 85].
In this current work, our priority is to compare the experimentally achieved capacities to the theoretically predicted values. In all battery electrodes the measured capacity tends to fall off with increasing charge discharge current due to a combination of capacitive and diffusive limitations. This means that, in order to assess the ultimate performance of the battery electrode, it is necessary to measure its capacity at extremely low rate. Because such measurements can be extremely time-consuming, it is preferable to use a model to fit the capacity versus the rate data to extrapolate the capacity at extremely low rate. To this end, we use a semi-empirical equation proposed in previous work to fit the measured specific capacity ( ) versus the rate parameter,
  , which is defined via
  , i.e. the ratio of the current to the stored charge [96–100]:

Fitting yields three fit parameters:  ,
,  and
and  . Most important is
  , which represent the specific capacity (normalised to the active mass) at very low rate. Note that this parameter can be compared to the theoretical capacity. The other fit parameters are
  , which is the characteristic time associated with charge/discharge, and
  , a parameter which value indicates the dominance of diffusive (
 = 0.5) or capacitive/electrical (
 = 1) limitations on rate performance [96, 97, 99–101]. However, these are not relevant for the results presented in this work. As shown in figure 5(E), this equation fits the data extremely well. In fact, the obtained experimental values are very close to their theoretical counterparts. The data clearly shows that using liquid-exfoliated nanosheets combined with CNTs enables to reach a capacity that is on average 92% of the theoretical value expected for a electrochemical reaction consuming/releasing 18 Na/f.u. by Na2S and Na3P formation. This result highlights the quality of the nanosheets produced by liquid phase exfoliation and underlines their potential for applications.
2.6. Thermodynamic nanomaterial stability
As discussed in previous work on Ni2P2S6 [13], the nanomaterial can be prone to oxidation after its exfoliation, which is attributed to a significant increase of the effective surface area, as well as in plane scission events during exfoliation which results in unsaturated bonds. One way to prevent oxidation is to perform the exfoliation in inert atmosphere, as demonstrated in this work. The ability to exfoliate the material into nanosheets without any signs of oxidation (as demonstrated above) provides new opportunities to study their environmental stability after controlled exposure to ambient conditions. For this purpose, we study the change of the photo spectroscopic response of different nanosheet sizes at different temperatures for all three material systems.
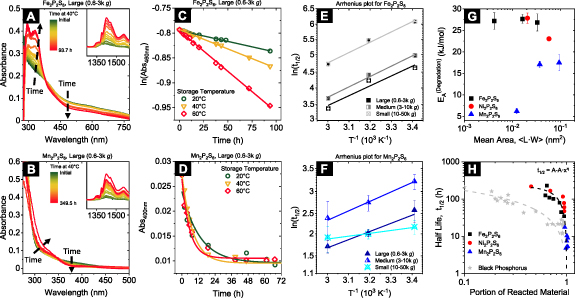
To this end, fresh nanosheet samples of different average sizes isolated after the second size selection cascade (i.e. 0.6–3k g, 'Large'; 3–10k g, 'Medium' and 10–50k g, 'Small') were stirred at 20, 40, and 60 °C, respectively. Absorbance, as well as extinction spectra of the dispersions were acquired at defined time intervals, which allows to study the change in the materials' optical response over time. To account for the potential impact of aggregation, samples were refreshed by short (∼3 min) bath sonication prior to the measurements [13, 41, 55]. As an example, the time-dependent absorbance spectra for large nanosheets of Fe2P2S6 and Mn2P2S6 are shown in figures 6(A) and (B), stirred at 40 °C. Extinction and absorbance spectra for all other nanosheet sizes and storage conditions are shown in the SI (see figures S30–38 for Fe2P2S6 and Mn2P2S6, for Ni2P2S6 see [13]). The spectra of both materials show systematic changes over time: for Fe2P2S6 (figure 6(A)), two or more additional features are formed in the UV-region (∼300 and 330 nm) over time for all temperatures under study. We consider this a clear indicator for oxidation as the oxides of all elements in the material stoichiometry tend to absorb in this wavelength region [102–106]. While the spectral profile in the low energy regime remains mostly unchanged, a systematic decrease of the overall optical density is observed. This can be attributed to material decomposition rather than aggregation as the latter would lead to an increase of the scattering background in the extinction spectra, which is not the case for both material systems (SI, figures S30–32 for Fe2P2S6 and figures S35–37 for Mn2P2S6) [67, 107]. We note that the changes of the spectral profile are more pronounced for elevated temperatures.
Figure 6. Time-dependent photo spectroscopic response of Fe2P2S6 and Mn2P2S6 nanosheets. (A), (B) Absorbance spectra of a fraction containing comparatively large nanosheets of Fe2P2S6 (A) and Mn2P2S6 (B) stored at 40 °C. Similar data for other nanosheet sizes and temperatures and for extinction spectra are shown in the SI (for Ni2P2S6, see [13]). The spectra show systematic changes over time, as indicated by the black arrows. (C) Plot of the natural logarithm of the absorbance at 460 nm of large Fe2P2S6 nanosheets for different storage temperatures. A linearization of the data is observed which implies that the material decomposition follows first order rate law kinetics. The lines are linear fits of the data. (D) Plot of the absorbance at 400 nm of large Mn2P2S6 nanosheets for different storage temperatures. The data is fitted to a single exponential function. (E), (F) Arrhenius-type plots for different sizes of Fe2P2S6 (E) and Mn2P2S6 (F) nanosheets. The half-lives are extracted from the fits in (C), (D) and SI, figure S25 and S29. (G) Size-dependent activation energy for the decomposition of Fe2P2S6, Ni2P2S6 and Mn2P2S6 nanosheets. Different sizes are represented by the nanosheet volume, calculated as the product of the average nanosheet dimensions (length, width, and thickness). (H) Nanosheet half-life as a function of the portion of reacted material both extracted from exponential fits of the decay kinetics. Only limited data is available, but the different materials seem to follow the same trend. The portion of reacted material is determined from extrapolation of the exponential trends. Data from previously reported exfoliation of black phosphorus (BP) is shown for comparison. Reproduced from [110]. CC BY 4.0. Note that the M2P2S6 species show longer half-lives compared to BP, but a larger fraction of the material seems to decompose over time in the solvent environment.
Download figure:
Standard image High-resolution image
To follow the material decomposition from changes in the time-dependent spectra, the optical density of a wavelength where no features or significant changes of the spectroscopic profile are observed is followed over time. This is the case at 460 nm in the case of Fe2P2S6 and at 400 nm for Mn2P2S6 nanosheets. For both materials, the intensity shows a systematic decrease of the optical density over time, which can be fit to a single exponential (see SI, figure S33). Note that the change is consistent with first order decomposition kinetics in the case of Fe2P2S6, as illustrated in figure 6(C) where a linearization is observed if the natural logarithm of the optical density of the nanosheets is plotted as a function of time (see SI, figure S34 for trends from both, extinction and absorption of all nanosheet sizes) [108]. Note that no linearization is observed for Mn2P2S6, which does not seem to follow any specific rate law behaviour. This could either be due to superimposed contributions from more than one process contributing to material decomposition or the overall relatively small changes of the Mn2P2S6 spectra over time (figure 6(D)). While the exponential fit of the changes observed for Mn2P2S6 nanosheets are thus a bit questionable, it can still be used to estimate a magnitude of the rate constant and a comparison of the different storage temperature. To achieve this, the macroscopic, size-dependent nanosheet half-live ( ) for both materials is extracted from the linear and exponential fits, respectively. We note that linear fitting requires less degrees of freedom compared to the exponential fit and is therefore more reliable (see SI, figure S38 for the exponential fitting of trends extracted from Mn2P2S6 nanosheet dispersions). The natural logarithm of this macroscopic half-life is shown as a function of the inverse storage temperature in an Arrhenius-type plot for all sizes of Fe2P2S6 (figure 6(E)) and Mn2P2S6 (figure 6(F)) [109]. The data for the individual nanosheet sizes can be fit to a linear trend which allows approximation of the activation energy,
  for the nanosheet decomposition. Despite the limited number of data points, linear fits with identical gradients are a reasonable approximation for the behaviour of all Fe2P2S6 nanosheet sizes (figure 6(E)). For Mn2P2S6, the large and medium-sized nanosheets show linear trends with a similar slope. However, the extracted activation energy for the smallest nanosheet size is significantly lower than for the large and intermediate size nanosheets. All results are summarised in table 2, together with the average nanosheet dimensions for each material and size-fraction.
Table 2. Average nanosheet dimensions and activation energy for their decomposition as extracted from linear fits in figures 6(E) and (F) respectively.  ,
,  ,
,  ,
,  ,
,  are the arithmethic means of the nanosheet lateral size, area, layer number, volume weighted layer number and the macroscopic activation energy for the material decomposition. Data for Ni2P2S6 is included from previous work for comparison [13]. The error given for size corresponds to the standard error of the mean, while the error in the activation energy is the error in the fit in figure 6.
 (nm) (nm) |
 ·102 (µm2) ·102 (µm2) |

|

|
 (kJ mol−1) (kJ mol−1) | |
|---|---|---|---|---|---|
| Fe2P2S6 (L) | 216.9 ± 6.9 | 3.3 ± 0.3 | 11.3 ± 0.5 | 20.7 ± 0.8 | 26.87 ± 1.99 |
| Fe2P2S6 (M) | 151.6 ± 4.6 | 1.6 ± 0.1 | 8.0 ± 0.3 | 16.8 ± 0.8 | 27.68 ± 1.05 |
| Fe2P2S6 (S) | 80.5 ± 2.6 | 0.4 ± 0 | 5.5 ± 0.2 | 9.9 ± 0.3 | 27.19 ± 1.93 |
| Ni2P2S6 (L) | 254.6 ± 10 | 5.8 ± 0.6 | 11.2 ± 0.5 | 23.4 ± 0.6 | 23.04 ± 0.33 |
| Ni2P2S6 (M) | 163.2 ± 5.1 | 2.1 ± 0.2 | 7.7 ± 0.3 | 12.0 ± 0.3 | 27.85 ± 1.19 |
| Mn2P2S6 (L) | 323.3 ± 10 | 9.5 ± 0.6 | 21.7 ± 0.7 | 37.5 ± 0.8 | 17.49 ± 1.89 |
| Mn2P2S6 (M) | 220.7 ± 5.7 | 3.7 ± 0.2 | 15.1 ± 0.5 | 20.9 ± 0.6 | 17.09 ± 0.74 |
| Mn2P2S6 (S) | 125.7 ± 4 | 1.2 ± 0.1 | 8.2 ± 0.3 | 12.6 ± 0.3 | 6.19 ± 0.6 |
Studying the size dependence of the activation energy is useful, as it contains information about the decomposition mechanism of the material. For instance, the observation of increasing activation energies with material size hints towards an edge-centred degradation mechanism and vice versa. The size (nanosheet area) dependence of the activation energy of the three materials is illustrated in figure 6(G). No obvious trend with material size is observed for Fe2P2S6, while the activation energy determined for Ni2P2S6 seems to decrease with increasing size and the opposite development is evident for Mn2P2S6 which indicates that different preferential decomposition mechanisms for the individual M2P2S6 species are occurring. However, it is important to keep in mind that the decomposition can include multiple stages and chemical products and further understanding requires an in-depth study that is beyond the scope of this work. Consequently, no specific mechanism can be determined from the data shown in figure 6(G) alone.
Beyond measurement of the decomposition activation energy, changes of the shape and peak position in the optical spectra can be tracked as a function of time and temperature to identify changes of the average material dimensions, which, using the metrics introduced above, can be interrogated to gain insights into the decomposition mechanism. For Fe2P2S6, a systematic red-shift and an increase of the wavelength ratio at 350/500 nm is observed, which indicates an increasing material thickness and simultaneously decreasing lateral dimensions (see SI, figure S39). This would be consistent with an edge-centred decomposition mechanism for Fe2P2S6. In contrast, Ni2P2S6 shows a red-shift of its excitonic transitions over time and a decrease of the wavelength ratio at 370/460 nm, consistent with an increase of both the average nanosheet length and thickness (see SI, figure S40). The decomposition behaviour of Ni2P2S6 does not imply a preferential mechanism but indicates that smaller and thinner nanosheets decompose faster than large and thick nanosheets, which is in line with previous results from XPS and EDX measurements on LPE Ni2P2S6 and further supports that the oxidation occurs simultaneously on edge sites, and the basal plane [13]. Note that no such analysis can be applied to Mn2P2S6 as the spectra are bereft of features and the overall changes of the spectral profiles are comparatively small.
In addition to changes of the materials' spectroscopic profile, a peak related to the water content in the sample intensifies over time at 1425 nm (see inset, figures 6(A) and (B)), which is a general observation for all samples exposed to the ambient atmosphere, and can be attributed to hygroscopicity of the dry CHP [110]. For further information on the role of water please see SI, Section 7.
While this demonstrates that already slight differences of the storage conditions can have a significant impact on the degradation behaviour, it also highlights the importance of a universal method to predict the sample stability. While the activation energy holds information about the energetic barrier for the sample decomposition (i.e. a temperature threshold), no information about the nanomaterial lifetime can be directly inferred from the activation energy itself, which is expected to change for different environmental parameters as well. Hence, to assess a material's potential in applications, it makes sense to discuss the time period that a certain mass of the nanomaterial lasts under typical conditions for further processing. A representative way to address this correlation is given in figure 6(H), where the macroscopic half-life of the nanosheets is plotted as a function of the portion of reacted material, which can be approximated by extrapolation of the observed trends to infinite timescales, as discussed in previous work [54, 110]. It is evident from the data that the completeness of the Fe2P2S6 decomposition depends more strongly on environmental effects and/or nanosheet sizes compared to Mn2P2S6, which were prepared and stored in similar conditions. This is implied by the clustering of all Mn2P2S6 data points on the right-hand position of the graph, indicating a complete decomposition with similar half-lives ( 5–20 h) independent of their size and storage conditions. This is not the case for Ni2P2S6 and Fe2P2S6, where a left-bending of the data towards lower portions of reacted material for longer lifetimes is observed, following an empirical power-law, as observed before. By combining all the data of the three M2P2S6 nanosheet species studied, sufficient data is obtained for a comparison to the decomposition of black phosphorus (shown in grey), which was assessed in previous work [110]. Note that the overall decomposition behaviour of the different M2P2S6 species may deviate from the cumulative fit if sufficient data is collected for the individual compounds, but, based on this comparison, the materials seem to be significantly less sensitive to ambient conditions compared to the layered phosphorus allotrope which is known to be particularly prone to environmental degradation [110–112].
3. Conclusion
In summary, the presented results demonstrate an additive free route for the exfoliation of three metal hexathiohypo diphosphates in inert atmosphere, which enables the study of the inherent nanomaterial properties, excluding contributions from oxidation. The initially polydisperse mixture of different nanosheet sizes and thicknesses was size-selected into fractions of narrowed size and thickness distributions, using cascade centrifugation. TEM measurements on the size-selected nanomaterial demonstrate high crystallinity and the expected elemental composition for the material in the fractions representative for large, intermediate, and small nanosheets. For each size-fraction, a statistical evaluation of the nanosheet size and thickness distribution was performed, revealing that all three materials show similar average nanosheet dimensions at the same average thickness, confirming the current understanding of LPE [38] that the anisotropy of the binding energy is the key factor determining the nanosheet morphology and hence the ease of exfoliation.
Furthermore, size-dependent optical properties are investigated by a combination of absorbance and extinction spectroscopy. All materials under study show similar changes, which allows to use empirical equations to quantitatively correlate the size and thickness information with peak intensity ratios and peak positions, respectively, to derive metrics for the average nanosheet size and thickness from photo spectroscopic measurements [13, 41, 42]. We find that the phenomenological shift rate of excitonic transitions scales with the bulk exciton resonance of the respective materials, in line with previously reported results on TMDs [41]. In addition, we find magnetic correlations of antiferromagnetic nanomaterials by a combination of cryo-Raman and magnetic susceptibility measurements in a wet chemical environment. We demonstrate the materials' application for energy storage in SIBs with near theoretical capacities. Both results emphasise the high crystal quality of the nanomaterials, which is an ideal starting point to study the materials' environmental stability. Photo spectroscopic measurements, acquired as a function of time and temperature, were used to determine the available timeframe for material processing, the approximate fraction of degraded material and the macroscopic activation energy for the nanomaterials' decomposition as a function of material size. We find indications for different preferential mechanisms for each material system and compare the materials' stability to black phosphorus. The latter seems to degrade faster, but less completely than the metal hexathiohypo diphosphates in the liquid environment. We note that the results on the material decomposition strongly suggest that the use of metal thiophosphates in catalytic applications might prove impractical.
This work represents an important basis for researchers interested in exploiting the optical, electrochemical, or magnetic properties of metal hexathiohypo diphosphate nanosheets. The results provided in this report can be used to guide experiments for fabrication of air sensitive nanosheets with intrinsic material properties. The electrochemical performance of the nanomaterials employed as anodes in experimental SIBs demonstrates the quality of the inert exfoliated nanomaterial and yields exceptional capacities with only minor capacity fade. The metrics and timescales for the decomposition do not only provide information about liquid-exfoliated M2P2S6 nanosheets, but the procedure can be transferred to other material systems, which demonstrates a universally applicable set of experiments to assess size-dependent properties and environmental material stability. We consider these results important as they enable comparison of fundamental material properties for compositionally and structurally different material systems and for different chemical environments [13, 38, 41, 113].
Acknowledgments
K S acknowledge financial support by the Deutsche Forschungsgemeinschaft (DFG) through SY 217/1-1. TEM access was supported by the Henry Royce Institute for Advanced Materials, funded through EPSRC grants EP/R00661X/1, EP/S019367/1, EP/P025021/1 and EP/ P025498/1. S J H, D J K and S S acknowledge financial support from EPSRC grants EP/M010619/1, EP/S021531/1, EP/P009050/1 the EPSRC Doctoral Prize Fellowship and the European Research Council (ERC) under the European Union's Horizon 2020 research and innovation programme (grant ERC-2016-STG-EvoluTEM-715502). DOT, NS and UW acknowledge financial support by the Deutsche Forschungsgemeinschaft (DFG) through WU 637/7-1. Z S was supported by ERC-CZ program (project LL2101) from Ministry of Education Youth and Sports (MEYS)
Data availability statement
All data that support the findings of this study are included within the article (and any supplementary files).
Experimental Methods
Experimental details are given in the Supporting information
Conflict of interests
The authors declare no competing financial interests.
Supplementary data (8.8 MB PDF)