

Abstract
We report the synthesis of pure and Fe-doped α-MnO2 nanowires by a facile hydrothermal method. The influence of iron with varying doping concentration on structural, optical and thermal properties of crystalline α-MnO2 nanowires is discussed. X-ray diffraction studies indicate that the synthesized nanowires have tetragonal structure and are in crystalline α-MnO2 phase with average crystallites size of 17.36 nm for pure α-MnO2 while 14.59 nm, 14.93 nm and 13.32 nm for 5 mol %, 10 mol % and 15 mol % Fe-doped α-MnO2, respectively. Scanning electron microscopy images show that the synthesized products have nanowire morphology with an average diameter of 38 nm for pure α-MnO2 and 28 nm for 5 mol % Fe-doped α-MnO2. In Fourier transform infrared spectra, the strong absorption band at 501 cm−1 and 699 cm−1 correspond to the bending and stretching vibration of Mn–O bond. Furthermore, Thermal gravimetric analysis indicates that Fe doping in MnO2 leads to the enhancement of its thermal stability. The broad absorption band of the UV–vis spectra appeared at 250 nm to 600 nm for pure α-MnO2 and at 250 nm to 700 nm for Fe-doped α-MnO2 nanowires is assigned to the d-d transition between lower t2g and higher eg of the metallic ions. For the first time we are reporting an indirect optical bandgap energy of 0.30 eV, 0.29 eV and 0.18 eV for different Fe-doped α-MnO2 samples.
Export citation and abstract BibTeX RIS
1. Introduction
One-dimension (1D) nanostructures are the most fascinating class of materials, exhibiting a wide range of physical and chemical properties. Since the advancement in instrumentation and experimental techniques, 1D nanostructure are widely explored in the field of catalysis, sensors, high temperature supercapacitors, dye-sensitized solar cells, memory storing devices, energy storing devices, microelectronics and optoelectronic devices [1–7]. Low-dimension manganese dioxide (MnO2) being a green and inexpensive material has attracted great interest in the scientific community. Besides environmental friendliness and low cost, MnO2 shows polymorphism in nature and can be found in α-, β-, γ-, δ-, λ- and ε- type phases [8–10]. When the basic octahedra (MnO6) linked in different manners by sharing edges and corners, it gives rise to these phases and offers numerous unique physical and chemical properties [11–15]. Nanostructured MnO2 has been studied in the field of sensors, catalysis, water purification, lithium ions batteries and in supercapacitors [16–19]. Metallic ion doping is an effective way to manipulate the physical and chemical properties of MnO2. Therefore, much efforts have been made to dope MnO2 with different metallic ions [20–22]. Poonguzhali et al studied the behaviour of Cu doping on the electrochemical performance of MnO2 nanostructure. They doped different concentration of cupper (Cu) in MnO2 and found that 0.1 M Cu-doped MnO2 nanostructure exhibit a very high specific capacitance of 583 Fg−1 at a constant current density of 10 Ag−1. Similarly, Hashem et al studied the thermal stability of α-MnO2, they reported that the thermal stability of α-MnO2 dramatically increases (from 500 °C to 900 °C) when doped with tin (Sn) and cobalt (Co) ion [23].
MnO2 is nonstoichiometric compound when doped with ferric ion. The introduction of ferric ion (Fe2+, Fe3+) in MnO2 may have impact on various properties including electromagnetic absorbance, electrochemical, dissolution, catalytic, dielectric and magnetic property. Duan et al studied the effects of Fe doping on dielectric properties of MnO2 and reported dramatic difference in the values of dielectric loss tangent ranging from 0.0583 to 0.093 56 for Fe doped MnO2 [24]. MnO2 is a preferred oxidizing agent for the removal of toxic contaminants (As3+, Pb2+) from drinking water. Chen et al reported that doping Fe3+ ion with MnO2 can tremendously decreases solubility of MnO2 (from 8454 to 4 micro grams per litre) in water [25]. Recent work by Li et al suggest that Fe doped MnO2 can deliver a high specific capacitance of 203 Fg−1 at a scan rate of 250 mA g−1 and a very good cycle retentivity of 83.8% after 1000 cycles [26]. Herein, we have synthesized crystalline α-MnO2 and different concentration Fe-doped α-MnO2 nanowires by a facile hydrothermal synthetic route and studied the influence of Fe doping on the structural, optical and thermal properties of α-MnO2 nanowires.
2. Materials and method
All the precursors and reagents were analytical grade and used as it as without further purification. Potassium permanganate (KMnO4), Ammonium peroxodisulphate ((NH4)2S2O8) and nitric acid (HNO3) were purchased from Sigma-Aldrich. Iron (II) sulphate heptahydrate (FeSO4.7H2O) were purchased from BDH Prolabo®. For the synthesis of α-MnO2 and Fe-doped α-MnO2 nanowires a facile hydrothermal synthetic route was adopted by the same way followed by Toufiq et al [27]. In a typical procedure, 22.1 mmol potassium permanganate were added in 70 ml D.I water and magnetically stirred for 10 min at room temperature. Followed by the addition of 0.8 ml nitric acid and 7.66 mmol of Ammonium peroxodisulphate and keep stirring for another 10 min to obtain a uniform solution. The prepared solution was then transferred to a 150 ml Teflon-lined autoclave and kept inside an oven at 180 °C for 20 h. When the reaction is completed, Teflon-lined autoclave were allowed to cool down to room temperature. The resultant solution was then centrifuged and washed 3 times with ethanol and several times with D.I water to get a PH value of 7. The final product was than dried in open air at 120 °C for 14 h and the sample was labelled as S1. The same procedure was carried out for the synthesis of Fe-doped α-MnO2 nanowires with the addition of varying concentration of Iron (II) sulphate heptahydrate during the stirring. A series of 3 Fe-doped α-MnO2 samples were synthesized in which the concentration of iron was varied using the precursor molar ratio and label as S2 (5 mol % Fe-doped α-MnO2), S3 (10 mol % Fe-doped α-MnO2) and S4 (15 mol % Fe-doped α-MnO2).
The crystal structure, crystallinity and phase of the obtained nanowires were primarily investigated by x-ray diffraction (PAN analytical X Pert Pro PMD) equipped with CuKα (λ = 0.154 06 nm) radiation. The study of chemical composition and morphology of the synthesized nanowires were carried out using Energy Dispersive x-ray diffractometer (MIRA3 TESCAN-EDX) and scanning electron microscopy (MIRA3 TESCAN-SEM). The Fourier Transform Infra-red spectrometer (JASCO, FT/IR-6600) was used for the study of functional group analysis. Variation in the thermal stability was recorded using thermal gravimetric analyser (Mettler Toledo, TGA-SDTA 851e). Moreover, optical property of the as-prepared nanowires was examined using UV–vis spectrophotometer (SPECORD 200 Plus).
3. Results and discussion
3.1. Structural properties and morphology
The phase purity and crystallinity of the obtained nanowires was investigated by x-ray Diffraction over a 2θ range of 10°–80° at a scan rate of 0.02° per second. Figure 1 displays the diffraction pattern of pure and different concentrations (5, 10 and 15 mol %) of iron doped α-MnO2 nanowires. The diffraction peaks at 2θ = 12.69°, 18.04°, 25.67° 28.76°, 36.49°, 37.52°, 38.78°, 41.94°, 47.23° 49.77°, 56.01°, 60.18°, 65.31°, 69.56°, 72.92° were assigned to the reflection of (110), (200), (220), (310), (400), (211), (330), (301), (510), (411), (600), (521), (002), (541) and (312) plane of tetragonal phase α-MnO2 (JCPDS No: 44-0141, space group 14/m 87). The sharp diffraction peaks demonstrate good crystallinity of the as-prepared nanowires. No peaks related to iron oxides or other phases of manganese oxides were detected, indicating the high purity of the obtained α-MnO2 nanowires. The standard lattice constant values for this system is a = b = 9.785 Å and c = 2.863 Å. Our calculated (table 1) lattice constants for pure α-MnO2 are in good agreement with these values.

Figure 1. x-ray Diffraction (XRD) pattern of S1 (pure α-MnO2), S2 (5 mol % Fe-doped α-MnO2), S3 (10 mol % Fe-doped α-MnO2) and S4 (15 mol % Fe-doped α-MnO2).
Download figure:
Standard image High-resolution imageTable 1. Lattice constants (a, b, c), Crystallites sizes (D), Strain (ε), Dislocation density (δ) and Crystallinity index (CI) of S1, S2, S3 and S4.
| Samples | a = b (Å) | c (Å) | D (nm) | ε × 10−3 (lines−2 m−4) | δ × 1014 (lines m−2) | CI (%) |
|---|---|---|---|---|---|---|
| S1 | 9.832 | 2.856 | 17.36 | 1.479 | 9.7392 | 75.5 |
| S2 | 9.851 | 2.858 | 14.59 | 1.424 | 9.0125 | 72.2 |
| S3 | 9.817 | 2.860 | 14.93 | 1.508 | 10.1373 | 71.8 |
| S4 | 9.834 | 2.863 | 13.32 | 1.540 | 10.5591 | 61.1 |
However, for doped samples, an increase in the lattice constants was observed due to incorporation of Fe3+ in α-MnO2 lattice. The radius of Fe3+ (0.55 Å) is comparable to that of Mn4+ (0.53 Å), therefore, iron can either substitute Mn4+ or occupy the large tunnel (4.6 Å) of α-MnO2, producing lattice defects and lowering the degree of crystallinity [28]. Crystallinity index (CI) is calculated using the method reported by Pardo et al [29].

Where Ac is the area under crystalline peaks and Aa is the area of amorphous hollows. The crystallinity index of Fe-doped α-MnO2 nanowires decreased from 75.5 to 61.1% by increasing the amount of iron added to α-MnO2 (table 1). The sample S4 (doped with 15 mol % of iron) has higher concentration of iron, therefore, exhibiting comparatively lower degree of crystallinity [30, 31]. The average crystallites sizes of the obtained nanowires were calculated using the Scherrer equation [32].

Here in this equation, 'D' is the crystallites size, 'K' is the Scherer constant, 'λ' is the wavelength of the x-ray sources, 'β' is the FWHM and 'θ' is the peak position. The average crystallites size calculated for S1, S2, S3 and S4 was found to be 17.36 nm, 14.59 nm, 14.93 nm and 13.32 nm respectively (table 1). Strain and dislocation density of the material are other important factors that can be calculated from XRD data [33, 34]. The values of strain (ε) and dislocation density (δ) for all the samples were calculated from (2 1 1) diffraction using the following relations and are tabulated in table 1 [35].


Where 'ε' is the strain, 'δ' is the dislocation density, 'β' is the FWHM, 'θ' is the peak position, 'D' is the crystallites size and 'a' is lattice constant. The value of strain and dislocation density was observed to increase by increasing the dopant concentration (table 1). Same phenomena was observed by Muthukumaran et al [36]. According to their report, decrease in crystallite size causes an increase in lattice strain and vice versa.
The chemical composition of α-MnO2 and Fe-doped α-MnO2 nanowires were carried out by EDX analysis. Figures 2(a), (b) show the EDX spectrum of S1 and S2, in both samples, the higher concentration of manganese (Mn) and oxygen (O) indicates that the main components of hydrothermally synthesized α-MnO2 nanowires are Mn and O.

Figure 2. (a) EDX spectrum of S1 (pure α-MnO2), (b) EDX spectrum of S2 (5 mol percent Fe-doped α-MnO2).
Download figure:
Standard image High-resolution imageThe potassium (K+) ions comes from the precursor used for the synthesis of α-MnO2 nanowires. Besides this, no other element as an impurity is detected. In figure 2(b), the presence of Fe confirms successful doping of iron in as-prepared Fe-doped α-MnO2 nanowires.
Hollandite type α-MnO2 is well famous due to its large (2 × 2) tunnel structure, therefore, it is extensively investigated among all the other phases [37]. The size of the tunnel is favourable for the accommodation of K+ ion. Therefore, during synthesis K+ ions occupy the tunnels of α-MnO2 (figure 3). Feng et al studied the alkali metal ions (Li+, Na+, K+) insertion/extraction mechanism in α-MnO2 and reported that, K+ can be extracted from α-MnO2 by treating it with highly concentrated nitric acid solution [38]. In contrast, Luo et al reported that acidic treatment can reduce the amount of K+ ions in α-MnO2 but it cannot be completely removed, because it helps in the formation and stabilization of tunnels [39]. Recently, rietveld refinement study of α-MnO2 was carried out by John et al [40]. According to their report, the tunnel structure of α-MnO2 is completely disfigured and collapses without the presence of K+ ions.

Figure 3. Demonstration of the crystal structure of α-MnO2, (Red) oxygen atoms, (Blue) manganese atoms, (Green) potassium atoms. (Atoms are not in actual scale).
Download figure:
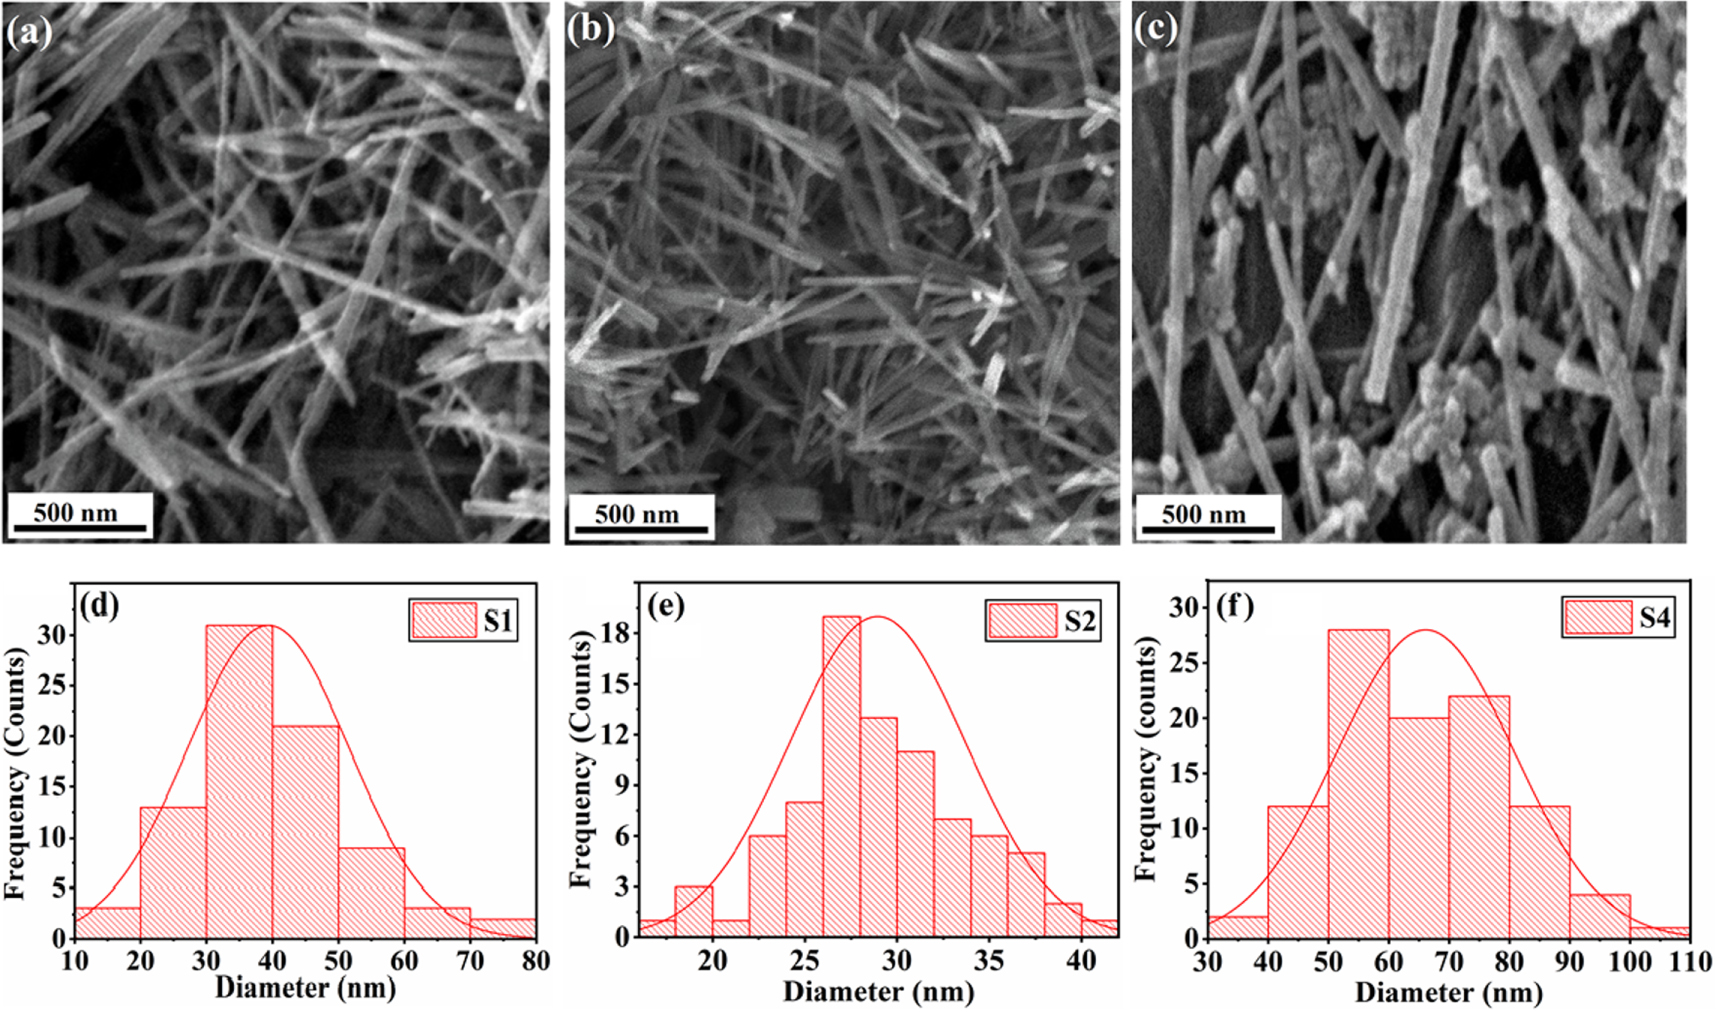
Standard image High-resolution imageThe morphology of pure and Fe-doped α-MnO2 were examine by SEM operating at 20.0 KV as shown in figures 4(a)–(c). The SEM images confirm the preparation of nanowires with average diameter of 38 nm, 28 nm and 64 nm for S1, S2 and S4 respectively. The diameters of nanowires were determined by particle size distribution histogram calculated through SEM images using ImageJ software as shown in figures 4(d)–(f). Among all the samples, S2 (figure 4(b)) has the smallest diameter and ultra-smooth morphology. Similarly, S4 (figure 4(c)) which is prepared with highest doping concentration has largest diameter along with agglomerated nanoparticles.
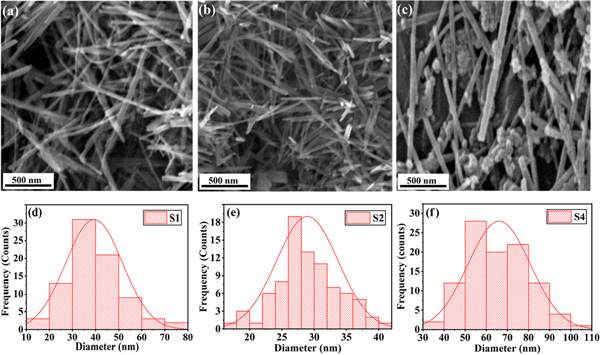
Figure 4. (a) SEM image of S1 (Pure α-MnO2), (b) SEM image of S2 (5 mol % Fe doped α-MnO2), (c) SEM image of S4 (15 mol % Fe doped α-MnO2), (d) Histogram of S1 (Pure α-MnO2), (e) Histogram of S2 (5 mol % Fe doped α-MnO2), (e) Histogram of S4 (15 mol % Fe doped α-MnO2).
Download figure:
Standard image High-resolution image3.2. Functional group analysis
Fourier Transform Infrared Spectroscopy (FTIR) was used for the analysis of functional group present in a sample. For our synthesized nanowire, FTIR spectroscopy was carried out over a spectral range of 500 cm−1 to 4000 cm−1. Figure 5 shows the typical FTIR spectrum of S1, S2 S3 and S4. The absorption band at 3228 cm−1, 1636 cm−1 and 1113 cm−1 belongs to hydroxyl group and could be assigned to the stretching, bending and vibration of O–H bond [41, 42]. The absorption band at 1415 cm−1 could be assigned to the bending vibration of Mn–O–H bond [43]. The spectrum obtained for S4 displays dominant absorption bands at various location corresponding to adsorbed water, indicating that, during the synthesis, Fe-doped α-MnO2 accrue large amount of water [41].

Figure 5. FTIR spectra of S1 (pure α-MnO2), S2 (5 mol % Fe-doped α-MnO2), S3 (10 mol % Fe-doped α-MnO2) and S4 (15 mol % Fe-doped α-MnO2).
Download figure:
Standard image High-resolution imageThe presence of adsorbed water was further confirmed by thermal gravimetric analysis study (figure 6) and was found that significant amount of water is accumulated in the tunnel of Fe-doped α-MnO2 [44]. The strong absorption bands at 501 cm−1 and 699 cm−1 correspond to the bending and stretching vibration of Mn–O bond [45].
3.3. Thermal properties
Thermal stability of the pure and Fe-doped α-MnO2 nanowires was studied in the temperature range of 50 °C to 1000 °C through Thermal Gravimetric Analysis (TGA). Temperature of the TG analyser was allowed to increase at the rate of 10 °C per minute in air. Figures 6(a), (b) shows the TGA and differential TG curve of the pure (S1) and highest concentration Fe-Doped α-MnO2 (S4) nanowires. In figure 6(a), the observed weight loss from 50 °C to 388 °C for both samples and it's corresponding broad endothermic peaks in figure 6(b) is due to evaporation and dehydration of the surface and trapped water inside the (2 × 2) tunnels [46]. The weight loss due to release of water was estimated to be 0.46% for S1 and 2.31% for S4. The sample S4 shows comparatively large amount of weight loss due to dehydration, this is analogy to the dominant hydroxyl peaks of S4 in FTIR results. The next 4.08% weight loss of S1 and 6.12% weight loss of S4 in TGA curve is due to the phase transformation from α-MnO2 to Mn2O3 by release of oxygen. This phase transformation can be observed in differential TG curve at 588 °C for S1 and at 598 °C for S4 [23]. The shift towards higher temperature region of S4 indicates that the doping of ferric ion enhances thermal stability of α-MnO2 nanowires in contrast to the previous work reported by Kingondu et al [47]. Reason behind thermal stability is that, the K+ work as stabilizing agent for the tunnel of α-MnO2 [48]. On the other hand, during the synthesis of α-MnO2 the introduction of transition metals increases the amount of K+ ions in the tunnels, which results in improved tunnel stability of α-MnO2 [49, 50]. Our EDX results also confirmed that, the amount of K+ increased in Fe-doped α-MnO2 compared to pure α-MnO2 (figure 2(b)).

Figure 6 (a): TGA curve of S1 (pure α-MnO2) and S4 (15 mol % Fe-doped α-MnO2), (b): DTG curve of S1 (pure α-MnO2) and S4 (15 mol % Fe-doped α-MnO2).
Download figure:
Standard image High-resolution imageThird and last observed weight lost in TGA curve is 1.46% for S1 and 0.69% for S4. The weight loss in this region of the curve is due to phase transformation from Mn2O3 to Mn3O4 by release of oxygen [51]. The endothermic peaks in differential TG curve appear at 780 °C for S1 and at 793 °C for S4 belongs to this phase transformation. Similar to previous phase transformation, at this stage Fe-doped α-MnO2 again exhibit comparatively higher thermal stability due to combine effect of ferric and potassium ions. Thus, from the TGA studies we confirmed that, doping of iron in α-MnO2 enhances its tunnel stability.
3.4. Optical properties
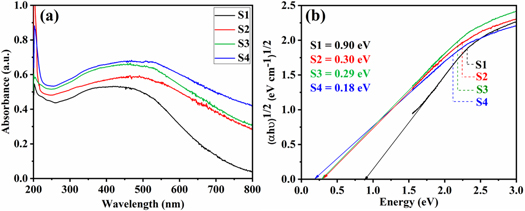
The optical absorption response of the as-prepared α-MnO2 nanowires was investigated in Ultraviolet-Visible (UV–vis) region of the electromagnetic spectrum. Figure 7(a) displays the absorption spectra obtained from pure and Fe-doped α-MnO2 nanowires.
Figure 7. (a): Absorbance spectra of S1 (pure α-MnO2), S2 (5 mol % Fe-doped α-MnO2), S3 (10 mol % Fe-doped α-MnO2) and S4 (15 mol % Fe-doped α-MnO2), (b): Tauc plot of S1 (pure α-MnO2), S2 (5 mol % Fe-doped α-MnO2), S3 (10 mol % Fe-doped α-MnO2) and S4 (15 mol % Fe-doped α-MnO2).
Download figure:
Standard image High-resolution image
A broad absorption band ranging from 250 nm to 600 nm with peak position at ∼450 nm was observed for S1 and broad absorption band ranging from 250 nm to 700 nm having peak position at ∼470, ∼464 and ∼490 nm was observed for S2, S3 and S4 respectively. The absorption in the visible region of the spectrum by α-MnO2 nanowires is due to the d-d transition between lower t2g and higher eg of the Mn ion [52]. The optical bandgap energy of α-MnO2 nanowires corresponds to the energy difference between these two states and can be estimated by using the Tauc relation [53].

Where K is an energy independent constant, hυ is the incident photon energy, α is the absorption coefficient and Eg is the optical bandgap energy of α-MnO2 nanowires. The exponent on the left-hand side of equation determines the nature of transition, it is 2 for allowed direct transition and ½ for allowed indirect transition [54]. Figure 7(b) shows a plotted graph of (αhυ)n verses hυ. The best fit for the curve at n = ½ was observed, which corresponds to an indirect optical bandgap energy of 0.90 eV, 0.30 eV, 0.29 eV and 0.18 eV for S1, S2, S3 and S4 respectively. MnO2 is an unusual semiconductor at normal conditions, sometimes it displays a bandgap as wide as 2.53 eV and sometimes as narrow as 0.2 eV [55, 56]. Some previously reported bandgap values are tabulated in table 2 in comparison with the values obtained in present work.
Table 2. Reported bandgap values of MnO2 nanostructures.
| S. No | Bandgap value (eV) | Reported by |
|---|---|---|
| 1 | 2.53 | Toufiq et al [57] |
| 2 | 2.41 | Li et al [58] |
| 3 | 1.65 | Toufiq et al [59] |
| 4 | 1.30 | Cockayne et al [60] |
| 5 | 0.909 | Liu et al [61] |
| 6 | 0.90 | Present work |
| 7 | 0.84 | Li et al [62] |
| 8 | 0.20 | Pereira et al [63] |
| 9 | 0.18 | Present work |
Our estimated bandgap values (0.90 eV) for pure α-MnO2 nanowires is in close approximation to the value (0.909 eV ) reported by Liu et al [61]. The reduction in energy level for Fe-doped α-MnO2 (S2, S3 and S4) can be attributed to the impurity level produced by Fe ion. Li et al [28] reported that, Al used as a dopant in MnO2 introduces impurity level resulting in the shortening of bandgap values. Similar reduction in the bandgap value was recently observed by AlFaify et al for Hg doped PbI2 nanostructure [64]. To the best of our knowledge, so far we have not found any report on the indirect bandgap energy of Fe-doped α-MnO2 nanowires. Herein, we report for the first time an indirect optical bandgap energy of 0.30 eV, 0.29 eV and 0.18 eV for 5 mol % Fe-doped α-MnO2, 10 mol % Fe-doped α-MnO2 and 15 mol % Fe-doped α-MnO2 nanowires respectively. Due to narrow and tuneable bandgap energy, Fe-doped α-MnO2 can be used in infrared detectors and could replace toxic lead and mercury detectors [65].
4. Conclusion
High quality 1D crystalline pure α-MnO2 and different concentration of Fe-doped α-MnO2 nanowires were synthesized by a facile hydrothermal technique. The XRD and EDX analysis confirmed tetragonal structure with crystalline α-MnO2 phase. The average crystallite size varied from 17.36 nm to 13.32 nm for pure and doped samples. The SEM images revealed nanowires morphology with average diameter of 38 nm, 28 nm and 64 nm for pure and Fe-doped α-MnO2 respectively. FTIR studies confirmed chemical bonding between manganese and oxygen in as-prepared α-MnO2 nanowires. Thermal studies through TGA suggest Fe-doped α-MnO2 are thermally more stable as compare to pure α-MnO2. Furthermore, the UV–vis studies and band gap variation from 0.90 eV to 0.18 eV make these synthesized α-MnO2 nanowires to be suitable candidate for promising applications in the field of infrared detectors.