
Abstract
This paper reports the compressive, morphological and surface hardness properties of almond skin powder reinforced polylactic acid (PLA) matrix based 3D printed functional prototypes prepared by fused filament fabrication (FFF) as biomedical scaffolds. In this study the 3D printed functional parts were subjected to compression, morphological and Shore D hardness investigations. The results of this study highlight that maximum compressive strength at peak (37.712 MPa), maximum compressive strength at break (33.93 MPa) and Young's modulus (387.80 MPa) was observed in case of sample printed at infill density 100%, infill angle 90° and infill speed 70 mm s−1 (as per ASTM D695). The maximum modulus of toughness as 3.47 MPa was observed in the case of printed sample at infill density 60%, infill angle 60° and infill speed 70 mm s−1. The results are supported by optical photomicrographs and Shore D hardness. Finally mathematical equations were developed (as empirical model) to predict different mechanical properties (based upon historical data approach) supported by Taguchi analysis.
Export citation and abstract BibTeX RIS

Original content from this work may be used under the terms of the Creative Commons Attribution 3.0 licence. Any further distribution of this work must maintain attribution to the author(s) and the title of the work, journal citation and DOI.
1. Introduction
Additive Manufacturing (AM) technologies have become a new standard in design due to product customization and fabrication [1]. Material extrusion process has widely adopted FFF technology for different polymers mainly due to its low cost and ease of use. The FFF form 3D geometries by layer by layer deposition of thermoplastics in form of extruded filament through nozzle for preparation of functional components [2]. The layer by layer deposition in FFF printed parts leads to mechanical disadvantages such lower elastic properties than injection moulded components and possible de-lamination effects, resulting in premature failure. So reinforcements are required for the enhancement of mechanical properties [3]. Also, recent studies reveal that mechanical properties can be improved with proper selection of optimal printing parameters in FFF [4–6]. It has been reported that reinforcement of almond skin powder (in different wt%) in polycaprolactone (PCL) leads to improvement in mechanical properties [7]. The significant gain in elastic modulus (17%) at 10 wt% particle loading was observed in comparison to 0% almond skin powder reinforcement. Also, the crystallinity of bio-composite was improved in comparison to virgin PCL [6, 7]. The almond skin reinforced PCL is being used commercially for packaging purpose being more environmental friendly material [8]. Some studies have reported that the addition of almond shell particles with urea formaldehyde resin resulted into reduced flexural properties as well as internal bond strength was decreased, but significant improvement in water resistance of the panels were recorded [9].
Natural fibres from plants and animals provides good tensile mechanical properties (e.g., strength, stiffness), when reinforced with economic and environmental friendly thermoplastic materials (such as PLA) in-terms of rapid renewability, low cost and worldwide availability [10, 11]. The reinforcement pattern, reinforcement distribution, print orientation and percentage of fibre affect the compressive properties of material. It has been reported that maximized compressive response was achieved with a 0.244 carbon fibre volume ratio, concentric and equidistant reinforcement configuration, resulting in a compressive modulus of 2.102 GPa and a compressive strength at proportional limit of 53.3 MPa [12]. Some researchers outlined that increase of infill density with sufficient no. of perimeters for outer wall, the compressive strength of the specimen increases significantly [13]. It has been observed that performance of 3D printed specimen is influenced by the forced air-cooling setup attached to the print head [14]. The impregnation quality of aramid fibre reinforced PLA influence the mechanical properties of 3D printed parts [15]. Compressive properties were affected by a reduction of infill density of 3D printed components. Nevertheless, insignificant differences were detected in the compressive properties at infill densities of 80 and 90%, which was possibly due to fibre reinforcement in the molecular structure of the acrylonitrile butadiene styrene (ABS) [16]. It has been reported that various input parameters (Infill density, layer thickness, shell thickness, print speed etc) are responsible for the significant changes in mechanical strength and dimensional accuracy of the printed specimens [17]. The compressive strength of 3D-printed PLA samples was reported to be increased with increase of infill density, however lower infill values significantly increases the building speed, and the time of printing the sample would be decreased [17]. In 3D printing of PLA, the optimised parameters based upon Taguchi method, were 0.05 mm of layer thickness, nozzle temperature of 199.8 °C and 45.1°. In addition, tensile strength of printed part was affected by layer thickness, while dimensional errors were caused by raster angle [18]. Some researchers have explored the influence of extrusion speed, deposition angle and infill speed in FFF [19].
It has been reported that hybrid high modulus (HM) carbon fibre composite have compressive strength with 30% more axial modulus than intermediate modulus (IM) carbon fibre composites for 3D printed functional parts [20]. Some researchers outlined that reinforced nylon parts have higher mechanical properties than the non-reinforced nylon parts [21]. The compressive strength of the 3D printed poly amide (PA)12 composite lattice structures with fibre-reinforcements is lower than that without fibre-reinforcements, but the repetitive energy absorption property of the 3D printed PA12 composites lattice structures with fibre-reinforcements are more stable than that without fiber-reinforcements [22]. With the reinforcement of carbon fibre composites the compression strength varies linearly with fibre volume loading and the reason of failure is the shear at approximately 45°∼ to the loading axis [23]. The abstract of 1.5 wt% of wood flour in phenolic foams provides a reinforced material with a compressive modulus and strength 130% and 154% more than unreinforced foam [24]. Compressive properties were found to be increased when alkali-treated bamboo fibres were used in the hybrid composites. Also, glass fibre content helps to increase the compressive property [25].
The literature reveals that the use of biodegradable/green waste enhances the mechanical properties and reduces the environmental pollution as well as cost [25–31]. But hitherto little has been reported on the use of the almond skin in powder form for enhancement of the compressive properties [13, 31–34]. In this study, composite of PLA and almond skin powder was subjected to compression test (as per ASTM D695), surface hardness (Shore D) investigation for possible use as biomedical scaffold as an extension of previously reported study [35] on preparation of feed stock filament for FFF.
2. Materials and methods
The compressive test was carried out as perASTM D695standard. The test specimen geometry was prepared using a computer aided design (CAD) software, exported as a stereolithography file (STL) and STL file was imported into the slicing software (Repetier -Host v0.95 f) for the fabrication (slicing) of 3D model. Test specimens were printed using input printing parameters like: infill density, infill angle, infill speed (based upon trial runs). The aim of present study was to maximize compressive properties, by analysing, which factors and levels combinations have a statistical significant effect on the outputs compressive strength and Young's (compressive) modulus. The 3D compressive specimens were tested for load at peak, load at break, deformation at peak, deformation at break, Young's modulus (compressive modulus), modulus of toughness, surface characteristics. The methodology used for the current investigation is shown in figure 1.
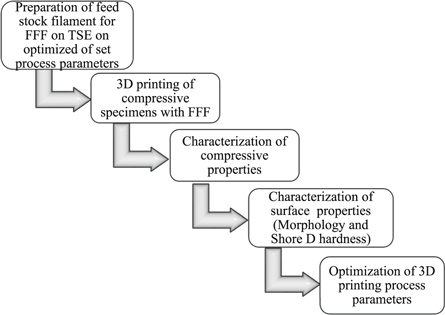
Figure 1. Methodology adopted for present study.
Download figure:
Standard image High-resolution image3. Experimentations
The previous reported study clearly reveals that the reinforcement of almond skin 2.5% by weight in PLA gives optimized mechanical properties [35]. Based on the optimised composition/proportion of reinforced almond skin 2.5% by weight in PLA matrix, it was used for the fabrication of feed stock filament through TSE at predefined input parameters (extrusion temperature of 190 °C, torque 0.3 Nm, and 10 kg load). As per nozzle size of FFF setup available, specific dimensions of feed stock filament diameter was 1.75 ± 0.05 mm. The scanning electron microscopy (SEM) was used to capture images of feed stock filament prepared by TSE at cross-section followed by energy dispersive spectroscopy (EDS) analysis (figure 2).
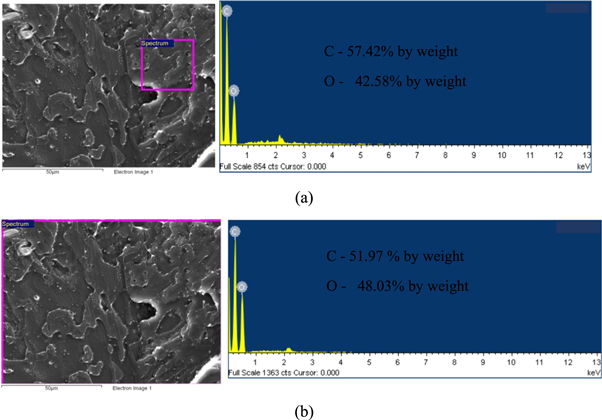
Figure 2. SEM images with EDS of filament (a) Spectrum 1, (b) Spectrum 2.
Download figure:
Standard image High-resolution imageFigure 2 shows almost similar dispersion of reinforcement (almond skin) in PLA matrix (as observed from two different spectrum used for analysis). Further the spectrum window used for EDS analysis was processed on image processing software to get 3D rendered image and surface roughness (Ra) profile (figure 3). As observed from figure 3 the Ra value at cut-off length of 0.05 mm lies in close range thus ensures uniform dispersion of reinforcement in PLA matrix.
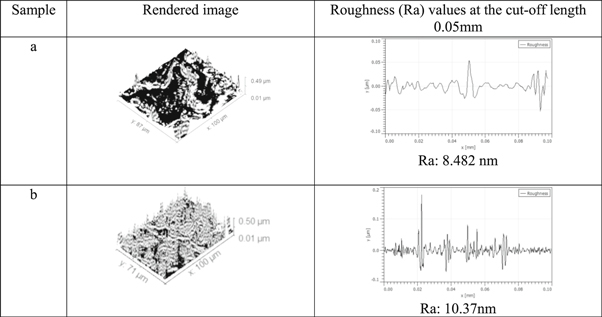
Figure 3. 3D rendered image and Ra profile at cut-off length of 0.05 mm.
Download figure:
Standard image High-resolution imageThe specimens of 12.7 mm diameter and 25.40 mm of length were 3D printed with FFF and tested in accordance with standard ASTM D695. The standard dimensions and 3D printed part after compressive testing is shown in figures 4 and 5 respectively.
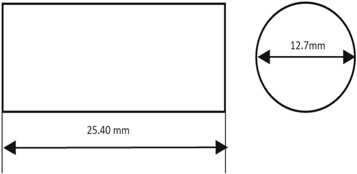
Figure 4. Compressive specimen dimensions [mm].
Download figure:
Standard image High-resolution image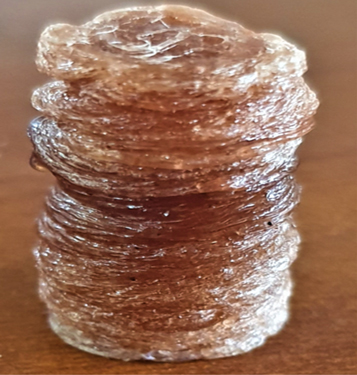
Figure 5. 3D printed compressive test specimen (after testing).
Download figure:
Standard image High-resolution imageTo study the output of compressive testing (like: load at peak, load at break, deformation at peak, deformation at break, compressive strength at peak, compressive strength at break, Young's modulus (compressive modulus), modulus of toughness)universal testing machine (UTM) (Make: Shanta Engineering, Pune, India) of 20000 N capacity at speed of 100 mm min−1 was used. Analysis of variance (ANOVA) tool in Minitab 17 statistical software was used, for the further optimization of compressive test outputs. 3D printing of specimens of compressive test was done by varring different printing parameters (table 1). The compressive properties of functional prototypes printed were optimised by using design of experiment (DOE) based upon Taguchi L9 orthogonal array as shown in table 2 .
Table 1. Variable and fixed input parameters of FFF.
| Input parameters of FDM used as variables | ||
|---|---|---|
| Infill density (3 levels) | Infill angle (3 levels) | Infill speed (3 levels) |
| (a) 60% | (a) 45° | (a) 50 mm s−1 |
| (b) 80% | (b) 60° | (b) 70 mm s−1 |
| (c) 100% | (c) 90° | (c) 90 mm s−1 |
Table 2. DOE based on Taguchi L9 OA.
| Sample no. | Infill density | Infill angle | Infill speed |
|---|---|---|---|
| 1 | 60% | 45° | 50 mm s−1 |
| 2 | 60% | 60° | 70 mm s−1 |
| 3 | 60% | 90° | 90 mm s−1 |
| 4 | 80% | 45° | 70 mm s−1 |
| 5 | 80% | 60° | 90 mm s−1 |
| 6 | 80% | 90° | 50 mm s−1 |
| 7 | 100% | 45° | 90 mm s−1 |
| 8 | 100% | 60° | 50 mm s−1 |
| 9 | 100% | 90° | 70 mm s−1 |
3.1. Static parameters used in this study are
- (1)Bed temperature: 65 °C
- (2)Nozzle diameter: 0.5 mm
- (3)Fan output: 50%
- (4)Number of parameters: 4
4. Results and discussion
The specimens in this study were tested on UTM and load-displacement as well as stress –strain curves were analysed to investigate the effect of different fabrication variables on the mechanical properties of the specimens. The mechanical properties obtained from the compressive test in term of load at peak, load at break, deformation at peak, deformation at break, compressive strength at peak, compressive strength at break, Young's modulus (compressive modulus), modulus of toughness are shown in table 3. It should be noted that diameter of specimen was 12.70 mm, grip separation 25.40 mm and area of cross section was 126.67 mm2. The results of compressive test performed with 9 specimens (with three repetitions) based on Taguchi L9 O.A is shown in table 3. It has been observed from the compressive test result that, the maximum compressive strength at peak (37.712 MPa) and maximum compressive strength at break (33.93 MPa) observed in sample no. 9, which was printed at infill density 100%, infill angle 900 and infill speed 70 mm s−1. Also, the maximum Young's modulus (compressive modulus) was observed in sample no. 9, with a value of 387.80 MPa. T he maximum value of modulus of toughness (3.47 MPa), was observed in the case of sample no. 2, which was printed at infill density 60%, infill angle 60° and infill speed 70 mm s−1. Figure 6 shows stress strain curve (based upon table 3). Further figure 7 shows 3D view of specimens after compressive testing.
Table 3. Observations for mechanical properties (Compressive).
| Sample no. | Load at peak (N) | Load at break (N) | Deformation at peak (mm) | Deformation at break (mm) | Compressive strength at peak (MPa) | Compressive strength at break (MPa) | Young's modulus (MPa) | Modulus of toughness (MPa) |
|---|---|---|---|---|---|---|---|---|
| 1 | 3270 ± 12 | 2943 ± 11 | 2.85 ± 0.5 | 3.42 ± 0.45 | 25.815 ± 2.3 | 23.23 ± 2.1 | 230.07 ± 2.5 | 1.56 ± 0.5 |
| 2 | 3275 ± 15 | 2947 ± 14 | 4.94 ± 0.9 | 7.60 ± 0.8 | 25.854 ± 2.0 | 23.26 ± 1.98 | 132.93 ± 1.3 | 3.47 ± 0.7 |
| 3 | 2731 ± 10 | 2458 ± 9 | 2.85 ± 0.4 | 3.80 ± 0.4 | 21.55 ± 1.89 | 19.40 ± 1.8 | 192.05 ± 1.7 | 1.45 ± 0.2 |
| 4 | 2314 ± 8 | 2083 ± 8 | 1.90 ± 0.2 | 4.18 ± 0.3 | 18.26 ± 1.3 | 16.44 ± 1.1 | 244.107 ± 3.2 | 1.35 ± 0.2 |
| 5 | 3318 ± 13 | 2986 ± 12 | 2.47 ± 0.5 | 3.99 ± 0.4 | 26.19 ± 1.78 | 23.57 ± 1.7 | 166.72 ± 1.8 | 1.85 ± 0.4 |
| 6 | 1897 ± 9 | 1707 ± 8 | 4.18 ± 0.9 | 4.18 ± 0.8 | 14.97 ± 0.89 | 13.47 ± 0.7 | 90.96 ± 0.8 | 1.108 ± 0.1 |
| 7 | 4689 ± 16 | 4220 ± 15 | 3.42 ± 0.8 | 3.42 ± 0.7 | 37.017 ± 2.1 | 33.314 ± 1.6 | 274.92 ± 2.7 | 2.24 ± 0.3 |
| 8 | 4703 ± 13 | 4233 ± 12 | 2.66 ± 0.3 | 2.66 ± 0.3 | 37.127 ± 1.9 | 33.417 ± 1.5 | 354.52 ± 3.1 | 1.74 ± 0.4 |
| 9 | 4777 ± 14 | 4299 ± 12 | 2.47 ± 0.3 | 2.47 ± 0.3 | 37.712 ± 1.8 | 33.93 ± 1.4 | 387.80 ± 3.2 | 1.64 ± 0.3 |
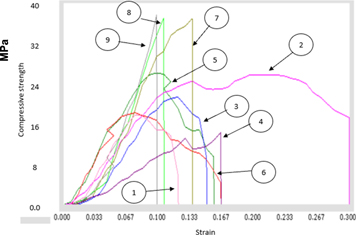
Figure 6. Stress versus strain curve (as per table 2).
Download figure:
Standard image High-resolution image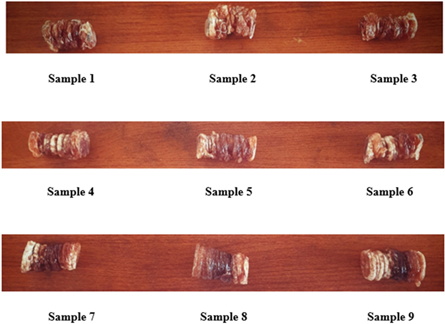
Figure 7. 3D printed compressive test specimens after compression test (as per table 2).
Download figure:
Standard image High-resolution image4.1. Optimization of process parameters
For optimisation of the input parameters signal to noise (SN) ratio has been calculated as shown in table 4. The SN ratio for large is better type case has been calculated as:

Where: η is SN ratio, n is the no. of experiment and y is the material properties at experiment no. k.
Table 4. SN ratios for different mechanical properties (based upon table 3).
| Sample No. | SN ratio of load at peak | SN ratio of load at break | SN ratio of deformation at peak | SN ratio of deformation at break | SN ratio of compressive strength at peak | SN ratio of compressive strength at break | SN ratio of Young's Modulus (compressive modulus) | SN ratio of modulus of toughness |
|---|---|---|---|---|---|---|---|---|
| 1 | 70.2910 | 69.3758 | 9.0969 | 10.6805 | 28.2374 | 27.3210 | 47.2372 | 3.8625 |
| 2 | 70.3042 | 69.3876 | 13.8745 | 17.6163 | 28.2506 | 27.3322 | 42.4725 | 10.8066 |
| 3 | 68.7264 | 67.8116 | 9.0969 | 11.5957 | 26.6689 | 25.7560 | 45.6683 | 3.2274 |
| 4 | 67.2873 | 66.3738 | 5.5751 | 12.4235 | 25.2300 | 24.3180 | 47.7516 | 2.6067 |
| 5 | 70.4175 | 69.5018 | 7.8539 | 12.0195 | 28.3627 | 27.4472 | 44.4398 | 5.3434 |
| 6 | 65.5613 | 64.6447 | 12.4235 | 12.4235 | 23.5044 | 22.5874 | 39.1770 | 0.8908 |
| 7 | 73.4216 | 72.5062 | 10.6805 | 10.6805 | 31.3680 | 30.4525 | 48.7841 | 7.0050 |
| 8 | 73.4475 | 72.5330 | 8.4976 | 8.4976 | 31.3938 | 30.4793 | 50.9928 | 4.8110 |
| 9 | 73.5831 | 72.6673 | 7.8539 | 7.8539 | 31.5296 | 30.6117 | 51.7722 | 4.2969 |
On the basis of table 4 and figure 8 shows the main effect plots of SN ratio on compressive properties of 09 set of samples. As observed from figure 8 the best setting of input parameters for load at peak, load at break, strength at peak and strength at break are: infill density 100%, infill angle 60° and infill speed 90 mm s−1. Whereas best settings of input parameters for deflection at peak (infill density 60%, infill angle 60° and infill speed 50 mm s−1), deflection at break (infill density 60%, infill angle 60° and infill speed 70 mm s−1), Young's modulus (infill density 100%, infill angle 45° and infill speed 70 mm s−1) and modulus of toughness (infill density 60%, infill angle 60° and infill speed 70 mm s−1) are different. Therefore in order to understand the reason for proposed settings analysis of variance (ANOVA) was conducted for various SN ratios of compressive test results. The ANOVA (for SN ratios of load at peak) and ranking table for input parameters of load at peak are shown in tables 5 and 6 respectively. Further ANOVA for SN ratios of other outputs and ranking tables are shown in appendix A (tables A1–A14).
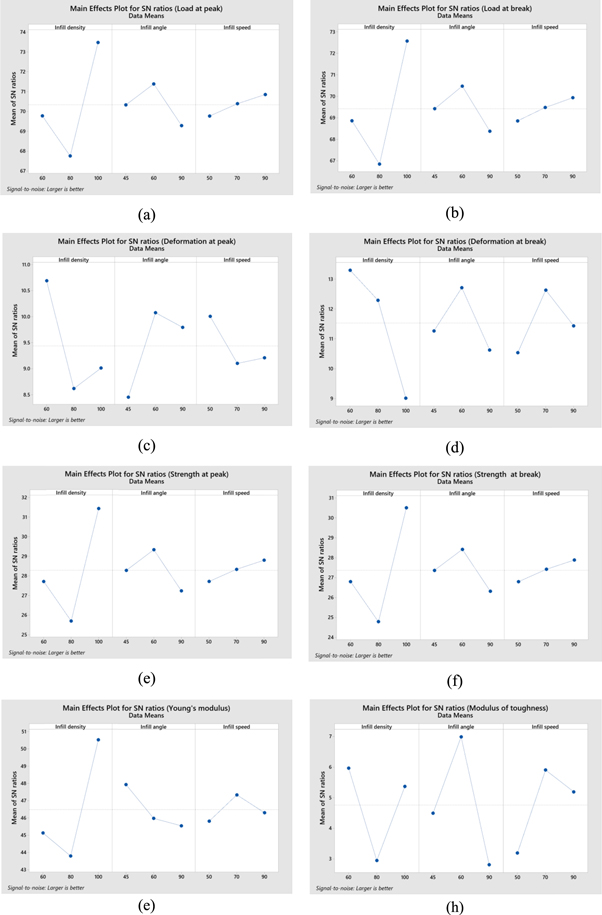
Figure 8. Main effects plots of SN ration for compressive properties (a) load at peak, (b) load at break, (c) deflection at peak, (d) deflection at break, (e) compressive strength at peak, (f) compressive strength at break, (g) young's modulus(compressive modulus), (h) modulus of toughness.
Download figure:
Standard image High-resolution imageTable 5. ANOVA for SN ratios of load at peak.
| Source | DoF | SS | Adj. SS | Adj. MS | F | P | %C |
|---|---|---|---|---|---|---|---|
| Infill density | 2 | 50.658 | 50.658 | 25.3289 | 9.42 | 0.096 | 0.786 |
| Infill angle | 2 | 6.612 | 6.612 | 3.3058 | 1.23 | 0.449 | 0.102 |
| Infill speed | 2 | 1.791 | 1.791 | 0.8953 | 0.33 | 0.750 | 0.0277 |
| Residual Error | 2 | 5.379 | 5.379 | 2.6893 | 0.0834 | ||
| Total | 8 | 64.439 |
Note. DoF: Degree of freedom. SS: Sequential sum of squares. Adj. SS: Adjusted sum of squares, Adj. MS: Adjusted mean of squares, F: Fisher's value, P: Probability, %C: Percentage contribution
Table 6. Ranking table for SN ratios of load at peak (Larger is better).
| Level | Infill density | Infill angle | Infill speed |
|---|---|---|---|
| 1 | 69.77 | 70.33 | 69.77 |
| 2 | 67.76 | 71.39 | 70.39 |
| 3 | 73.48 | 69.29 | 70.86 |
| Delta | 5.73 | 2.10 | 1.09 |
| Rank | 1 | 2 | 3 |
As observed from tables 5–A14 for almost all output parameters no input parameters are significant as P > 0.05 (at 95% confidence level), so various models (like: two factor integration(2FI), quadratic models) were applied on the outputs with Design expert 12 software package by using historical data approach (appendix B). Based on tables B1–B8, final equations (2)–(9) in term of factors are given as:


Note—A- Infill density, B- Infill angle, C- Infill speed.
Based upon tables B1–B8 (appendix B) cube plots were drawn to observe the interaction of three input parameters with all the outputs obtained from the compressive tests (figure 9).
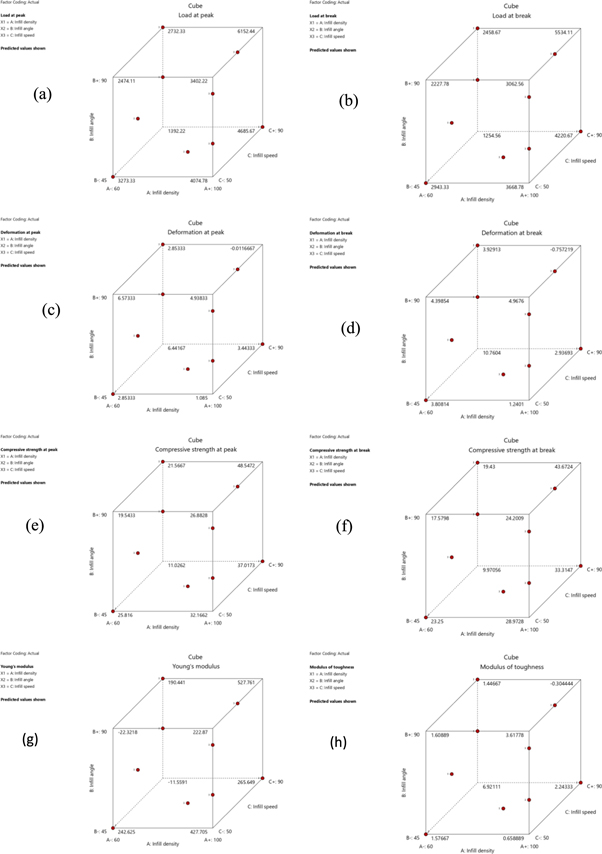
Figure 9. Cube plots for: (a) load at peak, (b) load at break, (c) deformation at peak, (d) deformation at break, (e) compressive strength at peak, (f) compressive strength at break, (g) young's modulus, (h) modulus of toughness.
Download figure:
Standard image High-resolution imageFurther to predict the load at peak with respect to different input process parameters, based on table 6, following formula has been used:

βopt = optimum SN ratio value for load at peak, u = overall mean of SN ratios, uA3 = mean of SN ratios for infill density at level 3, uB2 = mean of SN ratios for infill angle at level 2, uC3 = mean of SN ratios for infill speed at level 3,

The predicted value of load at peak can be achieved by using the below mentioned formula (equation (12))

Putting the value of βopt (equation (11)) in the equation (12), 

The predicted settings for other outputs in compressive test based on ASTM D695 standard (as per tables A1–A14) are shown in table 7.
Table 7. Predicted settings for different outputs (as per tables A1–A14).
| Load at peak (N) | Load at break (N) | Deformation at peak (mm) | Deformation at break (mm) | Compressive strength at peak (MPa) | Compressive strength at break (MPa) | Young's modulus (MPa) | Modulus of toughness (MPa) |
|---|---|---|---|---|---|---|---|
| 5668.91 | 5093.30 | 3.94 | 6.011 | 44.71 | 41.20 | 437.01 | 2.92 |
The Shore duro-meter (Shore D hardness tester) was used for the measurement of hardness of polymer/composite material (table 8). As observed from table 8, sample no. 9 with maximum compressive strength at peak (37.712 MPa), maximum compressive strength at break (33.93 MPa) and maximum Young's modulus (387.80 MPa) (as per table 3) shows the maximum hardness (79.5 Shore D) which is highest hardness among all the 9 samples. The observations of Shore D hardness are in line with the compressive test results.
Table 8. Observed values of average Shore D hardness.
| Sample No. | Average surface hardness |
|---|---|
| 1 | 69 ± 1.0 |
| 2 | 70 ± 0.5 |
| 3 | 71 ± 1.0 |
| 4 | 68.5 ± 1.5 |
| 5 | 70 ± 1.0 |
| 6 | 68 ± 1.0 |
| 7 | 75 ± 1.5 |
| 8 | 72.5 ± 1.0 |
| 9 | 79.5 ± 1.5 |
The photomicrographs of compressed samples have been taken on tool maker microscope at × 30 magnifications (figure 10). The tool maker microscopic images clearly show the deformed portion of the samples under compressive load. As a matter of fact sample with better Young's/compressive modulus (Sample no. 9, table 4) should have less deformation in comparison to sample with sample with small value of Young's/compressive modulus (Sample no.6, table 3), which can clearly ascertained from figure 10.

Figure 10. Photomicrographs of compressive tested 9 samples (as per table 2).
Download figure:
Standard image High-resolution imageIn order to quantify the deformation under compressive loads the optical photo micro-graphic images were processed with image processing software to get 3D rendered images and Ra profile (figure 11).

Download figure:
Standard image High-resolution image
Figure 11. 3D rendered image and Ra profiles of specimens (as per table 2).
Download figure:
Standard image High-resolution image
As observed from figure 11, the Ra value of surface after compression testing is minimum for sample no.9 (having highest Young's/compressive modulus) and maximum for sample no. 6 (having lowest Young's/compressive modulus) which are in line observations of mechanical properties (table 3).
5. Conclusions
Following are the conclusions from the study: -
- 1.The maximum compressive strength at peak (37.712 MPa), compressive strength at break (33.93 MPa), Young's modulus/ compressive modulus(387.80 MPa) and surface hardness (79.5 Shore D)was observed for 3D printed almond skin powder reinforced PLA matrix based functional prototype prepared at infill density 100%, infill angle 90° and infill speed 70 mm s−1. Hence sample 9 (as per table 2) may be considered as best candidate for 3D printed structure (just similar to laminated material) for applications requiring better resistance properties.
- 2.As regard to the modulus of toughness, sample no. '2' has highest value among all the 9 samples (mainly because of high value of strain at break), whereas 6th sample has the lowest value of modulus of toughness. Therefore sample no. 2 may be used for the crash applications.
- 3.Finally the empirical relations for different mechanical properties have been developed in form of coded equations (based upon historical data approach) along with prediction of different mechanical properties (based upon Taguchi analysis). The empirical relations in form of coded equations resulted into significant model terms (tables B1–B8) at 95% significant level.
Acknowledgments
The authors are thankful to Manufacturing Research Lab (Department of Production Engineering), Guru Nanak Dev Engineering College, Ludhiana, for providing research facilities and SERB under AISTDF Seretariat (File No. IMRC/AISTDF/R&D/P-10/2017, Dated 01-02-2018) for financial support.
Appendix. A
Table A1. ANOVA for SN ratios of load at break.
| Source | DoF | SS | Adj SS | Adj MS | F | P | %C |
|---|---|---|---|---|---|---|---|
| Infill density | 2 | 50.660 | 50.660 | 25.3300 | 9.42 | 0.096 | 0.786 |
| Infill angle | 2 | 6.612 | 6.612 | 3.3062 | 1.23 | 0.448 | 0.102 |
| Infill speed | 2 | 1.791 | 1.791 | 0.8955 | 0.33 | 0.750 | 0.0277 |
| Residual Error | 2 | 5.377 | 5.377 | 2.6885 | 0.083 | ||
| Total | 8 | 64.440 |
Table A2. Response table for SN ratios of load at break (Larger is better).
| Level | Infill density | Infill angle | Infill speed |
|---|---|---|---|
| 1 | 68.86 | 69.42 | 68.85 |
| 2 | 66.84 | 70.47 | 69.48 |
| 3 | 72.57 | 68.37 | 69.94 |
| Delta | 5.73 | 2.10 | 1.09 |
| Rank | 1 | 2 | 3 |
Table A3. ANOVA for SN ratios of deformation at peak.
| Source | DoF | SS | Adj SS | Adj MS | F | P | %C |
|---|---|---|---|---|---|---|---|
| Infill density | 2 | 7.266 | 7.266 | 3.6328 | 0.19 | 0.839 | 0.14 |
| Infill angle | 2 | 4.517 | 4.517 | 2.2585 | 0.12 | 0.894 | 0.088 |
| Infill speed | 2 | 1.464 | 1.464 | 0.7318 | 0.04 | 0.963 | 0.028 |
| Residual Error | 2 | 37.952 | 37.952 | 18.9758 | 0.741 | ||
| Total | 8 | 51.198 |
Table A4. Response table for SN ratios of deformation at peak (Larger is better).
| Level | Infill density | Infill angle | Infill speed |
|---|---|---|---|
| 1 | 10.689 | 8.451 | 10.006 |
| 2 | 8.618 | 10.075 | 9.101 |
| 3 | 9.011 | 9.791 | 9.210 |
| Delta | 2.072 | 1.625 | 0.905 |
| Rank | 1 | 2 | 3 |
Table A5. ANOVA for SN ratios of deformation at break.
| Source | DoF | SS | Adj SS | Adj MS | F | P | %C |
|---|---|---|---|---|---|---|---|
| Infill density | 2 | 30.140 | 30.140 | 15.070 | 1.55 | 0.391 | 0.47 |
| Infill angle | 2 | 6.862 | 6.862 | 3.431 | 0.35 | 0.739 | o.108 |
| Infill speed | 2 | 6.644 | 6.644 | 3.322 | 0.34 | 0.745 | 0.105 |
| Residual Error | 2 | 19.390 | 19.390 | 9.695 | 0.307 | ||
| Total | 8 | 63.035 |
Table A6. Response table for SN ratios of deformation at break (Larger is better).
| Level | Infill density | Infill angle | Infill speed |
|---|---|---|---|
| 1 | 13.297 | 11.262 | 10.534 |
| 2 | 12.289 | 12.711 | 12.631 |
| 3 | 9.011 | 10.624 | 11.432 |
| Delta | 4.287 | 2.087 | 2.097 |
| Rank | 1 | 3 | 2 |
Table A7. ANOVA for SN ratios of compressive strength at peak.
| Source | DoF | SS | Adj SS | Adj MS | F | P | %C |
|---|---|---|---|---|---|---|---|
| Infill density | 2 | 50.704 | 50.704 | 25.3522 | 9.41 | 0.096 | 0.78 |
| Infill angle | 2 | 6.624 | 6.624 | 3.3118 | 1.23 | 0.449 | 0.102 |
| Infill speed | 2 | 1.789 | 1.789 | 0.8943 | 0.33 | 0.751 | 0.0277 |
| Residual Error | 2 | 5.388 | 5.388 | 2.6940 | 0.0835 | ||
| Total | 8 | 64.505 |
Table A8. Response table for SN ratios of compressive strength at peak (Larger is better).
| Level | Infill density | Infill angle | Infill speed |
|---|---|---|---|
| 1 | 27.72 | 28.28 | 27.71 |
| 2 | 25.70 | 29.34 | 28.34 |
| 3 | 31.43 | 27.23 | 28.80 |
| Delta | 5.73 | 2.10 | 1.09 |
| Rank | 1 | 2 | 3 |
Table A9. ANOVA for SN ratios of compressive strength at break.
| Source | DoF | SS | Adj SS | Adj MS | F | P | %C |
|---|---|---|---|---|---|---|---|
| Infill density | 2 | 50.687 | 50.687 | 25.3437 | 9.42 | 0.096 | 0.786 |
| Infill angle | 2 | 6.623 | 6.623 | 3.3114 | 1.23 | 0.448 | 0.102 |
| Infill speed | 2 | 1.793 | 1.793 | 0.8964 | 0.33 | 0.750 | 0.027 |
| Residual Error | 2 | 5.378 | 5.378 | 2.6892 | 0.083 | ||
| Total | 8 | 64.481 |
Table A10. Response table for SN ratios of compressive strength at break (Larger is better).
| Level | Infill density | Infill angle | Infill speed |
|---|---|---|---|
| 1 | 26.80 | 27.36 | 26.80 |
| 2 | 24.78 | 28.42 | 27.42 |
| 3 | 30.51 | 26.32 | 27.89 |
| Delta | 5.73 | 2.10 | 1.09 |
| Rank | 1 | 2 | 3 |
Table A11. ANOVA for SN ratios of Young's modulus.
| Source | DoF | SS | Adj SS | Adj MS | F | P | %C |
|---|---|---|---|---|---|---|---|
| Infill density | 2 | 76.094 | 76.094 | 38.047 | 1.87 | 0.348 | 0.58 |
| Infill angle | 2 | 9.699 | 9.699 | 4.850 | 0.24 | 0.807 | 0.074 |
| Infill speed | 2 | 3.656 | 3.656 | 1.828 | 0.09 | 0.917 | 0.028 |
| Residual Error | 2 | 40.639 | 40.639 | 20.319 | 0.312 | ||
| Total | 8 | 130.087 |
Table A12. Response table for SN ratios of Young's modulus (Larger is better).
| Level | Infill density | Infill angle | Infill speed |
|---|---|---|---|
| 1 | 45.13 | 47.92 | 45.80 |
| 2 | 43.79 | 45.97 | 47.33 |
| 3 | 50.52 | 45.54 | 46.30 |
| Delta | 6.73 | 2.39 | 1.53 |
| Rank | 1 | 2 | 3 |
Table A13. ANOVA for SN ratios of modulus of toughness.
| Source | DoF | SS | Adj SS | Adj MS | F | P | %C |
|---|---|---|---|---|---|---|---|
| Infill density | 2 | 15.34 | 15.34 | 7.670 | 1.38 | 0.420 | 0.236 |
| Infill angle | 2 | 26.56 | 26.56 | 13.281 | 2.39 | 0.295 | 0.409 |
| Infill speed | 2 | 11.89 | 11.89 | 5.947 | 1.07 | 0.483 | 0.183 |
| Residual Error | 2 | 11.12 | 11.12 | 5.562 | 0.17 | ||
| Total | 8 | 64.92 |
Table A14. Response table for SN ratios of modulus of toughness (Larger is better).
| Level | Infill density | Infill angle | Infill speed |
|---|---|---|---|
| 1 | 5.965 | 4.491 | 3.188 |
| 2 | 2.947 | 6.987 | 5.903 |
| 3 | 5.371 | 2.805 | 5.192 |
| Delta | 3.019 | 4.182 | 2.715 |
| Rank | 2 | 1 | 3 |
Table B1. ANOVA for Quadratic model (for load at peak).
| Source | SS | DoF | MS | F | P | |
|---|---|---|---|---|---|---|
| Model | 2.745E + 07 | 8 | 3.432E + 06 | 3.861E + 05 | <0.0001 | Significant |
| A-Infill density | 7.291E + 06 | 1 | 7.291E + 06 | 8.202E + 05 | <0.0001 | |
| B-Infill angle | 94368.79 | 1 | 94368.79 | 10616.49 | <0.0001 | |
| C-Infill speed | 4.688E + 05 | 1 | 4.688E + 05 | 52744.56 | <0.0001 | |
| AB | 2674.07 | 1 | 2674.07 | 300.83 | <0.0001 | |
| AC | 4.050E + 05 | 1 | 4.050E + 05 | 45562.97 | <0.0001 | |
| BC | 4.359E + 05 | 1 | 4.359E + 05 | 49036.58 | <0.0001 | |
| A2 | 2.365E + 06 | 1 | 2.365E + 06 | 2.661E + 05 | <0.0001 | |
| B2 | 1.213E + 06 | 1 | 1.213E + 06 | 1.365E + 05 | <0.0001 |
Table B2. ANOVA for Quadratic model (for Load at break).
| Source | SS | DoF | MS | F | P | |
|---|---|---|---|---|---|---|
| Model | 2.226E + 07 | 8 | 2.782E + 06 | 4.695E + 06 | <0.0001 | Significant |
| A-Infill density | 5.910E + 06 | 1 | 5.910E + 06 | 9.973E + 06 | <0.0001 | |
| B-Infill angle | 75699.77 | 1 | 75699.77 | 1.277E + 05 | <0.0001 | |
| C-Infill speed | 3.803E + 05 | 1 | 3.803E + 05 | 6.418E + 05 | <0.0001 | |
| AB | 1992.30 | 1 | 1992.30 | 3362.00 | <0.0001 | |
| AC | 3.274E + 05 | 1 | 3.274E + 05 | 5.525E + 05 | <0.0001 | |
| BC | 3.510E + 05 | 1 | 3.510E + 05 | 5.923E + 05 | <0.0001 | |
| A2 | 1.918E + 06 | 1 | 1.918E + 06 | 3.236E + 06 | <0.0001 | |
| B2 | 9.833E + 05 | 1 | 9.833E + 05 | 1.659E + 06 | <0.0001 |
Table B3. ANOVA for Quadratic model (for deformation at peak).
| Source | SS | DoF | MS | F | P | |
|---|---|---|---|---|---|---|
| Model | 22.07 | 8 | 2.76 | 3448.76 | <0.0001 | Significant |
| A-Infill density | 8.78 | 1 | 8.78 | 10977.84 | <0.0001 | |
| B-Infill angle | 0.0149 | 1 | 0.0149 | 18.59 | 0.0004 | |
| C-Infill speed | 1.15 | 1 | 1.15 | 1438.55 | <0.0001 | |
| AB | 0.0030 | 1 | 0.0030 | 3.70 | 0.0702 | |
| AC | 0.0987 | 1 | 0.0987 | 123.33 | <0.0001 | |
| BC | 5.09 | 1 | 5.09 | 6358.54 | <0.0001 | |
| A2 | 5.49 | 1 | 5.49 | 6858.73 | <0.0001 | |
| B2 | 0.1475 | 1 | 0.1475 | 184.42 | <0.0001 | |
| C2 | 0.0000 | 0 |
Table B4. ANOVA for 2FI model (for deformation at break).
| Source | SS | DoF | MS | F | P | |
|---|---|---|---|---|---|---|
| Model | 42.71 | 6 | 7.12 | 10.48 | < 0.0001 | Significant |
| A-Infill density | 38.99 | 1 | 38.99 | 57.39 | < 0.0001 | |
| B-Infill angle | 6.42 | 1 | 6.42 | 9.45 | 0.0060 | |
| C-Infill speed | 1.12 | 1 | 1.12 | 1.64 | 0.2146 | |
| AB | 3.65 | 1 | 3.65 | 5.38 | 0.0311 | |
| AC | 7.89 | 1 | 7.89 | 11.62 | 0.0028 | |
| BC | 20.45 | 1 | 20.45 | 30.11 | < 0.0001 |
Table B5. ANOVA for Quadratic model (for compressive strength at peak).
| Source | SS | DoF | MS | F | P | |
|---|---|---|---|---|---|---|
| Model | 1712.98 | 8 | 214.12 | 3.304E + 06 | <0.0001 | Significant |
| A-Infill density | 454.47 | 1 | 454.47 | 7.012E + 06 | <0.0001 | |
| B-Infill angle | 5.85 | 1 | 5.85 | 90298.97 | <0.0001 | |
| C-Infill speed | 29.33 | 1 | 29.33 | 4.526E + 05 | <0.0001 | |
| AB | 0.1631 | 1 | 0.1631 | 2516.86 | <0.0001 | |
| AC | 25.16 | 1 | 25.16 | 3.882E + 05 | <0.0001 | |
| BC | 26.92 | 1 | 26.92 | 4.154E + 05 | <0.0001 | |
| A2 | 147.89 | 1 | 147.89 | 2.282E + 06 | <0.0001 | |
| B2 | 75.49 | 1 | 75.49 | 1.165E + 06 | <0.0001 |
Table B6. ANOVA for Quadratic model (for compressive strength at break).
| Source | SS | DoF | MS | F | P | |
|---|---|---|---|---|---|---|
| Model | 1385.16 | 8 | 173.14 | 5.128E + 05 | <0.0001 | Significant |
| A-Infill density | 367.33 | 1 | 367.33 | 1.088E + 06 | <0.0001 | |
| B-Infill angle | 4.65 | 1 | 4.65 | 13781.80 | <0.0001 | |
| C-Infill speed | 23.80 | 1 | 23.80 | 70487.39 | <0.0001 | |
| AB | 0.1345 | 1 | 0.1345 | 398.37 | <0.0001 | |
| AC | 20.25 | 1 | 20.25 | 59979.16 | <0.0001 | |
| BC | 21.80 | 1 | 21.80 | 64569.71 | <0.0001 | |
| A2 | 119.70 | 1 | 119.70 | 3.545E + 05 | <0.0001 | |
| B2 | 60.82 | 1 | 60.82 | 1.802E + 05 | <0.0001 |
Table B7. ANOVA for 2FI model (for Young's modulus).
| Source | SS | DoF | MS | F | P | |
|---|---|---|---|---|---|---|
| Model | 2.219E + 05 | 6 | 36980.49 | 85.61 | <0.0001 | Significant |
| A-Infill density | 2.022E + 05 | 1 | 2.022E + 05 | 468.04 | <0.0001 | |
| B-Infill angle | 5.36 | 1 | 5.36 | 0.0124 | 0.9124 | |
| C-Infill speed | 1905.03 | 1 | 1905.03 | 4.41 | 0.0486 | |
| AB | 1341.68 | 1 | 1341.68 | 3.11 | 0.0933 | |
| AC | 2425.05 | 1 | 2425.05 | 5.61 | 0.0280 | |
| BC | 80959.73 | 1 | 80959.73 | 187.41 | <0.0001 |
Table B8. ANOVA for Quadratic model (for modulus of toughness).
| Source | SS | DoF | MS | F | P | |
|---|---|---|---|---|---|---|
| Model | 11.53 | 8 | 1.44 | 2428.30 | <0.0001 | Significant |
| A-Infill density | 2.91 | 1 | 2.91 | 4907.77 | <0.0001 | |
| B-Infill angle | 1.34 | 1 | 1.34 | 2256.96 | <0.0001 | |
| C-Infill speed | 1.26 | 1 | 1.26 | 2114.52 | <0.0001 | |
| AB | 1.43 | 1 | 1.43 | 2404.35 | <0.0001 | |
| AC | 0.9220 | 1 | 0.9220 | 1552.90 | <0.0001 | |
| BC | 2.89 | 1 | 2.89 | 4863.98 | <0.0001 | |
| A2 | 4.95 | 1 | 4.95 | 8341.73 | <0.0001 | |
| B2 | 0.0246 | 1 | 0.0246 | 41.51 | <0.0001 |