
Abstract
In this current investigation, alkali and Trimethoxymethylsilane treated custom made (irregular type) basket woven fabric at different weight percentages (0, 25, 35 and 45 wt.% and named as Pure epoxy, 25 FE, 35 FE, and 45 FE respectively) were reinforced with epoxy resin to develop flax/epoxy composites and tested for mechanical, dynamic mechanical, and sound absorption properties as per ASTM standards. Mechanical results revealed that, amongst the composites, 45 FE showed highest tensile strength, flexural strength, Impact strength and Shore D hardness of 91.07 MPa, 109.5 MPa, 295.65 J m−1, and 85.23 respectively, whereas ILSS property did not shows much appreciable progress even at high fiber loadings. Dynamic mechanical analysis (DMA) tests were conducted for five different frequencies (0.5, 1, 2, 5, and 10 Hz) at varying temperature and properties such as storage modulus (E'), loss modulus (E''), and damping (tanδ curve) were evaluated. DMA properties of the composites have found to be improved after reinforced with the treated flax fabric. Effectiveness coefficient (C) confirms that 45FE composites exhibited better strong fiber-matrix interface and shows good agreement with cole-cole plot analysis. Sound absorption performance of the composites were determined in terms of sound absorption coefficient (SAC) using Impedance tube system for the frequency range 0–6400 Hz. Results indicated that flax-epoxy composites exhibit better sound absorption properties at medium and higher frequency levels. SEM analysis was carried out to understand the cause of failure in mechanically fractured composites. Moreover, morphologies of the fibers were also studied by XRD technique.
Export citation and abstract BibTeX RIS

Original content from this work may be used under the terms of the Creative Commons Attribution 4.0 licence. Any further distribution of this work must maintain attribution to the author(s) and the title of the work, journal citation and DOI.
1. Introduction
Natural fiber-reinforced polymer (NFRP) composites have been developed to replace the conventional metals and synthetic fiber reinforced based composites to some extent because natural fibers are biodegradable, nontoxic, inherent light density, abundantly available resource, and optimum mechanical with less abrasiveness [1–3]. However, natural fibers have been limited to usage due to poor impact strength and high moisture absorption characteristics. Inherently natural fibers possess hydroxyl and other polar groups, which is why weak interface formed with matrix phase and affecting the dimensional stability of the composites resulting in the poor mechanical performance. In order to over such issues, surface energy of the natural fibers is modified by the chemical treatment namely Alkali treatments. Mishra et al [4] reported that sisal fiber treated with 5% NaOH concentration solution had given the good improvement in mechanical properties of the composites. Vardhini et al [5] confirmed in their studies that Banana fiber treated in NaOH solution improved density, thermal stability, breaking strength and tenacity up to 15% concentration. Gomes et al [6] studied the effect of alkaline treatment on tensile properties of curaua fiber composites. They concluded that alkaline treated fiber composites showed strain fracture two to three times higher than that of untreated fiber composites. Bachtiar et al [7] investigated the importance of alkaline treatment on tensile properties of sugar palm fiber reinforced epoxy composites. Results showed that tensile modulus of the treated sugar palm fiber/epoxy composites has been quite higher than untreated epoxy composites. Furthermore, performances of the natural fiber composites can be still improved by treating the reinforcement fiber with silane coupling agents. Silane compounds alter the surface properties of the fiber by reacting with its hydroxyl group which enhances the compatibility attributes of fiber to impregnate with polymer resin. More importantly, silane compounds can stop the internal hydrogen bonding formation between cellular molecular chain which leads to the better diffusion of polymer resin and higher impregnation of the fiber and also adhesion properties between hydrophobic polymer matrix and hydrophilic fiber can be enhanced, thereby deterioration in mechanical properties can be curtailed down. Sever et al [8] studied the effect of the γ-Methacryloxypropyltrimethoxy silane effect on mechanical properties of Jute/Polyester composites at various levels of concentration. Mechanical tests showed that 0.3% of γ-Methacryloxypropyltrimethoxy silane was sufficient to improve the mechanical properties of composites when compared to the untreated sample. Khan and Hassan [9] concluded in their studies that, γ-aminopropyl trimethoxy silane treatment on Jute fabrics before the fabrication of Jute/polycarbonate composites would improve the mechanical properties and induces dimensional stability compared to untreated composites. Dilfi et al [10] inferred that combined effect of alkaline and 3-glycidoxypropyltriomethoxy silane treated had improved mechanical properties of the Jute/Epoxy composites compared to alkaline and silane treated composites.
Static mechanical, dynamic mechanical and thermal properties of the natural fiber composites will depend on the various factors such as the selection of fiber and polymer materials, modification of polymer matrix, weight fraction/volume content of fibers, surface modification of fiber by coupling agents, fiber types (short or continuous), stacking sequences, weaving architectures, interplay and intra ply hybridization of natural fibers with synthetic fibers etc. Rajesh and Jeyaraj pitchaimani [11] studied the effect of various form weaving architecture of jute/Banana fiber in the form of braided basket woven, yarn-conventional basket woven and short fiber reinforcement into the polyester matrix. Test results showed that there was an enhancement in the mechanical properties of Intra-ply hybridization of Jute-Banana fiber/polyester composites. However, braided woven fabric composites have found inferior to conventional woven (yarn) fabric composites. Rajesh et al [12] developed the Plain woven of jute, Basket is woven of jute, Herringbone of jute and Intra-ply of Jute-Banana in Basket woven form and reinforced these fabrics into the polyester matrix phase. Test results revealed that Basket woven of jute/polyester composites exhibited superior mechan
ical properties compared to other composites even including Intra-ply hybridized Jute/Banana composites. Also, they conclude that four layers of fabric are sufficient to impart better mechanical properties for the composites. Venkateshwaran et al [13] investigated mechanical and dynamic mechanical properties on the Banana fiber reinforced epoxy composites. Banana fibers were reinforced in the form of plain, twill, basket-woven form into polymer phase. Mechanical and dynamic mechanical results confirmed that plain woven type Banana/epoxy composites are found to be superior to other forms of composites.
Dynamic mechanical analysis (DMA) has become a very far important technique for ascertaining interfacial properties and viscoelastic properties of natural fiber composites. Selvakumar and Omkumar [14] studied the effect of hybridization of jute and human hair on the mechanical and dynamic mechanical performance of the polymer composites. Static and dynamic mechanical properties increase with an increase in human hair content. The highest fiber content in the matrix tends to transfer greater stress at the interface resulting in increasing in DMA properties. Gupta and Srivastava [15] inferred that 30 wt.% jute fiber in the epoxy matrix improved the mechanical, thermal and dynamic mechanical properties. Storage modulus and loss modulus increases with an increase in fiber content which is attributed to uniform stress transfer from fiber to the matrix. Arulmurugan et al [16] carried out a dynamic mechanical analysis on Aloevera/Hemp/Flax/reinforced epoxy composites filled with BaSo4(Barium sulphate) particles. Addition of the filler improves the storage modulus and loss modulus the composites. Rajesh and Jeyaraj [17] studied the influence of different nature of the woven architecture of Banana-jute based polyester composites on DMA and free vibration characteristics. Results of the braided and knitted fabric reinforced polyester composites in both inter and intra ply hybridization showed higher storage and loss modulus when compared to woven polyester composites. The experimental modal analysis also showed the same trend as DMA, here braided fabric reinforcement enhances the stiffness of the jute-banana composites and hence there is an increase in the natural frequencies. Daiane Romanzini et al [18] studied DMA and Mechanical properties of glass/ramie composites by varying fiber content. Results revealed that storage modulus and loss modulus increased with an increase in fiber content. Also, mechanical properties showed the same trend as DMA, however, Tg (glass transition temperature) did not change significantly. Sathishkumar [19] studied the dynamic mechanical analysis of snake grass reinforced/polyester composites. Snake grass fiber is reinforced into the polyester matrix in the form of short length fiber whose size varied from 10 mm to 50 mm. Besides authors also varied volume of reinforcement from 10% to 30% under each short fiber length sections. DMA results showed that storage and loss modulus increases with increase in frequency for all type of composites. In overall, 30 mm short fiber snake grass with 30% of volume grass reinforcement exhibited better dynamic mechanical properties at all frequencies compared to other composites. Gheith et al [20] concluded that date palm fiber of 50 wt.% date palm fiber with epoxy can improve the mechanical, thermal and dynamic mechanical properties of the composites.
Nowadays, noise pollution has drawn the whole world's attention because of its negative impact on human health and wellbeing. The major sources of noise pollutions are automotive sectors, constructions sectors, and transportation. In this context researchers, determined two techniques to curb this noise menace namely active voice control and passive voice control. In active noise control, reduction of noise production at the source to be done which is impracticable and very costly technique. Another way is passive noise control, in which sound-absorbing materials are identified and placed in the location of noise/sound recipient. A lot of research in recent time identified organic fibers (both vegetable or animal) which can be directly used as a replacement for synthetic fiber as a sound-absorbing material. Sezgin and Haluk [21] reported that a single layer of cotton cloth with tea leaf fiber absorbed better sound than polyester and polypropylene non-woven fiber. According to the study of Zulkifli et al [22], multi-layered coir fiber showed outstanding sound absorption capability compared to rock wool and manmade fiber. Fatima and Mohanty [23] reported that low-density jute fiber turned out to be very good sound absorber than high-density jute fiber. Also, results were compared with commercially available manmade-non biodegradable materials like glass fiber. Further, they conclude that Jute fiber and natural rubber latex jute composite can be used in an automotive, architectural application where noise reduction must be minimum. Gokulkumar et al [24] studied mechanical and sound acoustical properties of Camellia Sinensis/Ananas Comosus/Glass Fiber Hybrid Polymer Composites. In particular, sound absorption of the hybrid composites was effective for operating frequency above 2000 Hz. However still, there has to conduct lot of research in the area of sound attenuation for natural fiber reinforced composites. From the exhaustive literature survey, authors learnt that there have been scanty reports found on the reinforcement of natural fiber in the form of woven-architectures with the polymer matrix. Moreover, a lot of possibilities are there to improve the properties of composites by doing so. Hence in the context of developing a new class of composites, irregular type basket woven flax reinforced epoxy composites have been fabricated using compression moulding technique and studied their physicomechanical, dynamic mechanical and sound absorption properties concerning the weight fraction of fiber content.
2. Material and experimental techniques
2.1. Materials
Table 1 shows the chemical composition and physicomechanical properties of the Flax fiber used. In the present investigation, 6LEA yarns procured from local vendors and converted into irregular type basket woven fabric (4/2) using Tabletop loom (Make: ERGO G2). The aerial density of the woven fabric is 578 GSM, whereas end per inch (EPI) and pick per inch (PPI) found to be 12 and 36 respectively. Photograph and SEM image of the woven flax are shown in figure 1. Epoxy resin grade VBR 8912 and hardener VBR1209 are used as matrix materials and it is purchased from Vasavibala resin private limited, Chennai, India. Trimethoxymethylsilane used for coating the fibers (supplied by precision scientific Co, Coimbatore, India).
Table 1. Flax fibers: Chemical composition, physico-mechanical properties [25–27].
| Chemical composition (%) | Physico-mechanical properties | |||||||
|---|---|---|---|---|---|---|---|---|
| Cellulose | Hemicellulose | Lignin | Pectin | Wax | Density (g cc−1) | Young's modulus (GPa) | Tensile Strength (MPa) | Elongation at break (%) |
| 60–81 | 14–20.6 | 2–3 | 1.8–5 | 1.7 | 1.5 | 27.6 | 345–1500 | 2.7–3.2 |

Figure 1. (a) Photograph of the Woven flax fiber (b) SEM picture of the flax fiber under magnification (20 X).
Download figure:
Standard image High-resolution image2.2. Surface treatments of Fiber
2.2.1. Alkaline treatment
Flax fabrics are immersed in a 2% concentration of sodium hydroxide (NaOH) solution for 60 min (Room temperature). Afterwards, it is thoroughly washed with distilled water several times to remove any NaOH sticking on to its surfaces. Few drops of acetic acid are added to distilled water to enhance the removal process of NaOH from fibers. During washing of fabrics, it must be ensured that the pH of the water should be closer to 7 and washed fabrics are kept for drying in an oven at 65 °C for 24 h.
2.2.2. Silane treatment
The surface of the Flax fibers is further coated with Trimethoxymethylsilane coupling agent. Silane solution is prepared by dissolving 0.1% of Trimethoxymethylsilane in an acidified distil water into which alkalized flax fabrics are immersed for 60 min later, treated fabrics are removed from the solution and dried in an oven for 24 h at 65 °C.
2.3. Fabrication
Fiber-reinforced polymer composites can be fabricated using several techniques such as Vacuum bagging, Resin transfer moulding and autoclave curing method. Aforesaid processes are costlier and required a skilled technician to carry out the fabrication. In case of vacuum bagging techniques lots of waste consumables such as the vacuum bag, peel ply and breather fabric becomes essential to discard after the use. Like ways, several demerits have been associated with the process though it produces the good quality of laminates. Therefore, current investigation chooses the conventional hand layup process followed by compression mould curing technique since process consumes less capital investment and also offers flexibility in materials design. Mild steel mould of size 250 × 220 × 35 mm3 is used for preparing the composites samples. Four-layer of flax reinforced epoxy composites are studied by varying weight fraction (percentage) of fibre and are designated as Pure epoxy (100 wt.% resin), 25 FE (25 wt. % of Flax fibre-remaining 75 wt.% resin), 35 FE (35 wt. % of flax fibre) and 45 FE (45 wt.% of flax fibre). Details of the composition and difference in the densities are presented in table 2. Initially, silicon spray is coated on the mould surface followed by placement of Teflon sheet to facilitate easy removal of the laminates. Metered amount of polymer resin and fabrics in weight fraction are established before synthesizing the laminates. Resin and hardener are mixed thoroughly in the ratio of 1:2 as prescribed by the Manufacturer. The woven flax fabric is placed on the mild steel mould and resin is spread all over the surface of fabric using a medium-size paintbrush and immediately followed by degassing of bubble using stainless steel roller. Same steps are followed until all four layers of fabrics are completely impregnated with epoxy resin. once impregnation of fabric with resin is done, then the lower mould is closed and subjected to compression mould curing at room temperature under the pressure of 250 psi. After 24 h of the curing process is completed, composites are taken off the mould and cut per the ASTM standards for further studies. Maximum loading of woven fabric reinforcement has been limited to 45 wt.% because partial Impregnation of flax fiber by epoxy resin is noticed when fiber weight fraction increased beyond 45 wt.%. Figure 2 presents a stepwise procedure followed to fabricate the Flax-Epoxy composites.
Table 2. Composition of the composites used for the present study.
| Weight percentage (wt.%) | Density of the composites (g cc−1) | |||||
|---|---|---|---|---|---|---|
| Sample Code | Layers of Fabric | Fibre (wt.%) | Epoxy (wt.%) | Theoretical density | Experimental density | Void (%) |
| Pure Epoxy | — | 0 | 100 | 1.22 | 1.16 | 4.91 |
| 25 FE | 4 | 25 | 75 | 1.24 | 1.19 | 4.03 |
| 35 FE | 4 | 35 | 65 | 1.27 | 1.21 | 4.73 |
| 45 FE | 4 | 45 | 55 | 1.34 | 1.30 | 2.98 |
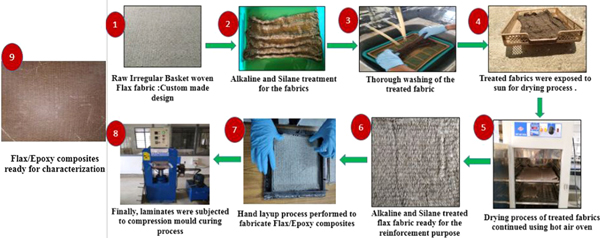
Figure 2. Steps involved in fabricating the Flax-Epoxy composites.
Download figure:
Standard image High-resolution image2.4. Characterization of the Flax-epoxy composites:
Prepared epoxy and flax-epoxy composites are subjected to static mechanical, dynamic mechanical and sound acoustic tests as per ASTM standards. Average of the three to five trails per compositions are considered for consolidating the final values of the physico-mechanical properties.
2.4.1. X-ray diffraction analysis (XRD)
XRD analysis is carried out to understand the effect of chemical treatment over the crystallinity of the fiber. During the process of testing, Fibres are scanned for the range (2θ) of 0°–35° at scanning speed of 7 degrees/minute, where θ indicates the angle of diffraction.
2.4.2. Density
Experimental density value of the composite is determined in a high precision electronic balance apparatus using Archimedes principle. Any variation in theoretical and experimental density gives the percentage of void content present in the composites.
2.4.3. Shore-D hardness
The Shore-D hardness test is conducted as per ASTM D 2240 [28]. During the hardness test, specimens are indented at various location of the composites and eventually their average value is recorded for further discussion.
2.4.4. Tensile test
The tensile test is carried out to determine the tensile strength and tensile modulus of the composites. Figure 3 shows specimens prepared for the tensile test per ASTM D-638-14 [28]. The tensile test is performed in 100 kN capacity Kalpak universal testing machine (UTM) with a crosshead speed of 5 mm min−1.

Figure 3. Tensile specimens prepared as per ASTM D638-14.
Download figure:
Standard image High-resolution image2.4.5. Flexural test
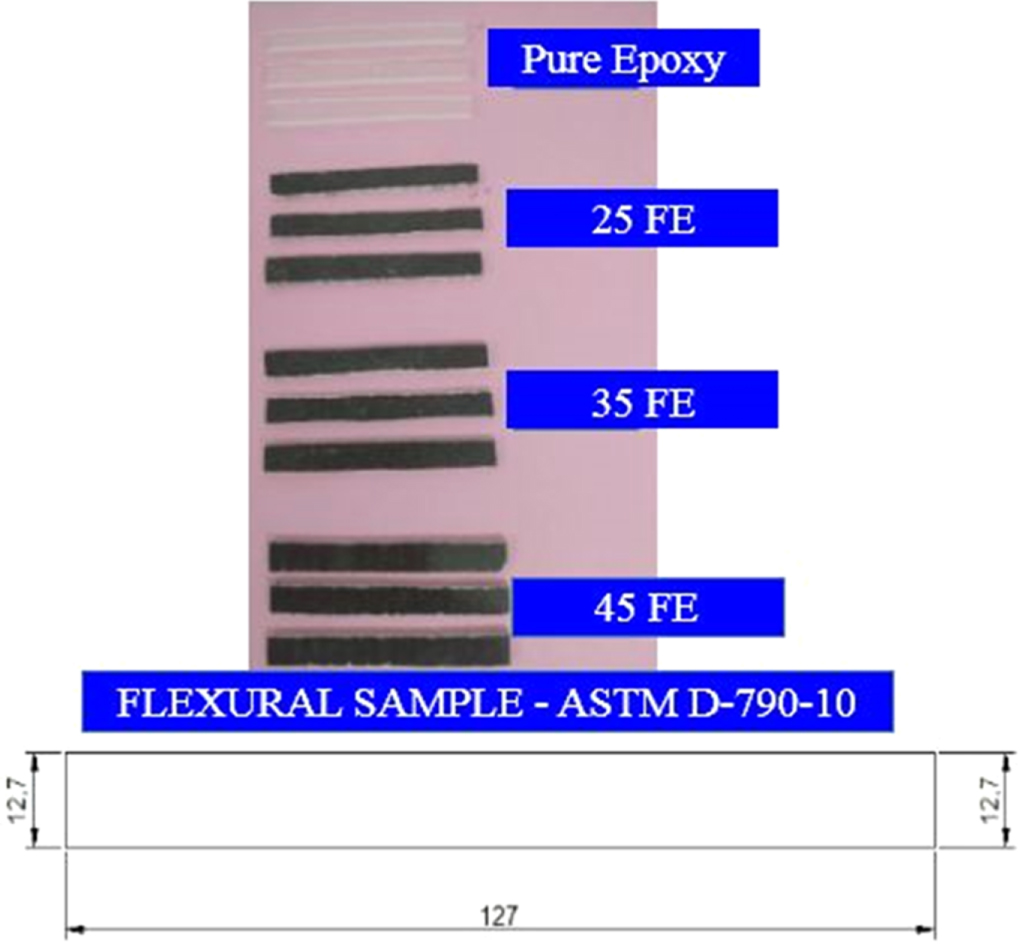
Flexural test (three-point bending test) is carried to evaluate the flexural strength and flexural modulus of the composites. Figure 4 shows specimens prepared for the flexural test per ASTM D-790-10 [28]. The test is conducted using the same UTM machine with a crosshead speed of 2.5 mm min−1.

Figure 4. Flexural specimens prepared as per ASTM D790-10.
Download figure:
Standard image High-resolution image2.4.6. Impact test
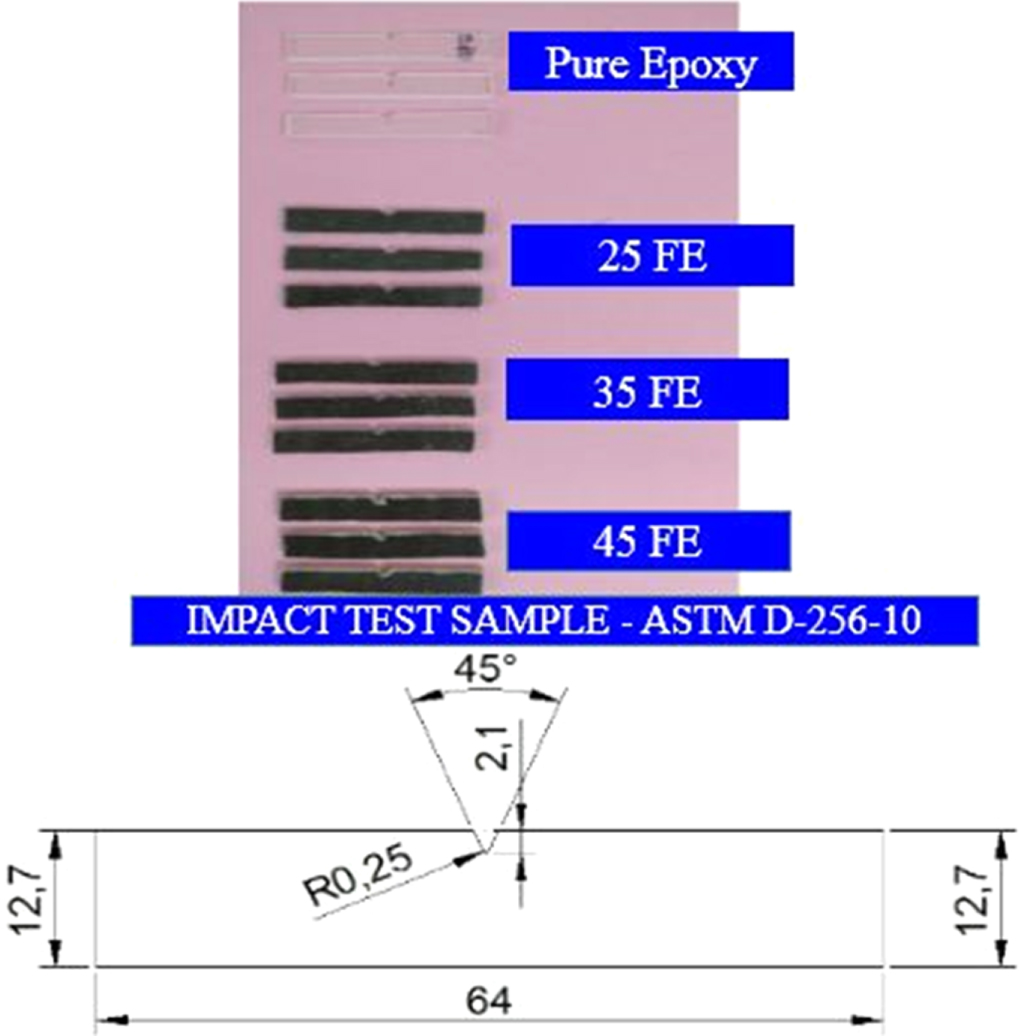
The impact test is performed to measure the toughness of fabricated composites. Figure 5 shows the specimens are prepared for Izod-impact test per ASTM D256-10 [28]. During the impact test, specimens are broken and the energy required to break them is digitally recorded in the testing machine itself.

Figure 5. Izod Impact specimens prepared as per ASTM D256-10.
Download figure:
Standard image High-resolution image2.4.7. Interlaminar shear strength (ILSS)
ILSS test is performed to measure the shear strength of the composites. Figure 6 shows the specimens prepared for the short beam shear test as per ASTM D2344 [29]. ILSS test is conducted on the same UTM at a crosshead speed of 2.5 mm min−1.

Figure 6. ILSS specimens prepared as per ASTM D2344.
Download figure:
Standard image High-resolution image2.4.8. Dynamic mechanical analysis (DMA)
DMA specimens prepared as per ASTM D5023 [30, 31] (as shown in figure 7) to test under three-point bending configuration in a dynamic mechanical analyser (Make: SII Nanotechnology Japan-DMS 6100) Viscoelastic properties of the samples such as storage modulus, loss modulus, glass transition temperature and damping factors are determined concerning varying temperature (25 °C–150 °C) at different operating frequencies (0.5 Hz, 1 Hz, 2 Hz, 5 Hz, and 10 Hz). The heating rate of 3 °C min−1 has been selected for the temperature range.

Figure 7. DMA specimens prepared as per ASTM D5023.
Download figure:
Standard image High-resolution image2.4.9. Sound absorption test
Figure 8 shows the samples prepared for Sound absorption studies per ASTM E1050-12 [32]. Tests are carried out using Impedance tube method (Bruel & Kjaer, Made in German). As per the testing procedure, large impedance tube is 99.5 mm diameter and its operating frequency range (0 Hz to 1600 Hz) while small impedance tube was 29.5 mm diameter and its operating frequency range (4 Hz to 6400 Hz). Moreover, the final result of one sample is recorded by combining Small and Large tube (1/3 OCTAVE) operated at the frequency range 16 Hz–6400 Hz. For understanding the sound absorption behaviour of one sample, four large and four small specimens are used.

Figure 8. Impedance tube test specimens prepared as per ASTM E1050-12.
Download figure:
Standard image High-resolution image2.4.10. SEM analysis
SEM (Make: Japan-Model-JEOL-6480LV) is used for studying the morphology of the fractured samples and fabric's texture. Samples are gold spluttered before analysis.
3. Results and discussion
3.1. Surface morphology of the Flax fiber
SEM photographs of the untreated and treated flax fiber are shown in figures 9(a)–(c). Untreated fiber inherently possesses surface roughness property due to the presence of wax, lignin, oil and other non-cellulosic content. These impurities have been removed from NaOH treatment [5, 33]. In figures 9(b) and (c) shows the Alkali and Alkali-silane treated fiber, respectively, from the surface of the 2% NaOH treated fiber it is evident that treated fiber shows few ridges due to the elimination of non-cellulosic and wax contents which are likely to enhance the better interlocking between fiber and resin [34].
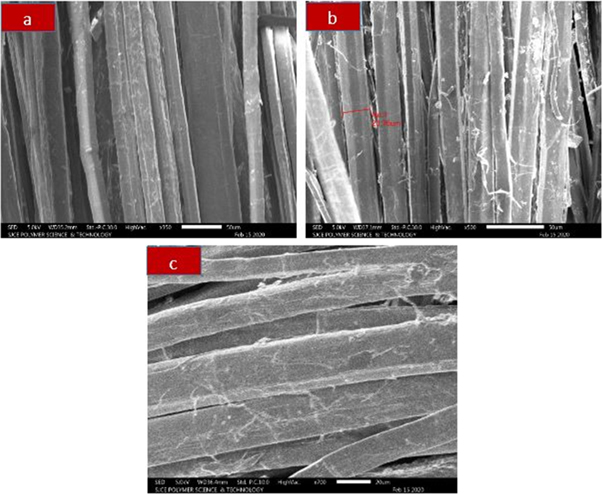
Figure 9. SEM images of Flax fiber (a) Untreated (b) 2% NaOH Treated (c) Alkali-silane treated Flax fiber.
Download figure:
Standard image High-resolution image3.2. XRD analysis
The X-ray diffraction pattern of the raw, alkali and alkalised treated with 0.2% Trimethoxymethylsilane is shown in figure 10. The intensity of Crystallinity peak I22 (2θ) and amorphous peak I18 (2θ) for raw and treated fibers are presented in the table 3. It is evident from the XRD pattern that, NaOH processed fiber exhibited little higher crystallinity compared to raw fiber. Because alkali-treated is mostly associated with hemicellulose, lignin and other wax impurities. These substances have been responsible for their amorphous nature and they are eliminated through alkali treatment thus, an increment in the crystallinity and crystallinity index of fiber could be observed [5, 35]. According to Kumar and Anand [35], treated fiber had a higher degree of crystallinity because of the presence of rigidity cellulose.

Figure 10. X-ray diffraction pattern of untreated and treated flax fiber.
Download figure:
Standard image High-resolution imageTable 3. XRD data of the flax fibers.
| Flax Fiber | I22 (2θ) | I18 (2θ) | Crystallinity (%) | Crystallinity Index (CI) |
|---|---|---|---|---|
| Raw/Untreated fiber | 1328.7 | 805.4 | 67.75 | 39.38 |
| 2% NaOH fiber | 1711.0 | 778.3 | 68.73 | 54.52 |
| 0.2% Alkaline and Silane treated fiber | 935.4 | 435.5 | 68.21 | 53.47 |
3.3. Density
The experimental density value of the fabricated flax-epoxy composites is calculated in a high precision digital weighing balance (accuracy:0.1 mg) using Archimedes principle. The difference in the theoretical and experimental density value gives the number of voids present in the composites and very minimum void content indicates that composites are fabricated very effectively. During the preparation of the laminates, the utmost care has to been taken because there may be a high possibility for the air entrapment while laying down one fabric over another [36]. Thus, medium-size steel rollers are employed to roll over each layer of fabric to degas. In this manner, voids can be minimized in the composite materials. From the figure 11 it is evident that an increase in the fiber content increases the density value of the composites. Increase in the density implies that treated fiber allowed the epoxy resin to easily impregnate at the inter fiber gaps of the woven fabric, which ultimately leads to the fewer voids. Maximum density of 1.30 g cc−1. is obtained for 45 FE composites and this may be attributed to high weight percentage of reinforcement. Presence of voids in the epoxy and flax-epoxy composites has been detailed in table 2.

Figure 11. Density of the epoxy and flax-epoxy composites.
Download figure:
Standard image High-resolution image3.4. Hardness
The hardness of the epoxy and flax-epoxy composites is determined and presented in figure 12. Epoxy resin exhibited a shore D hardness value of 74.20. Increment in the fiber loading tends to increase the hardness of the composites. This study indicates that hardness of the flax-epoxy composites is affected by the fiber loadings. Further, maximum shore D value of 85.23 is obtained by 45 FE composites, nearly 15.13% improvement in the hardness compared to pure epoxy resin, this may be because of high interfacial adhesion between chemically modified fiber and epoxy resin which transfer the load to the high strength and modulus flax fiber [37]. Moreover, improvement in hardness implies that composites exhibit high resistance to the applied load.

Figure 12. The hardness of the epoxy and flax-epoxy composites.
Download figure:
Standard image High-resolution image3.5. Tensile properties
Mechanical properties of the flax-epoxy composites are detailed in table 4. Tensile load versus displacement curve for the composites have shown in figure 13(a). It is evident from the plot that, tensile load-bearing capacity has improved for fibre-loaded epoxy composites. During the tensile test, composite specimens are managed to accept the load until the fibers get fractured. Brittle nature is the predominant cause for failure in pure epoxy resin and from the load versus displacement curve, it is evident that epoxy failed at low load amongst the composite lot. As the weight fraction of the fiber loading increases, brittleness of the composites decreases. From the experimental result, 45 FE composites give the highest displacement of 7 mm for an average load of 5.2 kN Whereas, 25 FE exhibited low bearing capacity (2.4 kN) with a displacement of 6 mm. From the load versus displacement curve, it is apparent that 45 FE composite displayed 150% improvement in the load-bearing capacity compared to epoxy resin, whereas 120% and 30% improvement over 25 FE and 35 FE composites respectively. From figures 13(b) and 14 it is understood that the tensile strength of the composites increases with an increase in fiber loadings. Pure epoxy exhibited the strength of only 40.68 MPa and this strength is rose to 125.17% by reinforcing with 45 wt.% of fiber content. This improvement may be attributed to strong adhesion between the fiber and matrix as a result of NaOH and silane treatment and it may also have occurred due to the reduction in interlaces between yarns of warp and weft direction of the basket-woven architecture of flax fiber [11]. Tensile strength of the composite 45 FE is found to be 59.5% and 21.6% higher than that of 25 FE and 35 FE composites respectively. Figure 14 shows that tensile modulus of the flax-epoxy composites increases with an increase in the fiber content. Highest modulus of elasticity is observed for 45 FE composites at strain value closer to 0.08 and it showed 190% improvement over pure epoxy this may be attributed to the effective transfer of load from matrix phase to fiber due to the strength between them [15]. Table 5 shows the comparison of the tensile strength property of the other natural fiber composites with the present flax/epoxy composites.
Table 4. Mechanical properties of the epoxy and Flax-Epoxy composites.
| Composites | Tensile strength (MPa) | Tensile Modulus (GPa) | Flexural strength (MPa) | Flexural modulus (GPa) | Shore-D hardness | ILSS (MPa) | Impact strength (J m−1) |
|---|---|---|---|---|---|---|---|
| Pure Epoxy | 40.68 | 0.66 | 59.92 | 2.979 | 74.20 | 5.34 | 59.19 |
| 25 FE | 57.57 | 1.251 | 99.75 | 4.692 | 76.20 | 6.76 | 213.80 |
| 35 FE | 75.62 | 1.534 | 104.30 | 5.396 | 81.31 | 8.48 | 258.73 |
| 45 FE | 91.07 | 1.962 | 109.50 | 6.389 | 85.23 | 7.63 | 295.65 |

Figure 13. (a) Tensile load versus displacement (b) Tensile stress versus strain curve of the epoxy and flax-epoxy composites.
Download figure:
Standard image High-resolution image
Figure 14. Comparison of the tensile strength and tensile modulus of the epoxy and Flax-Epoxy composites.
Download figure:
Standard image High-resolution imageTable 5. Comparison of the mechanical properties of the natural fiber composites with the present Flax/Epoxy composites.
| Matrix material | Fiber reinforcement | Reinforcement type | Wt.% of fiber | Tensile Strength (MPa) | Tensile Modulus (GPa) | Flexural Strength (MPa) | Flexural modulus (GPa) | Impact strength (J m−1) | References |
|---|---|---|---|---|---|---|---|---|---|
| Epoxy | Flax | Basket woven-irregular type | 45.0 | 91.70 | 1.96 | 109.50 | 6.38 | 295.65 | Present |
| Epoxy | Jute | Plain type woven | 30.0 | 78.21 | 1.52 | 203.8 | 9.76 | 44.44 | [15] |
| Epoxy | Banana | Plain type woven | 40.0 | 20.00 | 0.41 | 56.50 | 6.08 | — | [13] |
| Epoxy | Banana | Twill type woven | 40.0 | 13.08 | 0.37 | 34.24 | 4.20 | — | [13] |
| Epoxy | Banana | Basket type woven | 40.0 | 9.44 | 0.22 | 40.43 | 3.31 | — | [13] |
| Polyester | Caryota | Unidirectional alignment | 40.0 | 50.00 | — | 85.00 | — | — | [38] |
| Epoxy | Sisal | Unidirectional alignment | 30.0 | 83.96 | 1.58 | 252.39 | 11.31 | — | [39] |
| Polypropylene | Borassus fruit fiber | Chopped (1–1.5 cm) | 05.0 | 23.47 | 1.50 | 42.0 | 1.18 | 25.36 | [40] |
| Epoxy | Arhar fiber | Particulates form | 10.0 | 24.0 | — | — | — | — | [41] |
| Unsaturated polyester | palm leaf stalk fibers | Unidirectional alignment | 30.0 | 56.9 | 2.28 | 105 | 15.41 | — | [42] |
| Unsaturated polyester | Palmyra palm-leaf stalk fibers | Random distribution | 55.0 | 28.5 | 1.6 | 77 | 1.6 | [43] | |
| Vinyl ester | Rossele fiber | Particulates form | 05.0 | 25.0 | 5.0 | — | — | — | [44] |
| Unsaturated polyester | Sour weed fiber | Chopped fiber | 06.0 | 35.0 | 0.45 | — | — | — | [45] |
| Epoxy | Bamboo fiber | Matt form | 40.0 | — | — | 115 | 6.9 | 38 | [46] |
| Epoxy | Bamboo/Kenaf hybrid | Matt form (Bamboo:kenaf at equal proportion) | 40.0 | — | — | 100 | 6.4 | 45 | [46] |
| Epoxy | Palmyra/Coir/sisal hybrid composites | Chopped fiber 30 mm | 40.0 (Vf) | 38.0 | 0.75 | 110 | 3.5 | — | [47] |
| Polyester | Sansevieria fiber | Unidirectional alignment | 40.0 (Vf) | 90.0 | 1.8 | — | — | 220 | [48] |
| Epoxy | Ramie fiber | Matt form | 30.0 | 45.0 | — | 90.0 | — | — | [49] |
3.6. Flexural properties
Variation in the flexural strength and flexural modulus of the epoxy and flax-epoxy composites is shown in figure 16. Flexural result of the composites shows a similar trend to that of tensile property. From figure 15(a) it is observed that 45 FE composites can resist the bending load up to 220 N. About 83% improvement in bending load resisting capacity is exhibited by 45 FE composites when compared to pure epoxy. Flexural strength and flexural modulus of epoxy resin are 59.92 MPa and 2.979 GPa respectively. Flexural strength and modulus of the composites increase with an increase in the fiber content. It is evident from figure 16 that the maximum flexural strength and flexural modulus attended by 45 FE composites is 109.50 MPa and 6.389 GPa respectively. Approximately, 84.74% and 114.4% of remarkable improvement in flexural strength and flexural modulus of 45FE composites over pure epoxy resin may be due to the strong interfacial adhesion between hydrophobic resin and chemically modified fiber. The flexural test measures the stiffness of the composite materials regardless of their constituent and Flexural property is governed by many factors such as the concentration of chemical treatments, type of chemical treatments, modification of resin, and type of reinforcement of fiber to the matrix phase. From these aforementioned factors, one can improve the flexural properties of the composites by imparting strong fiber-matrix interaction. During the bending test, the upper and lower surface of the specimens is subjected to simultaneous compression stress and tensile stress respectively. When the adhesion at the interface of fibre-matrix increases, then flexural strength and flexural modulus gets increases because of which effective transferring of the load likely to takes place within the composites [37]. Another reason for the improvement in flexural property of 45 FE composites maybe because of the weaving architecture of flax fiber. This custom made basket woven fabric may have provided better interlace of flax fiber in warp and weft direction [11]. Besides, the presence of mesh-like interlocking point in the woven fabric may have assisted the flax-epoxy composites to bear higher loading before fracture occur [36]. Furthermore, it is observed from the surface morphology of the custom made fabric that, high quantity of fiber in warp direction when compared to weft direction might have resulted in improvement in flexural and tensile properties of the composites. Table 5 shows the comparison of the flexural strength property of the other natural fiber composites with the present flax/epoxy composites.

Figure 15. (a) Flexural load versus displacement (b) Flexural stress versus strain curve for epoxy and flax-epoxy composites.
Download figure:
Standard image High-resolution image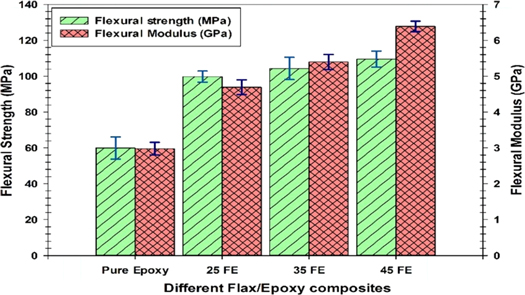
Figure 16. Comparison of the flexural strength and flexural modulus of the epoxy and flax-epoxy composites.
Download figure:
Standard image High-resolution image3.7. Impact properties
Variation in the Impact strength of the epoxy and flax-epoxy composites is depicted in figure 17. Impact test measures the toughness and resistance of the material to a sudden impact load. The experimental result showed that impact strength of the epoxy resin is 59.91 J m−1. Figure 17 implies that increase in the flax fiber loading increases the impact strength of the composites. In 45 FE composites, 400% of enhancement in the impact property is observed which means the material has become tougher and meanwhile it may dissipate more energy before a final fracture occurs. Besides, 45 FE composites shows 38.49% and 14.3% improvement in the impact property compared to 25 FE and 35 FE composites respectively, which may be attributed to strong fibre-matrix adhesion that helps to absorbs more energy and resists the propagation of crack [15]. The ridges formed over the surfaces of the alkali and silane treated flax fiber enhance the interlocking mechanism with the adjacent matrix phase due to the interface of fibre-matrix witness the strong bonding. Moreover, basket-woven flax fiber with high gsm could also have enhanced impact strength of the composites because fabric gives minimum interlace of fiber in the warp and weft directions owing to which flax-epoxy composites showed improved toughness and exhibited higher energy dissipation capacity [50]. Table 5 shows the comparison of the Impact strength property of the other natural fiber composites with the present flax/epoxy composites.

Figure 17. Comparison of the Impact strength of the epoxy and Flax-epoxy composites.
Download figure:
Standard image High-resolution image3.8. Interlaminar shear strength (ILSS)
Short beam shear test is conducted to determine the ILSS of the composites using a universal testing machine. Obtained experimental results are detailed in table 3. From figure 18(b) it is noted that ILSS of the epoxy resin is 5.34 MPa. ILSS of the flax-epoxy composites increases with an increase in fiber loading up to 35 wt.% beyond this, 11% decrement in the strength is noticed. Highest ILSS property is exhibited by 35 FE composites however, 45 FE composites showed 42.88% improvement over its neat epoxy laminates. Furthermore, 25.44% enrichment in ILSS is noted for composites when reinforcement of fiber content is increased from 25 wt.% to 35 wt.%. This may be due to the strong adhesion between the fiber-matrix interface and mechanical property of the matrix [29, 51]. The chemical modification increases surface adhesion of the hydrophilic nature of fiber with hydrophobic resin. Apart from this, weaving design of the fabric reduces the interlace between the yarns in warp and weft direction which may also have influenced the ILSS property of the composites. Another important factor which determines the nature of the composites is elongation at break, which is obtained during the ILSS test. From figure 18(a) it is obvious that elongation at break of the pure resin 5.8% and then rose to 14.5%, after increasing fiber loading to 45 wt.%. The test revealed that brittleness of the epoxy decreased with an increase in flax fiber content which means ductility properties have been imparted by reinforced fiber in the flax- epoxy composites. ILSS of 45 FE composites showed inferior to the 35 FE composites though it has a higher elongation at break. This may be because of the presence of void in the laminates [51] and may also have attributed to the alignment of the fiber in the same direction while the load is applied during testing of the composites

Figure 18. (a) Elongation at a break during ILSS test (b) ILSS of the epoxy and flax-epoxy composites.
Download figure:
Standard image High-resolution image3.9. Dynamic mechanical analysis
3.9.1. Storage modulus (E')
Storage modulus (E') tells about the temperature-dependent stiffness behaviour of the materials. It also measures the energy absorbed by the material per cycle of oscillation [52]. Furthermore, E' provides information about the load-bearing capacity of the materials too. Figure 19 shows variation of storage modulus of the Epoxy and Flax-Epoxy composites concerning temperature for different frequencies and E' values at the glassy region is tabulated in table 6. Epoxy resin exhibited a storage modulus of 11.8 GPa in the glassy region. E' increases when fiber loading in the composites is getting increased. Amongst the fabricated composites 35 FE has exhibited 151% improvement in the storage modulus compared to virgin epoxy, because of the strong interface between fiber-matrix [53]. Figure 19 showed that Initially E' of Flax-Epoxy composites is higher at glassy region but as the temperature increases beyond 60 °C, E' started declining because of the reinforced fiber loses stiffness at the higher temperature [52, 54]. As far as reduction of E' in epoxy is concerned, maybe due to the higher molecular mobility of polymer chain beyond glass transition temperature (Tg) (Including rubbery region) [15, 53]. Flax-epoxy composite's behaviour in the rubbery region E' has been controlled by the stiffness of the fibers employed. From the E' values presented in table 5, it is observed that 45 FE composites showed 522% improvement in E' (rubbery region) value compared to epoxy resin, owing to the effective stress transfer from epoxy resin to flax fiber. Also enhancement of E' is influenced by the irregular basket design of flax fabric, because stress is equally distributed in both warp and weft direction of flax yarns [55]. Furthermore, E' behaviour is carried for epoxy and Flax-epoxy composites at different frequencies. From the plots, it is evident that E' exhibited higher values at higher frequencies when compared to lower frequencies for the function of varying temperature and this typical behaviour is noticed in all the composites because time considered by the molecular chain for oscillation is quite lesser than the time required for relaxation. Moreover, long time measuring mode for samples under relentless oscillating forces makes them highly elastic and that could be another paramount factor for improvement in E' value as a result of increasing in frequency level [14]. Therefore, the maximum E' has been observed at 10 Hz. 35 FE showed the highest value of 30.44 GPa at the glassy region and 45 FE composites showed 4100 MPa in the rubbery region.

Figure 19. The storage modulus of the fabricated epoxy and Flax-Epoxy composites at different frequency levels (a) 0.5 Hz (b) 1 Hz (c) 2 Hz (d) 5 Hz (e) 10 Hz.
Download figure:
Standard image High-resolution imageTable 6. The storage modulus of the Flax-epoxy composites.
| Storage Modulus (GPa) at Glass region | |||||
|---|---|---|---|---|---|
| Frequency | |||||
| Composites | 0.5 Hz | 1 Hz | 2 Hz | 5 Hz | 10 Hz |
| Pure Epoxy | 11.8 | 12.06 | 12.22 | 12.34 | 12.54 |
| 25 FE | 27.12 | 27.37 | 27.68 | 28.06 | 28.35 |
| 35 FE | 28.87 | 29.24 | 29.64 | 30.00 | 30.44 |
| 45 FE | 26.09 | 26.29 | 26.71 | 27.08 | 27.58 |
3.9.2. Loss modulus: (E'')
Loss modulus (E'') gives the information about viscous properties and the quantity of energy dissipated from the material in the form of heat per oscillation cycle [15]. Loss modulus curve as a function of temperature at different frequencies for epoxy composites and flax-epoxy is shown in figures 20(a)–(e) and corresponding values of Tg has been indicated in table 7. Lowest loss modulus value 12.5 GPa is exhibited by epoxy resin because of the increasing molecular mobility of the polymer chain at higher temperature region and had enhanced by reinforcing them with the flax fibers (flax/epoxy composites). Around, 193% of improvement in the E'' is observed for 45 FE composites when compared to epoxy, because strong bonding of fiber-matrix caused by alkali and silane treatment of the fiber and also because of the architecture effect of the fabric [36, 55]. From figure 20, it is apparent that, loss modulus curves for all the samples increases with increase in temperature up to a certain point and beyond which, E'' decreases. Furthermore, the highest peak in the loss modulus curve gives glass transition temperature (Tg) which is considered to be more realistic value than obtained from tanδ curve [56]. As it is evident from the Figures that, Tg value of the flax-epoxy composites have shifted towards the right and this may be attributed to strong resistance to molecular mobility offered by the reinforced flax fiber [15]. Whereas in the case of epoxy resin, a marginal shift in Tg is noticed. Effect of frequency on the loss modulus of epoxy and flax-epoxy composites is also studied. As the frequency level increases, E'' value increases. 17.5%, 13.3%, 6.5% and 5.3% improvement in the E'' value has been found for 45 FE composite at 10 Hz when compared to 0.5 Hz, 1 Hz, 2 Hz and 5 Hz respectively. Similar observation of enhancement in E'' value has been found in all fabricated composites for varying temperature when they are operated at different frequency conditions. However, small changes have been observed in pure epoxy resin. The highest value of Tg is found for 45 FE composites when compared to other fabricated composites and epoxy for all frequency conditions. This may be attributed to strong adhesion between flax-fiber and epoxy resin that leads to uniform stress transfer. Another reason maybe because of the absorption of energy by the reinforced fiber and type of woven architecture. According to kathiresan and omkumar [14] increasing in the E'' as a result of the rise in the internal friction. From the figures, it is worth to note that, broadening the E'' curve increases with an increase in fiber content. This is due to the strong fiber interface transmuting the materials to the highly amorphous region [14]. Finally, the study implied that the thermal stability of the fabricated composites has been improved with the addition of basket-woven flax into pure epoxy resin.

Figure 20. Loss modulus curve of the epoxy and Flax-Epoxy composites at different frequency levels (a) 0.5 Hz (b) 1 Hz (c) 2 Hz (d) 5 Hz (e) 10 Hz.
Download figure:
Standard image High-resolution imageTable 7. Loss modulus and Tg value of the flax-epoxy composites.
| Loss Modulus (GPa) at Glass region | Glass Transition Temperature (Tg) from Loss modulus curve | |||||||||
|---|---|---|---|---|---|---|---|---|---|---|
| Frequency | Frequency | |||||||||
| Composites | 0.5 Hz | 1 Hz | 2 Hz | 5 Hz | 10 Hz | 0.5 Hz | 1 Hz | 2 Hz | 5 Hz | 10 Hz |
| Pure Epoxy | 12.5 | 12.45 | 12.91 | 14.25 | 14.75 | 65.44 | 63.98 | 67.83 | 66.99 | 66.18 |
| 25 FE | 35.23 | 33.38 | 40.64 | 40.21 | 41.88 | 69.80 | 68.81 | 71.90 | 71.67 | 74.63 |
| 35 FE | 35.55 | 34.71 | 43.92 | 41.24 | 42.36 | 69.86 | 68.91 | 72.11 | 71.51 | 74.39 |
| 45 FE | 36.74 | 38.07 | 40.72 | 41.56 | 43.15 | 69.31 | 72.42 | 71.54 | 74.71 | 74.81 |
3.9.3. Tan δ (damping ratio)
Tanδ (Damping) is defined as the ratio of storage modulus to loss modulus. It measures the impact properties of materials [14]. Besides it also tells about the level of interaction between fiber and matrix (polymer) phase. Tanδ curve for epoxy and flax-epoxy composites as a function of temperature at different operating frequencies is shown in figure 21 and the corresponding value of Tg has been provided in table 8. It is very evident from the graphs that, epoxy resin has the highest peak of Tanδ than any other fabricated composites because epoxy has strong molecular mobility at higher temperature [53]. But these movements are arrested by the incorporation of chemically treated flax fiber into epoxy resin. By doing so strong adhesion establishes between fiber-matrix and results to uniform stress transfer. Tanδ peak values have found to decrease with an increase in the weight fraction reinforcement of flax fiber. Also, it is evident from the graph that, Tg value is shifting towards higher temperature side as reinforcement of the fiber increases up to 35 wt.%. however, a very small marginal difference in the Tg is found with 45 wt.% reinforcement. This indicates that the load-bearing capacity of the composites has got improved with the incorporation of flax-fiber at a region of higher temperature and also means that interface of fiber-matrix has improved [13, 14, 53]. Higher damping peak in the Tanδ curve indicates that materials dissipate more energy and increase the interaction of fiber/matrix. Lower damping curve indicates that material can absorb more energy and become stiff at a higher temperature. The study inferred that epoxy resin has shown high damping peak which implies that, it has dissipated more energy and behaves like a good damping material. Tanδ peak value is short for fiber loaded composites and Tanδ curves increase with an increase in the frequencies. Indicates that interaction between fiber and matrix is poor however energy absorption by the material has been improved and so is the stiffness. Furthermore, Glass transition temperature (Tg) determined from Tanδ curves is found always higher than the value found from the loss modulus curve [56]. Since loss modulus can only measure the energy dissipated during one cycle of oscillation, whereas in Tanδ analysis outcome of storage modulus E' considered, which may influence the damping result [14].

Figure 21. Tanδ curve of the fabricated Flax-Epoxy composites at different frequency levels (a) 0.5 Hz (b) 1 Hz (c) 2 Hz (d) 5 Hz (e) 10 Hz.
Download figure:
Standard image High-resolution imageTable 8. Tan δ and Tg value of the epoxy and fabricated composites.
| Tan δ | Glass Transition Temperature (Tg) from Tanδ curve | |||||||||
|---|---|---|---|---|---|---|---|---|---|---|
| Frequency | Frequency | |||||||||
| Composites | 0.5 Hz | 1 Hz | 2 Hz | 5 Hz | 10 Hz | 0.5 Hz | 1 Hz | 2 Hz | 5 Hz | 10 Hz |
| Pure Epoxy | 0.855 | 0.900 | 0.944 | 0.986 | 1.00 | 75.46 | 74.17 | 78.37 | 77.48 | 81.07 |
| 25 FE | 0.395 | 0.403 | 0.411 | 0.421 | 0.423 | 73.71 | 76.61 | 75.57 | 78.87 | 82.07 |
| 35 FE | 0.400 | 0.400 | 0.424 | 0.412 | 0.417 | 73.73 | 76.71 | 75.78 | 78.89 | 82.08 |
| 45 FE | 0.361 | 0.359 | 0.356 | 0.368 | 0.367 | 73.41 | 76.31 | 75.45 | 78.61 | 81.89 |
3.9.4. Cole-Cole plot analysis
Relation between storage modulus and loss modulus is studied using cole -cole plot analysis. Figures 22(a)–(e) shows the cole-cole plot of epoxy and flax-epoxy composites at different frequencies. From this plot, one can analyse the structural characteristics of the materials such as fiber-matrix interaction and changes in the homogeneity of the materials to heterogeneous (after incorporation of the fiber into the matrix phase). From the cole-cole graph, it is observed that the curve got broaden for the flax-fiber reinforced epoxy composites. Among the fabricated composites, 45 FE has shown a widen curve at all frequency levels which indicates that strong interaction between fiber and matrix exists thus, the strength of the composites got enhanced.

Figure 22. Cole-Cole plot of the fabricated Flax-Epoxy composites at different frequency levels (a) 0.5 Hz (b) 1 Hz (c) 2 Hz (d) 5 Hz (e) 10 Hz.
Download figure:
Standard image High-resolution image3.9.5. Effectiveness of the composites:
Modulus of the composites can be apprehended by determining the coefficient of the effectiveness using equation (1) [15, 52]. In simple words, the influence of the reinforcement phase on the modulus of the flax-epoxy composites can be indicated by this constant (coefficient). Experimentally determined coefficient values are detailed in table 9. Higher the value, lower is efficiency and vice-versa. It can be seen that lowest value is obtained by 45 FE amongst the prepared composites lot, this may be due to strong interface adhesion between fiber and matrix, as a result of which, effective stress transfer takes place between them. Also, the architecture of the flax fabric aids the composites to transfer the load uniformly in both warp and weft direction. Furthermore, it is noted from figure 23 that the coefficient increases for all the composites up to 5 Hz and later no appreciable improvement is noticed. 35 FE and 45 FE composite exhibited low effectiveness value even when they are operated at higher frequency levels. This shows the stability imparted by the flax fiber reinforcement in the epoxy resin. Sathish kumar [19] studied the effect of weight fraction and fiber length of short fiber reinforcement of snake grass in polyester composites and had reported the value of effectiveness constant in the range of 0.088–0.092. According to his report, frequencies increases the effectiveness of the composites. Gupta et al [15] studied the influence of fiber weight fraction of jute on static and dynamic mechanical properties of the composites. They reported that Jute fiber with the highest reinforcement (30 wt.%) showed a low value of effectiveness coefficient. This had attributed to strong jute-fiber-matrix bonding. From those reports, it is evident that measured values are in good agreements with the reported value. Thus basket woven flax reinforced epoxy composites can be used in the automotive applications for making such as door panels, seatback supports, dash panels, hoods and spoiler due to their improvement in mechanical and DMA properties.

Table 9. Effectiveness coefficient of the flax-epoxy composites.
| Effectiveness coefficient (C) | |||||
|---|---|---|---|---|---|
| Frequency | |||||
| Composites | 0.5 Hz | 1 Hz | 2 Hz | 5 Hz | 10 Hz |
| Pure Epoxy | — | — | — | — | — |
| 25 FE | 0.0601 | 0.0695 | 0.0729 | 0.0736 | 0.0736 |
| 35 FE | 0.0591 | 0.0719 | 0.0755 | 0.0755 | 0.0717 |
| 45 FE | 0.0368 | 0.0445 | 0.0463 | 0.0463 | 0.0453 |

Figure 23. Effectiveness of the Flax-epoxy composites.
Download figure:
Standard image High-resolution imageWhere  is the storage modulus in the glassy region
  is the storage modulus in the rubbery region
3.10. Sound absorption behaviour of the composites
Figure 24 shows the variation of sound absorption coefficient (SAC) of epoxy resin and flax-epoxy composites when they are operated for the frequency range of 0 to 6400 Hz. The graph shows that fiber reinforcement has certainly influenced the sound absorption property of the composites. SAC can be defined as the amount of energy absorbed by the composite materials upon the total energy incident on it [57]. SAC of the Flax epoxy composites increases with increases in frequencies. This is because of the hollow lumen structure of the natural fiber [32, 57]. Even SAC property of the epoxy resin concerning different frequencies revealed the same pattern as it is seen in flax-epoxy composites, this may be attributed to the thickness and pores content in the epoxy laminates. As per the report given by Rayleigh, pores materials, the material with higher thickness will decide the SAC property of the materials [58, 59]. Fatima and Mohanty [23] reported that thicker material exhibited better SAC than thin materials. From the figures, it is seen that at 1200 Hz, SAC decreases and again it increases after 2000 Hz. This decrease and increase in SAC by the composites may be due to the specific characteristics of flax fiber because at lower frequencies fiber may reflect the sound and in contrary at higher frequencies may absorb sound. From the same figure, it is observed that an increase in fiber loading has increased that SAC of the composites. Higher SAC of 0.48 found for the 45 FE composites. Because an increase in the fiber loading makes the composite a compact structure. Incident sound energy (wave) on the sample has to travel a longer distance through this compact structure since compact structures contain less void. Thus, SAC is increased indirectly because of the internal frictional losses and viscous losses as a result of the reduction in sound energy [60]. Furthermore, it is interesting to note that at middle and higher frequencies SAC has been increased. This may be attributed to the density of the composite materials. It is already discussed that; density of the Flax-epoxy composites increases with an increase in fiber content. Due to which fiber per unit area is increased and leads to an upsurge in energy losses as the surface frictional losses increases and so SAC. Alkaline treatment and chemical modification of the fiber have shown the tremendous effect on sound absorption properties of the composites. According to the previous reports [23, 32, 61] that due to the chemical modification of the fiber, impurities such as hemicellulose, cellulose, lignin, wax and oils are removed from their surfaces. Thus making the fiber surface rougher which facilitates for the increasing friction with sound waves and increased SAC.

Figure 24. The sound Absorption coefficient of the epoxy and flax-epoxy composites.
Download figure:
Standard image High-resolution image3.11. Fractography analysis
Surface morphology of the samples fractured during tensile, flexural, impact and ILSS tests are carried out using SEM to study their failure mechanism. Figure 25(a) shows the tensile fractured surface of the 25 FE composites. It is evident from the micrographs that failure occurred along the direction of warp due to the application of longitudinal load. The weak interface of fiber-matrix is inevitable at the lower loading of fiber leading to voids formation. Voids, cavities and poor interfacial adhesion between fiber and matrix are beneficial for poor stress transfer mechanism and hence 25 FE composites going to fail in advance. However, in the case of 45 FE tensile fractured sample, as shown in figure 25(b), strong adhesion of fiber-matrix is evident which is responsible for the uniform distribution of stress from the matrix to fiber. Matrix damage, fewer voids, minimum crack on the matrix surface makes 45 FE composite to be more superior among flax-epoxy composites.

Figure 25. SEM images of the Tensile fractured composites (a) 25 FE (b) 45 FE.
Download figure:
Standard image High-resolution imageFigures 26(a), (b) shows the fractured surface of the composite samples failed during the flexural test. Surfaces of the flexural samples are subjected to tensile and compressive stress simultaneously. Therefore, composites should have a stronger adhesion between the fiber-matrix interface so that stress can be transfer to other ends of the laminates with less damage. It means strong interfacial adhesion facilitates for load-bearing capacity in the composites eventually there is an improvement in bending strength. It is evident from the figure 26(a) that, 25 FE composites poor fiber-matrix bonding due to which bundles of warp fiber failed to resist the applied load and non-uniform stress transfer occurs from warp to weft fiber leading to early failure of the composites. Matrix damage or matrix crack very often observed in the fiber reinforced composites because of the improper mixing of resin and hardener and also because of the fabrication process employed. Micro holes may also be seen in the composites due to improper wetting of flax fiber by the epoxy resin which is also one of the main cause for building a poor interface between fiber and matrix. In case of 45 FE composites (figure 26(b)) strong adhesion of fiber-matrix showing resisting to the applied load and matrix damage, voids, cracks, debonding, and delamination of the fabric layer have found to be less when compared with the other fabricated composites. Hence the composites with higher fiber loading exhibited better flexural strength and modulus,
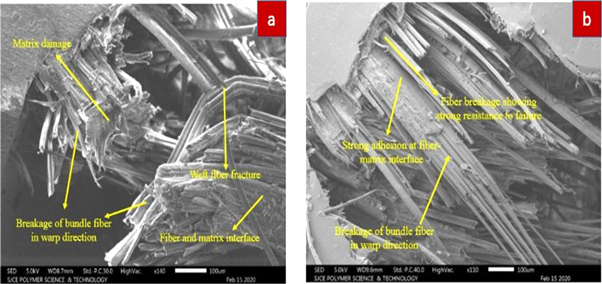
Figure 26. SEM images of the Flexural fractured composites (a) 25 FE (b) 45 FE.
Download figure:
Standard image High-resolution imageFigures 27(a), (b) shows the fractured surface of the composites samples failed during the impact test. Failure mechanisms such as fiber debonding, fiber pull out, delamination, matrix damage all sort of failure mechanism is evident in the impact fractured samples. Fiber pulls out is the major reason for the failure of composites in an impact test. This happens when there exists a weak bonding between fiber and resin. Also during the fabrication of lower weight fraction (fiber) composites, it is a difficult process to degas the air from the laminae because of the excess resin present over fabric which may lead to the formation of microholes/pores. These pores are sufficient to cause premature failure in the material system. As evident from the micrograph 27(a), that 25 FE composites showed higher fiber pull out owing to weak fiber-matrix bonding. However, it is evident in the case of 45 FE that strong bonding of fiber with the matrix can resist sudden load damage which might have ensued to the more energy absorption compared to other flax-epoxy composites.

Figure 27. SEM images of the Impact fractured composites (a) 25 FE (b) 45 FE.
Download figure:
Standard image High-resolution imageFigures 28(a), (b) shows the fractured surface of the composites samples that failed during the ILSS test. Failure mechanism observed in the ILSS tests is similar to that of the flexural test. Delamination, fiber splitting, matrix fracture, debonding, fiber pull out are also observed in the fractured composites. Minimum interlace of warp and weft fiber enhanced the uniform stress distribution within the laminates. However, due to weak interfacial bonding of fiber/matrix in 25 FE composites stress from warp fiber non-uniformly transfer across weft fiber resulting in the early failure of composites at lower load. But in case of the high fiber content composites, it is apparent from the micrograph that, matrix and fiber resisting the applied load due to strong bonding between them. Delamination is comparatively less in the 35 FE composites which shows the ability of the material to transfer the stress with minimum damage.

Figure 28. SEM images of the ILSS fractured composites (a) 25 FE (b) 35 FE.
Download figure:
Standard image High-resolution image
4. Conclusions
Characterizations on physico-mechanical, dynamic mechanical and sound acoustic properties of the novel-flax-epoxy composites have been successfully accomplished. From the obtained experimental results, the following conclusions are made:
- 1.Alkali and silane treatment has induced changes in the crystallinity of the virgin fibers and it is authentically confirmed from XRD analysis.
- 2.Mechanical results revealed that 45 FE composites showed magnificent improvement in tensile, flexural, impact and hardness properties whereas for ILSS, 35 FE composites have found to be superior amongst prepared one. Fractography analysis explained failure mechanisms endured by the composite samples.
- 3.DMA results showed that there is a considerable effect of frequency on viscoelastic properties of the flax-epoxy composites. The storage modulus of the epoxy improved as the reinforcement of the fiber content increases. Amongst the prepared composites, 35 FE composites exhibited quite impressing improvement in E'. Further, E' value found to be dominated in the glassy region because of the close packing of the molecular arrangements. Storage modulus has found to be higher when the specimens were operated at higher frequency conditions.
- 4.Loss modulus increases with an increase in the fiber loading at all operated frequency conditions. Amongst the fabricated composites, 45FE has exhibited better E'' property. Moreover, fiber addition has influenced the damping factor of the composites. The peak size of the tanδ curve increases with an increase in the fiber loadings and also found to increase with an increase in the frequency level. Moreover, tanδ curve shifts its position towards the higher temperature region while increasing in the frequency. It is very worth to mention that, Tg value obtained from the tanδ curve is found to be higher than that obtained from the loss modulus curve.
- 5.The sound absorption coefficient of the composites increases with an increase in the frequency level. Composites found to be effective sound absorber in the middle and higher frequency range. 45 FE composites showed better sound absorption compared to other fabricated composites. This may be due to compact structure exhibited at higher loading and also may be of inherent lumen structure of the fiber. Furthermore, since flax/epoxy composites turnout to be good sound absorber materials when they are exposed over 3000 Hz, hence these flax/epoxy composites can be used for automotive' s interior applications.