

Abstract
In this work cadmium telluride quantum dots (CdTeQDs) were prepared via one-pot synthesis microwave assisted. Afterwards, CdTeQDs/silica (SiO2)/nigrosine (nigro)/poly (styrene co-methyl methacrylate) (PSCMM) fluorescent nanocomposite (CSNP) powders were prepared via ultrasonic treatment and post drying at 60 °C. The samples were characterized by UV–vis absorbance, x-ray diffraction (XRD) and transmission electron microscopy (TEM). Finally, successful printing tests were performed on security paper at 130 °C. These results show the potential of this nanocomposite to be used as security toner. This printing toner configuration is reported for first time.
Export citation and abstract BibTeX RIS
Introduction
A nanocomposite is a multiphase solid material where at least one of its phases is in the nanometric scale [1]. The nanocomposites associate a basic matrix with nanofillers, such as, carbon nanotubes, fullerenes, nanoclays, nanoparticles, quantum dots (QDs) and others on its polymer chains [2]. QDs are semiconductor nanocrystals with physicochemical properties based on nanocrystal size, such as, highly optical absorption of UV light and highly fluorescence at different wavelength [3]. There are multiple works about quantum dots used as inks [4–7]; nevertheless, to the best of our knowledge their application as printing toner have never been studied. Polymer nanocomposites is a very exciting and dynamic area of nanoscience, where the interaction between a polymer matrix and a colloidal sample of semiconductor nanocrystals are two of the most significant parameters for the improvement and the utilization of these nanomaterials [2]. Printing using toner is one of the most commonly used printing methods. Nowadays, toner industry has almost reached printing resolution limits using common pigments [8]. Thus, is important to find new alternatives
Toner composites have special characteristics as specific color given by the pigment employed, electrostatic charge carrier and the fact that the resolution is directly proportional to the powder size and low melting point [9]. Using the property of fluorescence in quantum dots due to the crystal size, it is possible to prepare a luminescent pigment with a defined wavelength interval. Hence, QDs can offer an advantage over the current technology for the improving the authentication/security on printed documents [3]. One of the fundamental components in a toner composite is Nigrosine, which is widely used as black pigment and positive electrostatic charge carrier [10, 11]. Moreover, another important component of toner composite is the silica powder. Silica nanoparticles allow small powder sizes and the brittleness property when a polymer, of low melting point is used as a matrix on the composite. In this work, different wavelength emission printing toner under UV illumination, tuned by the use of CdTeQDs, have been produced. In this research is reported for first time, a nanocomposite where fluorescent CdTeQDs, SiO2 nano-powder and nigrosine are used as nanofillers in a polymeric matrix of PSCMM with potentially for their application as printing toner
Experimental
Reagents or materials
Materials used for the synthesis of CdTeQDs were sodium tellurite (NaTeO3, 99% Sigma-Aldrich), trisodium citrate dihydrate (Na3C6H5O7 2H2O, Sigma-Aldrich), cadmiun chloride (CdCl2, anhydrous ≥ 99.0% Fluka), sodium borohydride (NaBH4, ≥ 96.0% Aldrich), 3-Mercaptopropionic acid, sodium hydroxide (NaOH, Fermon). For the nanocomposite preparation, silica nanopowder (10 nm, 99.8%), toluene (99.955%), nigrosine (water soluble, Sigma Aldrich) and PSCMM (Mw 100,000–150,000, pellets, styrene 40 mol%, Sigma-Aldrich) were used. All reagents were employed without further purification.
Synthesis of CdTeQDs
The synthesis of CdTeQDs was realized via one-pot method as reported elsewhere [12]. A precursor sample containing solutions of CdCl2, Na2TeO3, trisodium citrate, MPA and sodium borohydride was aged for 32 h. Then, samples of 20 ml were extracted from the precursor solution and heated in an Anton Paar Monowave 300 system, which allowed temperature, heating time, vapor pressure and stirring speed to be controlled. The samples were cooled at room temperature at the end of the reaction using a minor heating time compared with the traditional flask method [13] which creates a temperature gradient. For all the samples, the pH value was 7 and reaction time was 10 min of microwave irradiation.
Preparation of CdTeQDs/SiO2/nigro/PSCMM
For the synthesis of CSNP composites, a solution of PSCMM was prepared dissolving PSCMM pellets in toluene. Then the CdTeQDs solution were precipitated at 2500 rpms with ethanol and dried at 60 °C. Afterwards, silica nano-powder, nigrosine and CdTeQDs powders were added to the PSCMM solution and dissolved under ultrasonic treatment for 10 min and after that, the mixture was dried at 60 °C overnight. Finally, an ultrafine dark gray color powder was obtained.
Characterization
The optical properties for CdTeQDs were studied by UV–vis absorbance with a spectrophotometer Thermo Evolution 600. The resulting powders were characterized by x-ray diffraction PANalytical X'Pert3 Powder at 45 kV and 40 mA TEM using a FEI Tecnai F30 (200–300 kV). Atomic-reolution data was acquired by spherical aberration corrected (Cs-corrected) TEM and Scanning TEM (STEM) using a FEI TITAN Low-base (60–300 kV) and FEI TITAN High-base (60–300 kV) respectively. In both cased the spherical aberrations were corrected assuring a spatial resolution of 0.8 Å. All analyses were performed at 300 kV. For electron microscopy studies, the samples were dispersed in ethanol and sonicated for few seconds. A drop of the suspension formed was deposited onto a holey carbon copper microgrids. Printing tests were performed on security paper using a heat sealer machine at 130 °C.
Results and discussions
Same synthesis conditions were carried out in order to obtain different samples of CdTeQDs where only temperature was varied. The range of the temperature was selected between 100 °C and 160 °C.
Absorption peaks broadens due to larger size distributions with different nanocrystal sizes on the solution at higher temperatures, this effect is called Ostwald 'ripening' [14, 15].
The luminescence was also tested by exposing every solution under the UV-light radiation (396 nm). Figures 1(b) and (c) corresponds to the UV-off and UV-on respectively. This color change may be attributed to the different sizes of the QDs obtained by varying the temperature conditions. This effect has been previously described by Ephrem et al [16].
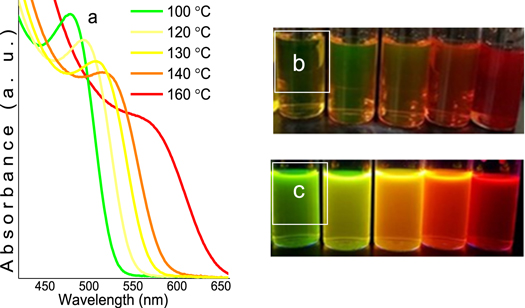
Figure 1. (a) The absorbance spectrum of samples and their luminescence under (b) UV-off and (c) UV-on of CdTeQDs in aqueous solution varying temperature.For every material synthesized the excitonic peak of the optical absorbance was measured. Figure 1(a) shows the curves of the absorbance versus the wavelength (nm) for the 5 materials obtained. In here, it can be clearly appreciated how the temperature of the reaction has a strong relationship with the optical properties as the maximum of every curve is displaced to higher wavelengths values as the temperature is increased, ranging from 460 to 560 nm.
Download figure:
Standard image High-resolution imageIn our work, a study about the dependence of nanocrystal size with heating temperature was realized. This dependence was observed in the optical properties of CdTeQDs through the excitonic peak of the optical absorbance, shifting from 460 to 560 nm, according to UV–vis spectroscopy (figure 1(a)), and the shifting of emission wavelength when the samples are exposed to UV-light radiation (figure 1(c)), due to increase of excitonic absorption with nanocrystal size, according to the calculations of Ephrem et al (2012) [16].
Table 1 exhibits the nanocrystal size for the CdTeQDs obtained statistically. The energy absorption values were calculated for each sample using the Brus et al equation (1) [17] which provides the nanocrystal absorption energy as result of contribution of band gap energy of compound (CdTe) and the absorption energy of the exciton confined.

Where  CdTe quantum dot bandgap energy,
  CdTe bulk bandgap energy 1.5 eV,
  free electron effective mass,
 hole effective mass, 'h' Planck´s constant, 'R' QD radius, 'e' electron charge, '
 ' CdTe relative permitivity 7.1, '
 ' vacumm permittivity.
Table 1. The energy absorption of CdTeQds samples.
| Color | Temperature (°C) | Size (nm) | Eg (eV) | Absorption maximum peak (nm) |
|---|---|---|---|---|
| Green | 100 | 2.32 | 2.64 | 479 |
| Yellow | 130 | 2.51 | 2.524 | 509 |
| Orange | 140 | 3.34 | 2.032 | 518 |
| Red | 160 | 4.24 | 1.795 | 580 |
Figure 2 shows the x-ray diffraction pattern of CdTeQDs, where we can observe three well defined peaks at 25.198°, 41.875° and 49.585° corresponding to the (111), (220) and (311) reflections whit a high peak oriented in the (111) direction, revealing the formation of the face-centered cubical CdTe structure (group F-43m), according to the crystallographic JCPDS chart ICSD 03-065-1046. This result coincides with TEM analysis.
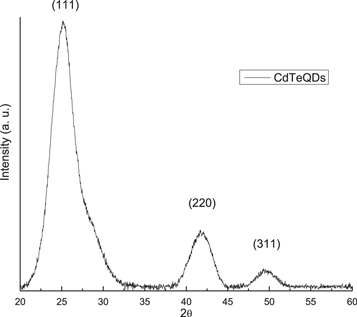
Figure 2. X-ray diffraction pattern of CdTeQDs obtained at 160 °C.
Download figure:
Standard image High-resolution imageStructural investigations were performed by means of transmission electron microscopy. In here Cs-corrected STEM using a high angle annular dark field (HAADF) detector was employed for the observation of the samples. In this mode heavier elements can be differentiated from lighter ones as the contrast is dependent on the thickenss of the sample and on the atomic number of the elements [18]. The image of the sample obtained at 160 °C is depicted in figure 3(a). Despite that some of the QDs are slightly agglomerated a homogeneous size distribution can be extracted observed. The Cs-corrected STEM-HAADF image allows the observation of the atomic structure of the QDs proving the good crystallinity of them, that can be indexed as fcc structures. The d-spacing measured corresponds to the {111} planes along the [110] zone axis obtaining a lattice constant of a = b = c = 6.28 Å, assuming Fm-43m symmetry very similar to value of the crystallographic card 'ICSD 03-065-1046'. The fast Fourier transformation (FFT) shown in the inset (figure 3(b)) corroborates the the good crystallinity of the sample synthesized as well as the orienation respect to the electron beam. The QDs crystal structure is preserved in the CSNP nanocomposite as shown in figure 3(c).
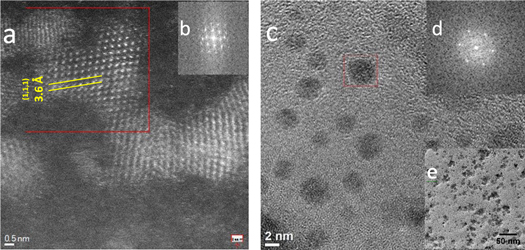
Figure 3. TEM images for CdTeQDs (160 °C) (a); inset of images (a), (c) selected areas inverse FFT, respectively (b), (d); TEM images at different magnification for CdTeQDs-SiO2-nigro-PSCMM nanocomposites (c), (e).
Download figure:
Standard image High-resolution imageFrom the figure 3(e) we can asume that the CdTeQDs, SiO2 and nigrosin may be embedded in the polymer.
Figure 4 shows the different CSNP nanocomposites, which were prepared maintaining the CdTeQDs: SiO2 ratio constant and varying the PSCMM: SiO2 ratio (0, 1, 1.75, 2.5 and 5). As we increase the PSCMM: SiO2 ratio, the adherence to substrate increases, being directly proportional to this relationship, however, the pulverization capacity of nanocomposites, results inversely proportional this ratio. Moreover, when the PSCMM: SiO2 ratio is minor than 1.75, the CSNP nanocomposite consists in a fine powder with lower adherence to substrate, the opposite happens with samples with PSCMM: SiO2 ratio greater than 1.75. It is important to note that the pulverization and adhesion properties of the samples are independent of the nigrosine concentration, because the used nigrosine concentration is very low (SiO2: nigrosine ratio is 1000:1).
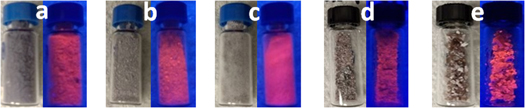
Figure 4. CdTeQDs-SiO2-nigro-PSCMM (a)–(e) nanocomposites according to PSCMM:SiO2 ratio (0, 1, 1.75, 2.5 and 5) under daylight (left) and UV-light (right).
Download figure:
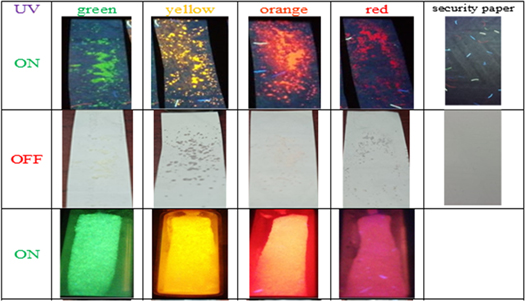
Standard image High-resolution imageFigure 5 shows the toner samples with fluorescence in different colors according to microwave irradiation temperature applied to CdTeQDs: 100, 130, 140 and 160 °C. All the printing tests were successful since there is no detachment between the paper substrate and the nanocomposite. Although the fluorescence is quenched by nigrosine, all nanocomposites result stable, corroborating their potential use as a security toner.
Figure 5. Samples and printing tests of CSNP nanocomposites with luminescence due to UV light irradiation.
Download figure:
Standard image High-resolution image
Conclusions
Highly luminescent CdTeQDs were synthesized via one pot synthesis and heated under microwave irradiation at different temperatures. CdTeQDs were successfully incorporated to SiO2/nigro/PSCMM nanocomposites. This represent the first report of highly luminescent CSNP nanocomposites where the printing tests showed excellent adherence on security paper substrates. The melting point of the resulting nanocomposite was 130 °C. CSNP nanocomposites exhibited potential application as high security fluorescent color security-toner with a variety of luminescent colors from green to red.
Acknowledgments
To CONACyT for the scholarship #245624. AM thanks the NSFC 21850410448 for funding.