
Abstract
Sustainable concrete production and recycling the construction wastes are of utmost importance for today's sustainable urban development. In this study, low-density polyethylene waste was recycled in the form of fibers (LDPF) to produce eco-friendly fiber-reinforced sustainable self-compacting concrete (SCC). The content of LDPF ranged from 0.5% to 3.5% at a raise of 0.5% of the mix's volume. The SCC's features in fresh and hardened states were tested. The slump flow diameter, T500, V-funnel, and L-box ratio were measured for the fresh properties. The compressive, splitting tensile and flexural strengths were tested at the age of 28 days. However, the outcomes indicated that LPDF had some negative effect on the workability features, but all the results of SCC mixtures were within the standard limitations of SCC except that related to the L-box, which satisfied the standards up to 2% of LDPF. However, the incorporation of LDPF enhanced the mechanical properties, especially the flexural strength. The optimum ratio for the LPDF was 2%, which satisfies the required workability and the highest strength with modulus of elasticity. The thermal conductivity decreased with increasing LDPF content in the SCC mixtures.
Export citation and abstract BibTeX RIS

Original content from this work may be used under the terms of the Creative Commons Attribution 4.0 licence. Any further distribution of this work must maintain attribution to the author(s) and the title of the work, journal citation and DOI.
1. Introduction
Concrete has an extensive environmental impact, such as landfills, sea and air pollution [1–3]. Therefore, recycling the concrete materials wastes is of significant importance [4, 5]. The primary contemporary problem in material science is the development and invention of new sustainable and environmentally friendly materials in response to the growing sources of solid waste and the need to mitigate climate pollution [6, 7]. Many investigations focused mainly on providing information on recycling and the balance of solid waste [8]. Consequently, in the former research, e.g. [7, 8], the authors recycled waste ceramic as cement replacement and waste expanded polystyrene as coarse aggregate in SCC production for the purpose of solid waste reduction, yet in this paper we aim to concentrate more on the aspect of waste low density plastic as fiber with high ratios in SCC to reveal development characteristics. One of these waste materials is plastic waste, which is available in nature. Reinforcing concrete with fibers is commonly utilized in different substructures like manufacturing floors, raised slabs, channel linings, etc as a result of enhancement in resistance to loading and reduction in crack propagation and width [9, 10]. Self-compacting concrete (SCC) is an inventive concrete that can flow under its weight, totally filling formwork and getting full compaction without shaking. On the other hand, SCC can pass through spaces between congested reinforcement bars and, at the same time, can conserve concrete's consistency. SCC can be considered as a friendly type of concrete associated with the elimination of vibration, decreasing noise and enhancing safety. Furthermore, the use of SCC can lead to the removal of personal mistakes that result in casting concrete, reduce the budget and duration of any construction work. Meanwhile, there are many pozolanic and nano materials used to reduce cement content and improve SCC characteristics [11–14]. On the other hand, the influence of using various kinds of fibers on SCC has been studied by various academic researchers. The plastic waste has been utilized in concrete as recycled fibers in several investigations [15, 16].
There were many researchers used various kinds and ratios of fibers to study their effect on workability and hardened characteristics of conventional and SCC. Ochi et al [17] stated that PF can be utilized for underground structures subjected to hard situations, like those located near the shore. Moreover, Kim et al [18] used PF in conventional concrete up to 1% then concluded that the elastic modulus and compressive strength were reduced by increasing the PF's ratio. While, cracks resulting from dried shrinkage were late in samples strengthened by PF and the related ductility of beams reinforced by PF was considerably greater than beams without PF. Meanwhile, Pelisser et al [19] examined the performance of concrete reinforced by PF of different fiber lengths up to 0.3% of the mix's volume. They discovered that the elasticity modulus and compressive strength were not effected by the presence of PF but the impact resistance and flexural toughness were enhanced. Foti [20] used the PF as a separate strengthening of the samples and small beams instead of normal rebar. Her findings indicated that there was a suitable bond between PF and concrete and the possibility of using PF as a round or flat bar, or grids for strengthening the concrete structure. Furthermore, Ghernouti et al [21] studied the properties of SCC that contained fibers made through the reusing of waste plastic bags in different lengths and varied ratios. Their findings indicated that mixes contained fibers helped to delay the formation of micro-cracks in SCC, and it was increased the split tensile strength, which were not affected by fiber length.
Mulapeer et al [22] investigated the fresh and hardened properties of geopolymer mortar reinforced by the addition of different types of fiber. They found all types of fibers had a negative effect on fresh properties and enhanced hardened properties.
Furthermore, Al-Hadithi et al [23] studied the effect of the addition of PET fiber (PF) on the hardened properties and impact resistance of SCC slabs. They established that adding PF improved the flexural, compressive, and impact strength. Also, they indicated that PF had a positive role in improving energy absorption when the velocity of impact load is low. Yuan et al [24] conducted research on the hardened properties of zero-slump high strength concrete reinforced by polyethylene fiber and steel fiber together. The findings indicated that the capacity for energy dissipation, flexural and compressive strengths had been enhanced.However, Mastali and Dalvand [25] reported that the using of hybrid combination of polypropylene fiber and reused steel fiber manufactured from tires' wastes had a positive influence on the mechanical properties of SCC specially the flexural strength. Hossain et al [26] studied the durability of lightweight SCC beams reinforced with Polyvinyl Alcohol fiber (PVF), Crumb Rubber fiber (CRF), and High-Density Poly Ethylene fiber (HDPEF). Their findings showed lightweight SCC beams reinforced by HDPEF got greater corrosion resistance, smaller loss of mass reinforcement, fewer cracks, the highest residual peak load, advanced post-cracking shear resistance, and less spalling when compared with lightweight SCC beams reinforced by PVF and CRF. Oghabi and Khoshvatan [27] investigated the properties of SCC by adding four quantities of waste plastic fiber up to 1% with different lengths. They stated that the increased quantity and length of these plastic fibers caused a reduction in passability and flowability. Also, they mentioned that these plastic fibers could enhance tensile and compressive strengths
On the other hand, the effect of different types of fibers on the microstructure characteristics of concrete has been studied by many researchers. The scanning electron microscope (SEM) showed that there was an appropriate level of bond between the basalt fiber and matrix then illustrated that the different surface treatment of the fiber had a dissimilar effect on the strength of concrete [28]. Mohseni et al [29] concluded that the crack width at the fiber-paste interface was lower than at the aggregate-cement contact, and the microstructure of cement paste around the fibers appeared more compact. Furthermore, Tantray [30] reported that the even distribution of the fibers was the main factor for the carbon fibers successfully bridging the gaps and micro cracks and thus increasing the strength. The fibers in the tangled orientation do not contribute to the fiber bridging mechanism and thus result in aggravation of the fresh state and strength properties.
According to previous studies, there was few studies on the effect of reinforced SCC by using waste plastic and restricted up to 1.5% of the concrete volume. This research was done to evaluate the influence of adding variable quantities of LDPF with high ratios on the fresh and hardened properties of eco-friendly fiber reinforced SCC. The slump flow diameter, T500 slump flow, V-Funnel, V-Funnel at 5 min, and L-Box ratio have been utilized to assess the fresh properties of SCC. The compressive, splitting tensile and flexural strengths have been found for assessing the hardened properties. Depending on the empirical equations from the codes to predict the modulus of elasticity, steel concrete bond strength and thermal conductivity of SCC mixtures contained various LDPF content.
2. Experimental
2.1. Materials
In this research, Type I of normal Portland cement that had specific gravity of 3.11 and specific surface area of 287 m2 kg−1 was utilized for production of SCC mixtures. The crushed river aggregate used as coarse aggregate with a maximum size of 20 mm and a specific gravity of 2.61. The chemical components of utilized cement was done by using electron dispersive x-ray spectroscopy (EDS) as shown in table 1. The utilized fine aggregate was natural river sand of maximum size 4.75 mm, 2.53 specific gravity, and fineness modulus of 3.85. The used coarse and fine aggregates were found by sieving analysis satisfied the ASTM C33 [31] and their particle gradations are shown in figure 1. A high range water reducer admixture (HRWRA) that known commercially as GLENIUM 54 with a specific gravity of 1.07 was utilized. In addition, the typical dosage of Superplasticizer is 3.5 kg m−3 for all combinations that affect SCC's qualities, as the result of numerous trials [32]. The waste materials of low-density polyethylene were cut into fibers of rectangular cross-section with a length of 32 mm and 3 mm width, the other properties of low-density polyethylene fiber (LDPF) were examined as illustrated in table 2. Water tap was utilized in the mix and curing of all specimens.
Table 1. Chemical components of CEM I 42.5 N Portland cement.
| Oxide | CaO | SiO2 | Al2O3 | Fe2O3 | MgO | SO3 | K2O | Na2O |
|---|---|---|---|---|---|---|---|---|
| Weight (%) | 62.58 | 20.25 | 5.31 | 4.04 | 2.82 | 2.73 | 0.92 | 0.22 |
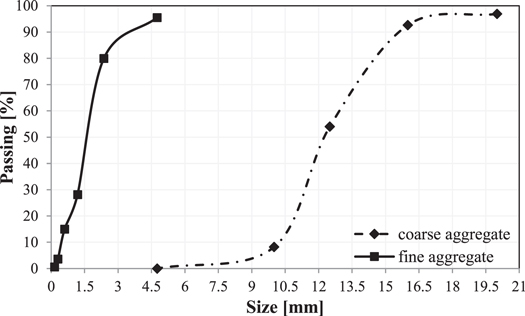
Figure 1. The particles gradation of the used fine and coarse aggregates.
Download figure:
Standard image High-resolution imageTable 2. Properties of low-density polyethylene fiber.
| Property | Value |
|---|---|
| Density | 0.94 g cm−13 |
| Tensile strength | 21 MPa |
| Flexural modulus | 0.37 GPa |
| Melting Temp. Range | 119 to 158 °C |
| Length | 32 mm |
| Width | 3 mm |
| Thickness | 0.4 mm |
2.2. Mix design
In this experimental investigation, self compacting concretes (SCCs) were designed with a fixed water to cement ratio of 0.45 and the quantity of cement was 420 kg m−3 for all the mixes. Based on the results presented in table 3, LDPF was employed in a wide range of volumetric ratios (ranging from 0.5% to 3.5%) in the concrete mix. All the mixes were tested for the impact of LDPF at different amounts on the fresh and hardened characteristics. However, all the mixtures designed to contain fine and coarse aggregates of the same volume approximately. The same dosage of superplasticizer was used in all the mixtures. The selected symbols for the mixes consist of one-letter and numbers; the letter is R or F, where R refers to the control mix that did not contain LDPF and F express the mix that contained LDPF. The numbers refer to the used ratio of LDPF in each mix. For example, the symbol F0.5 refers to a mix contained 0.5% of LDPF.
Table 3. Mix proportions in kg m−3.
| Mix ID | Cement | w/c | Water | Fine aggregate | Coarse aggregate | HRWRA | Plastic fiber (%) |
|---|---|---|---|---|---|---|---|
| R | 420 | 0.45 | 189 | 858 | 870.6 | 3.5 | 0 |
| F0.5 | 420 | 0.45 | 189 | 858 | 870.6 | 3.5 | 0.5 |
| F1.0 | 420 | 0.45 | 189 | 858 | 870.6 | 3.5 | 1 |
| F1.5 | 420 | 0.45 | 189 | 858 | 870.6 | 3.5 | 1.5 |
| F2.0 | 420 | 0.45 | 189 | 858 | 870.6 | 3.5 | 2 |
| F2.5 | 420 | 0.45 | 189 | 858 | 870.6 | 3.5 | 2.5 |
| F3.0 | 420 | 0.45 | 189 | 858 | 870.6 | 3.5 | 3 |
| F3.5 | 420 | 0.45 | 189 | 858 | 870.6 | 3.5 | 3.5 |
2.3. Concrete mixing
A mixer devise of thirty liters capacity was used for mixing all the mixtures. Because of the importance of the duration and sequence of the mixture in the manufacture of SCCs, Khayat et al [33] followed the process for mixing and batching to obtain a consistent and homogenous concrete in this experimental work. The mixing was done in three stages. At the first stage, the cement, aggregates, and LDPF were mixed dryly in the mixer machine of capacity thirty liters for a half minute. The half quantity of water was added to dry components and the mixing was continued for 90 seconds at the second stage. Lastly at the third stage, the HRWRA and the residual amount of water were mixed then added to the mixer and the mixture was mixed for three minutes; the mixer machine was stopped for two minutes, and then the blend was mixed again for two minutes. The ability to pass and the workability of all the mixes were examined in several test ways. Samples were de-formed and placed in water for curing at 24 ± 3 °C for a day before being toughened (compressive, splitting tensile, and flexural strengths) testing at 28 days after being manufactured.
2.4. Testing procedures
There are many tests that can be used to indicate the workability of SCC, as explained in EFNARC [34]. The slump flow diameter (SFD) can be used to assess the flexibility of flowing SCC. A slump was filled with fresh SCC, then lifted the slump to allow the concrete to flow and an average of two deposit directions were recorded. To evaluate the consistency and the resistance of segregation for SCC mixture, the measure of T500 can be utilized, which is equal to the time of getting 500 mm diameter in the testing slump flow diameter. The time of V-funnel flow (VFT) was used to evaluate the viscidness of SCC. Where the funnel fills with fresh SCC and lets it flow out from the lower gate of the funnel, the time for completely flowing is considered as the VFT. On the other hand, the viscosity of SCC can be determined indirectly from the VFT and T500 results according to the respective standards. However, the L-box height ratio test is used to determine the passing ability of fresh SCC mixtures. The L-Box's vertical part is filled with fresh SCC; then the gateway is raised to let the flow of SCC into the horizontal part. The SCC's altitude at the end of the horizontal part and the SCC's remaining in the vertical part are considered as H2 and H1, respectively.
On the other hand, the Compressive strength was evaluated using a 3000 kN capacity compressive strength machine to test 150 × 150 × 150 mm cubes, which is in accordance with ASTM C39 [35]. The flexural strength was determined by testing a 500 × 100 × 100 mm prism using the same machine as the compression test, which met the requirements of ASTM C78 [36]. With regard to ASTM C496–17 [37] methodology, the splitting tensile strength test was carried out using cylinders of 150 mm diameter and 300 mm height. Moreover, the Dry density of concrete samples was also determined using cubes, and the approved method was ASTM C138 [38]. However, all the strengths recorded were the average of three tested specimens at 28 day curing age.
3. Results and discussion
3.1. Fresh properties
Table 4 showed the obtained findings for fresh properties. In fact, it can be seen that the values of SFD for all mixes varied in the range of (615–691) mm, and the T500 slump flow values varied in the range of (2.8–6) sec. The extent of the VFT's values was (5.4–9.7) s and the obtained values of the VFT values at 5 min were in the range of (9.4–18.9) sec. The values of the L-box ratio varied in the range of 0.97–0.7.
Table 4. Fresh properties of concrete with various percentages of fibers.
| Percentage of fibers by volume of concrete | ||||||||||
|---|---|---|---|---|---|---|---|---|---|---|
| Test method | Property | Units | 0 | 0.5 | 1 | 1.5 | 2 | 2.5 | 3 | 3.5 |
| Slump flow | Flow ability | mm | 691 | 679 | 665 | 650 | 643 | 635 | 625 | 615 |
| T50 slump flow | Viscosity | sec | 2.8 | 3.8 | 4.2 | 4.4 | 4.7 | 4.9 | 5.4 | 6 |
| V-Funnel | Filling ability | sec | 5.4 | 5.9 | 7.4 | 8.7 | 8 | 8.5 | 9.2 | 11 |
| V-Funnel at 5 min | Segregation | sec | 9.4 | 10.2 | 10.9 | 12.3 | 13.9 | 15.6 | 17.4 | 18.9 |
| L-Box | Passing ability | % | 0.97 | 0.94 | 0.90 | 0.86 | 0.82 | 0.79 | 0.74 | 0.70 |
| Fresh density | Kg m−3 | 2336 | 2331 | 2322 | 2310 | 2297 | 2285 | 2272 | 2258 | |
3.1.1. Slump flow and T500 slump flow time
The test of slump flow is considered the simple and broadly used test as its values can assess clearly the ability to fill the molds. The relative values of SFD or T500 that mean (SFD or T500 for any mix/SFD or T500 for the mix with 0% LDPF) are related to LDPF ratios as given in figures 2 and 3. Where the SFD denotes the final diameter of the propagation SCC, and T500 denotes the necessary time for propagation of SCC to a circle of 500 mm in diameter. The mix R0 got the best values related to self-compatibility. In general, the relative SFD decreased with an increase in the content of LDPF and the minimum relative SFD was for mix F3.5, which was 0.89. There is a linear correlation between the relative values of SFD and the LDPF ratios with a high value of R2 that equals 0.988. The results of SFD divided the SCC mixes into two classes. The first three mixes (R0, F0.5, and F1.0) were classified as SF2 and all other mixes were classified as SF1 depending on EFNARC [34] as shown in figure 4. The relative SFD results are higher than corresponding values of preceding research [20, 23] that used other types of plastic fiber in SCC, which indicates LDPF has less effect on the fluidity of SCC compared with other fibers.
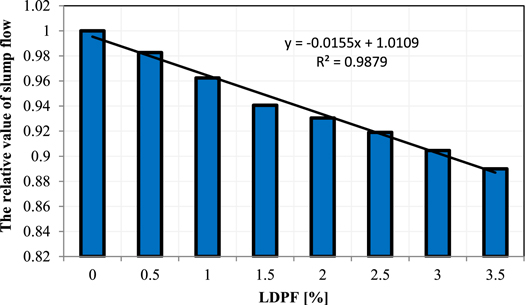
Figure 2. The relationship between the relative value of slump flow and LDPF ratios.
Download figure:
Standard image High-resolution image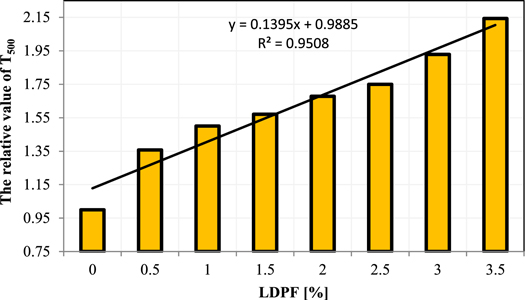
Figure 3. The relationship between the relative value of T500 and LDPF ratios.
Download figure:
Standard image High-resolution image
Figure 4. The relationship between SFD and LDPF with indicating slump flow classes.
Download figure:
Standard image High-resolution imageFigure 5 explains that the viscosity of SCC is classified as VS1/VF1 [32] for all mixes except the last three mixes (F2.5, F3, F3.5), which are within the class of VS2/VF2, and that is considered another indicator of the influence of LDPF on SCC's viscosity [39]. Overall, the relative value of T500 was increased by an increase in the content of LDPF, and the extreme increase was 2.14 for the mix of F3.5 compared with the R0 mix. A linear formula that related to T500's relative values with ratios of LDPF was created with an R2 of 0.95.
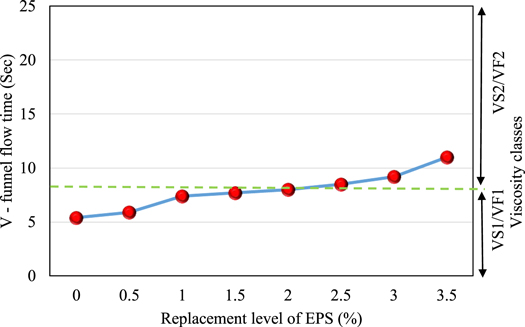
Figure 5. The relationship between VFT and LDPF with indicating viscosity classes.
Download figure:
Standard image High-resolution imageCommonly, there is no separation, hemorrhage, or halo-formalization in all tested mixes. The decrease in SFD with an increase in LDPF content resulted from inclining the fibers to tangle and creating bunches at the flow spread's center and consequently reducing SCC flow capability. It is obtained good flowability for mixes containing small ratios of LDPF which return to the large value of the surficial area for those fibers. The findings corroborate recent research demonstrating that adding waste plastic fibers WPF decreased slump flow levels. Thus, it was recognized that the percentages of decrement within slump flow values increased as the WMR fiber concentration increased. Where it is understood that WMR fibers become entangled and form clusters near the flow spread center, jeopardizing the ability of concrete to flow. Additionally, mixtures with a low WPF percentage have a higher flowability than those with a high WPF level. This may be explained by the fact that WPF fibers have a large specific surface area [40].
There was an increase in T500 for mixes that had a high content of LDPF caused by increasing the viscosity of SCC and accumulative undesirable influence when LDPF ratios upsurge.
The addition of fibers into SCC causes a decrease in the fluidity characteristics as a result of an increase in friction and plastic viscidity between fibers and aggregates, besides the reduction in thickness of the cement paste layers that circumference the particles of aggregates.
There is a rare correlation between values of SFD and T500 for SCC in prior research. It found a linear empirical equation that correlates with T500 and SFD with a high value of the coefficient of determination (0.955) in the current study, as shown in figure 6. Therefore, it is possible to use this equation in the prediction of values T500 from values of SFD or vice versa for an approximate large content range for LDPF (0%–3.5%) with high confidence.
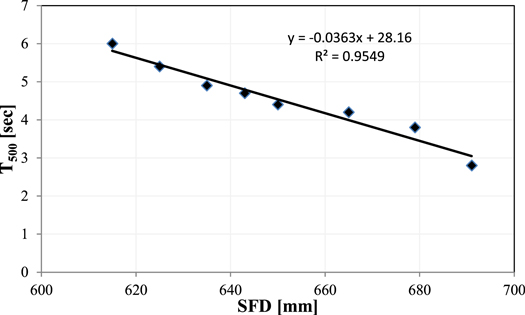
Figure 6. The correlation between slump flow diameter and T500.
Download figure:
Standard image High-resolution image3.1.2. V-Funnel flow time and V-Funnel flow time @5 min
The findings showed that there was an upsurge in VFT when the content of LDPF increased as a result of increased SCC's viscosity [39], as shown in figure 7. Also, the relative values of VFT, which represent VFT of any mix to VFT of mix R0, are lower than the corresponding values in the earlier research [22, 25], which means LDPF has less effect on the filling ability of the SCC compared with other fibers. Furthermore, there is a linear relationship between the relative value of VFT and the LDPF's ratio that has an R2 of 0.962 and an extreme value of 1.796 for mix F3.5 as presented in figure 7.
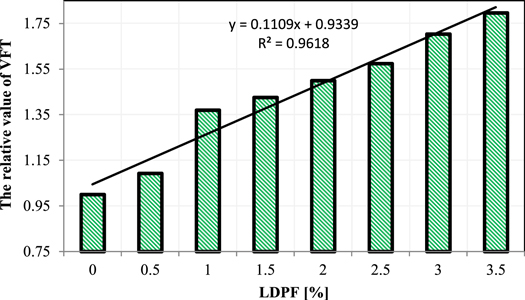
Figure 7. The relationship between the relative value of VFT and LDPF ratios.
Download figure:
Standard image High-resolution imageThe values of T500 relate to VFT in a linear formula with a high coefficient of determination of 0.949 as illustrated in figure 8, which allows calculating the value of T500 from VFT's value or vice versa in good acceptance.

Figure 8. The correlation between V-funnel flow time and T500.
Download figure:
Standard image High-resolution imageThe results of V-funnel flow time @ 5 min (VFT@5) are shown in table 4 and figure 9. It observed that the value of VFT@5 increased by more than 3 seconds for all mixes compared with the corresponding value of VFT. Therefore, all mixes achieved the requirements of EFNARC [34], which can result from the high viscosity of all mixes. However, the relative VFT@5 (VFT@5 for any mix/VFT@5 for R0 mix) increased with an upsurge of the LDPF's ratios as shown in figure 9, where a linear equation was found between relative VFT@5 and LDPF's ratios with an R2 of 0.98.
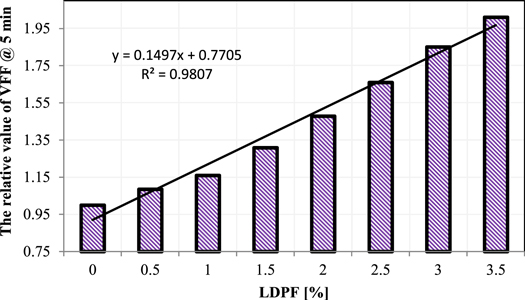
Figure 9. The relationship between the relative value of VFF @ 5 min and LDPF ratios.
Download figure:
Standard image High-resolution imageAlso, it can relate the VFT to VFT@5 in the linear empirical formula that has a coefficient of determination of 0.9 as seen in figure 10.
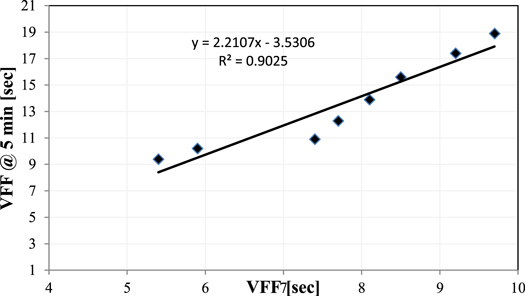
Figure 10. The correlation between VFF and VFF @ 5 min.
Download figure:
Standard image High-resolution image3.1.3. L-box ratio
The facility for passing for SCC was delineated by measuring the L-box height ratio. The relative L-box ratio (LBR), which denotes the LBR of any mix to the LBR of mix R0, decreased by increasing the content of LDPF, and the minimum value of LBR of 0.72 for mix F3.5 as seen in figure 11. All mixtures except F2.5, F3.0, and F3.5 mixes achieved values of LBR greater than 0.8 and satisfied the requirements of EFNARC [34] for overcrowded reinforced concrete structures. Moreover, the less or equal 2% LPDF content has no negative effect on SCC's passing capability. The LDP fibers inhibit the followability of the concrete mixture by impeding the direction of the concrete casting. Furthermore, the friction was detected between the steel reinforcement and the LDP fibers during the L-box test in this study.
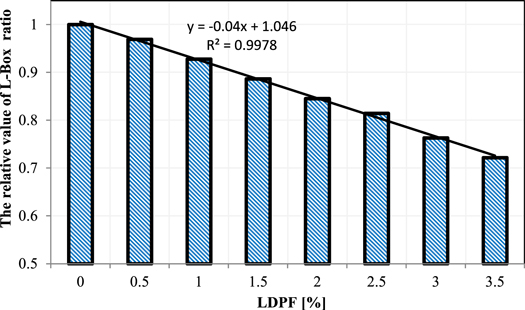
Figure 11. The relationship between the relative value of L-Box ratios and LDPF ratios.
Download figure:
Standard image High-resolution imageFurthermore, there is an approximate perfect fit of the obtained data with the linear equation of R2 equals 0.998 as seen in figure 11. A linear equation related the T500 to L-box ratio with a coefficient of determination of 0.944 as shown in figure 12.
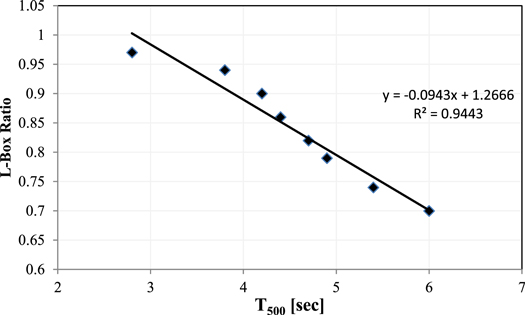
Figure12. The correlation between L-Box and T500.
Download figure:
Standard image High-resolution image3.1.4. Fresh density
The fresh density was greatly influenced by the density of the SCC components.. However, as shown in figure 13, increasing the use of LDP fibers decreased the fresh density of SCC combinations. Researchers, Grubeša et al [40] reported the same results. The reduction could be explained due to the low specific gravity of plastic fibers in comparison with specific gravity of aggregate and cement.
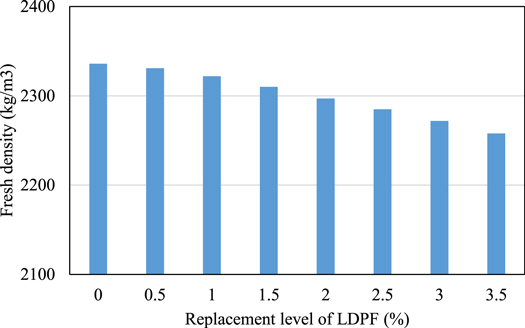
Figure 13. The relationship between fresh density and LDPF replacement level.
Download figure:
Standard image High-resolution image3.2. Hardened properties of SCCs
The results of the effect LDPF ratios on the hardened characteristics of SCC mixtures were presented in table 5.
Table 5. Hardened properties of SCC with different percentages of LDPF.
| Percentage of fibers by volume of concrete | |||||||||
|---|---|---|---|---|---|---|---|---|---|
| Test method | Units | 0 | 0.5 | 1 | 1.5 | 2 | 2.5 | 3 | 3.5 |
| Compressive strength | MPa | 42.3 | 43.6 | 45.2 | 46.7 | 47.9 | 46.5 | 44.7 | 42.1 |
| Split tensile strength | MPa | 3.62 | 4.12 | 4.25 | 4.34 | 4.44 | 4.31 | 4.24 | 4.02 |
| Flexural strength | MPa | 5.39 | 6.07 | 6.35 | 6.48 | 6.87 | 6.32 | 6.08 | 5.71 |
| Dry density | Kg m−3 | 2315 | 2305 | 2290 | 2275 | 2260 | 2243 | 2230 | 2215 |
3.2.1. Compressive strength
The addition of LDPF resulted in a slight increase in compressive strength (CS) for all mixtures except the F3.5 mix compared with R0 as shown in table 5 and figure 14, where the highest upsurge was 13.2% for the F2.0 mix with a value of 47.9 MPa. The enhancement of compressive strength by the use of LDPF was less than the use of other fiber types in prior research [22, 25], which can be returned to the mechanical properties and physical nature of LPDF that could resist developing micro-cracks and stop their spread in an appropriate way. However, an improvement is recognized to an optimum content (2%) when the waste plastic fibers was included, further increment in this content led to a reduction in the mechanical characteristics that might occur due to the weakness within the cement matrix due to the decrease of the compactness of the composite caused by the introduction of voids together with higher content of fiber employed. Furthermore, the increasing of compressive strength results compared with the control mix may be due to the micro cracks between the fiber and the paste was lower than with the aggregate and the loss for higher content of fiber may be a result of microstructure degradation and the formation of microcracks and more voids, which impair the fiber's performance. There was some similarity between improving CS by using LPDF with the results of fiber-reinforced normal concrete [22, 25].
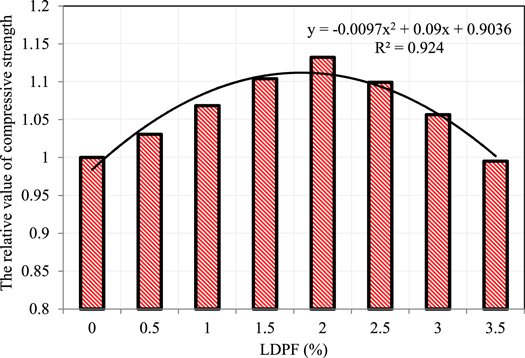
Figure 14. The relationship between the relative value of compressive strength and LDPF ratios.
Download figure:
Standard image High-resolution imageA quadratic equation correlated the relative compressive strength (CS of any mix/CS of mix R0) with the LPDF ratio together with the coefficient of determination of 0.924 as illustrated in figure 14.
3.2.2. Splitting tensile strength
The splitting tensile strength (STS) was increased by using LPDF and the maximum increase was for the F2.0 mix, which was 22.65% greater than the R0 mix as seen in table 5 and figure 15. When the ratio of LPDF increased by more than 2%, the improvement in STS was less. Where, the increase was 19.06%, 17.13%, and 11.05% for the F2.5, F3.0, and F3.5 mixes respectively. The failure of the reference cylinder was unexpectedly riven into two pieces, whereas the cylinders with LPDF had cracked at failure with no splitting into two pieces. The increasing of tensile strength results compared with the control mix may be due to the micro cracks between the fiber and the paste was lower than with the aggregate and the reduction results for higher content of fiber may be a result of microstructure degradation and the formation of microcracks and more voids, which impair the fiber's performance. The relative STS, (the STS in any mix/the STS in R0 mix) correlates with the LPDF's ratio through a quadratic empirical formula with an R2 of 0.95, as given in figure 15.
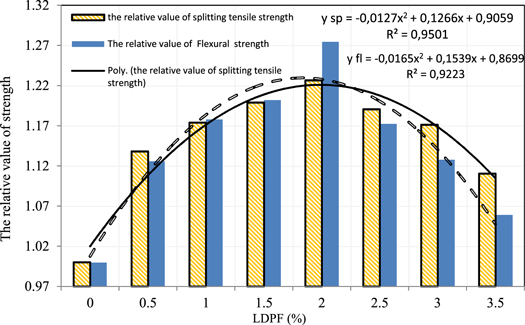
Figure 15. The relationship between the relative value of splitting tensile and flexural strengths and LDPF ratios.
Download figure:
Standard image High-resolution imageIt found a correlation quadratic equation between the STS and CS with an R2 of 0.719 for obtained data as shown in figure 16.
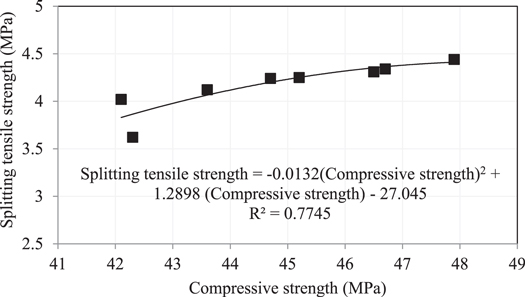
Figure 16. The correlation between splitting tensile strength and compressive strength.
Download figure:
Standard image High-resolution image3.2.3. Flexural strength
There was an increase in the flexural strength (FS) of SCC through utilizing the LPDF. The highest upsurge was 27.46% for the F2.0 mix and the minimum increase was 5.94% for the F3.5 mix compared with the R0 mix as seen in table 5 and figure 15. Use of LPPF led to delayed development of micro-cracks inside the matrix and consequently increased the FS. It found that improvement in FS and STS by utilizing the LPDF is somewhat less than with other types of fiber [22, 25], which may be due to fewer bond properties of the LPDF besides inadequate paste for the fibers that are required for transferring stress from the matrix to the fibers by bonding [41]. Also, there is a quadratic formula that correlates the relative FS, (the FS for any mix/the FS for R0 mix), with LPDF's ratio of R2 0.922 as observed in figure 15.
It can establish a linear equation between the FS and CS with an R2 of 0.891 for experimental results, whereas the logarithm equation is found between the STS and the FS with a 0.9 value for R2, as seen in figures 17 and 18, respectively.
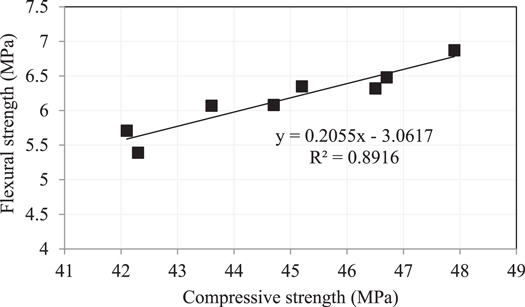
Figure 17. The correlation between flexural strength and compressive strength.
Download figure:
Standard image High-resolution image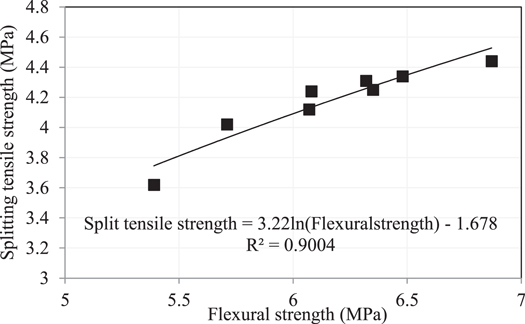
Figure 18. The correlation between flexural strength and splitting tensile strength.
Download figure:
Standard image High-resolution image3.2.4. Dry density
Figure 19 shows that increasing the amount of LDP fiber in SCC mixtures resulted in a greater drop in dry density. LDP fiber has a lower specific gravity than other constituents, which is the primary cause of these decreases in dry density reported by researchers [5, 7, 8]. Fiber, on the other hand, was demonstrated to have a greater impact on lowering the dry density of SCC combinations than any other element, and this impact increased with increasing fiber concentration.
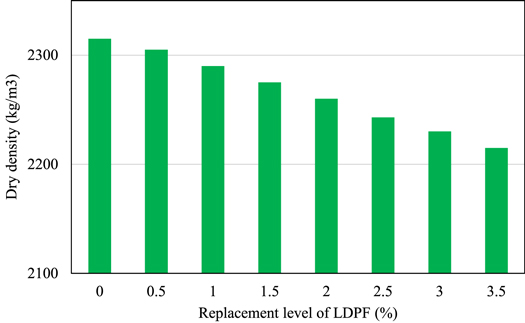
Figure 19. The relationship between dry density and LDPF replacement level.
Download figure:
Standard image High-resolution image3.2.5. Thermal conductivity
It is an important test for durability performance of concrete. However, thermal conduction was determined using a heat transfer analyzer, a measuring machine supplied by surface measurement probe for stiff materials. Thermal conduction was determined using the transient pulse methodology. In accordance with ASTM D5930 [42], a heat urge must be applied to the sample to produce a heat current in thermal equilibrium with the surrounding environment. In this study determined thermal conductivity of concrete by using an empirical equation which presented below and proposed by Valore [43];

Where, k is the thermal conductivity in, W m−1·K, and ω is the density, kg m−3.
The impact of various ratios of LDP fiber on the thermal conductivity of SCC were illustrated graphically in figure 20. According to the results, the thermal conductivity of SCC control mix was 1.30 W m−1.k, which decreased with increasing the LDP fiber content about 6.6% and 11.8% for the mixes F2 and F3.5, respectively. Obviously, the thermal conductivity of SCC was reduced with the LDP fibers content increment. The results coincide with Fraternali et al [44] whose research was about studying the virgin polypropylene and recycled plastic fiber within concrete where thermal conductivities decreased in comparison with plain concrete thermal conductivities. Besides, Yun et al [45] stated that concrete thermal conductivities is reduced through the aid of plastic fibers because of its characteristic. Not only is synthetic fiber characteristic impacting fiber-reinforced concrete thermal conductivity but also the heat transfer can be restrained by small permeable voids [46]. Besides, the decrement in thermal conductivity accompanied by introducing LDPF as plastic fibers are characterized by lower thermal conductivity and the decrement of SCC density.
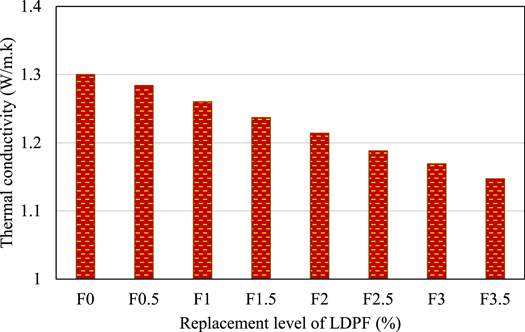
Figure 20. Variation of thermal conductivity of LWSCCs with LDPF replacement level (%).
Download figure:
Standard image High-resolution image3.2.6. Modulus of elasticity
A material's modulus of elasticity measures how well it resists deformation when compressed. The larger the elastic modulus, the more stiff the material. Therefore, a consideration for the concrete's elastic modulus is required in the design. A proportionality condition for strain related to elastic stress can't be taken into account because of the concrete's quasi-brittle nature. As a result, a wide range of methods for determining the elastic moduli of concrete have been developed. General design commonly employs the elastic modulus value of the static elastic modulus. Concrete's elastic modulus may be calculated using empirical methods in all design codes. Elastic module values based on empirical formulas are shown in figure 21 depending on the compressive strengths of SCC mixes. Table 6 shows that three empirical formulas have a comparable capacity to estimate. However, the results obtained from these three codes confirmed that the modulus of elasticity increased with increasing the compressive strength of SCC. In ACI 363 [47], the lowest elastic modulus values were recommended, however ACI 318 [48] recorded the greatest elastic modulus values compared to ACI 363 [47], while CEB-FIP [49] provided an empirical formula for determining the highest elastic modulus values. However, figure 21 illustrates how the amount of LDPF used to make SCC mixtures has a considerable impact on the modulus of elasticity of the mixtures. Furthermore, table 6 demonstrates the elastic modulus values predicted by codes based on the compressive strength of concrete. Moreover, figure 21 shows that both ACI 318 [48] and ACI 363 [47] prediction equations have closest findings.

Figure 21. The elastic modulus of SCCs with LDPF replacement level (%).
Download figure:
Standard image High-resolution imageTable 6. The equations used for prediction.
| Property | Label | Equation |
|---|---|---|
| Modulus of elasticity (Ec) (GPa) | ACI 318 [46] | Ec = 4700 √fc' |
| ACI 363 [45] | Ec = 3320 √fc' + 6900 | |
| CEB-FIP[47] | Ec = 21500 αE (fc'/10)1/3 | |
| Steel concrete bond strength (MPa) | Robins and Austin [50] | τmax = 1.38 √fc' |
| ACI 408R [49] | τmax = 20.23 (√fc' /db) | |
| Mo et al [48] | τmax = ((37.5/(db + ld)0.25)−9.4) √fc' | |
| CEB-FIP [47] | τmax = 2 √fc' |
3.2.7. Steel concrete bond strength
Figure 22 visually illustrates how the amount of LDP used as a fiber in SCC mixtures considerably affects the bond strength at 28 days age. Nevertheless, Assuming a 16 mm diameter and 150 mm embed length, the results of steel concrete bond strength were calculated via empirical equations which presented by Mo et al [50], ACI 408R [51], Robins and Austin [52]and CEB-FIP [49] are dependent on concrete compressive strength as shown in table 6. As shown in figure 22. Increases in LDP fiber content in SCC mixes up to 2% were followed by gradual decreases in LDPF content to produce the steel concrete bond strength anticipated by Mo et al [50], ACI 408R [51], Robins and Austin [52], and CEB-FIP [49] as shown in table 6. The results obtained from the proposed empirical equations were closest except that proposed by CEB-FIP [49], which is higher than the references.

Figure 22. Difference of steel concrete bond strength of SCCs according to codes with LDPF replacement level (%).
Download figure:
Standard image High-resolution image
4. Conclusions
In this experimental investigation, the impact of LDPF with different ratios was studied on the fresh and hardened properties of SCC mixtures to obtain the sustainable concrete production. Based on the findings, the following conclusions were drawn::
- 1.The possibility of recycling low-density waste polyethylene into fibers form and used for reinforcing eco-friendly SCC.
- 2.The reference mix and mixes that contained 0.5% and 1% of recycled LPDF had SFD ranged between 691–665 mm, and these mixes can be considered as SF2 class. The remaining mixes that contained more than 1% and less or equal to 3.5% of LPDF were classified as SF1. The reduction in the SFD by increasing LPDF was methodical and led to an empirical linear equation that can be used to estimate the decrease in SFD in a large range of LPDF (0.5–3.5) %. The LPDF has less effect on SCC's flow ability compared with other fibers.
- 3.The T500 and VFT upsurge with the use of LPDF, and this increase was proportioned linearly with the increase in LPDF. The viscosity of SCC can be considered as class VS2/VF2 for all mixes. The LPDF has less influence on SCC's viscosity and filling ability compared with other fibers.
- 4.There was a reduction in LBR by using LPDF. The mixes that contained less or equal to 2% of LDPF achieved the limits of SCC's passing ability. There was an approximate perfect linear relationship between LBR and LPDF's ratios, which can be valuable in predicting the LPDF's ratio for the value of LBR.
- 5.The LDPF led to a slight increase in compressive strength for all mixes except the mix that had 3.5% of LDPF. The maximum CS was 44.17 MPa for mix F2.0 and the minimum one was 42.1 MPa for mix F3.5.
- 6.The splitting tensile strength improved by adding LDPF and the maximum STS was 4.44 MPa for mix F2.0 and the minimum one was 3.62 MPa for mix R.
- 7.There was a greater improvement in flexural strength by adding LDPF and the maximum increase was 27.46% more than the flexural strength of the reference mix.
- 8.The optimum ratio of the recycled LDPF was 2% to get suitable workability and good enhancement in flexural and splitting tensile strengths.
- 9.The CEB-FIP code's values for the modulus of elasticity were higher than the ACI code's.
- 10.In particular for higher compressive strengths, the steel concrete bond strength results from the CEB-FIP code were stronger than other proposed empirical formulae.
- 11.The thermal conductivity of SCC decreased with increasing the LDP fiber content in the mixtures.
- 12.SCC mixes using recycled waste LDP fiber with varying ratios up to 2 percent met the EFNARC restrictions and ACI's lower strength requirements for structural uses, according to the results of the study. Sustainability has been aided by this production both promoting cleaner manufacture and overcoming some of the challenges related with LDPF waste disposal.
Data availability statement
The data that support the findings of this study are available upon reasonable request from the authors.
Author contribution
Nadhim HAMAH SOR (corresponding author): idea of concept; planning; validation; resources; data curation; writing-original draft; writing-review and editing for this manuscript. Taghreed Khaleefa Mohammed Ali: data curation; writing-original draft and writing-review. Kolimi Shaiksha vali: experimental work; designing; validation; writing-review. Hemn Unis Ahmed: data curation; writing-review. Rabar H. Faraj: resources; writing-review. Naraindas Bheel: data curation; writing—review. Amir Mosavi: validation; writing-review.
Availability of data and materials
Not applicable.
Declarations
Ethical approval
Not applicable.
Consent to participate
Not applicable.
Consent to publication
Not applicable.
Competing interests
The authors declare no competing interests.