
Abstract
In this study, the microstructural, optical, and magnetic properties and specific absorption rate (SAR) of bismuth ferrite/SiO2 nanoparticles were successfully investigated. The coprecipitation method was used to synthesize the nanoparticles. X-ray diffraction patterns showed the presence of sillenite-type Bi25FeO40 with a body-centered cubic structure. The crystallite size of Bi25FeO40 was 35.0 nm, which increased to 41.5 nm after SiO2 encapsulation. Transmission electron microscopy images confirmed that all samples were polycrystalline. The presence of Si–O–Si (siloxane) stretching at 1089 cm−1 in Fourier transform infrared spectra confirmed the encapsulation of SiO2. Magnetic measurements at room temperature indicated weak ferromagnetic properties of the samples. The coercivity of the bismuth ferrite nanoparticles was 78 Oe, which increased after SiO2 encapsulation. In contrast, their maximum magnetization, 0.54 emu g−1, reduced after SiO2 encapsulation. The determined bandgap energy of the bismuth ferrite nanoparticles was approximately 2.1 eV, which increased to 2.7 eV after SiO2 encapsulation. The effect of SiO2 encapsulation on the SAR of the samples was investigated using a calorimetric method. The SAR values of the bismuth ferrite nanoparticles were 49, 61, and 84 mW g−1 under alternating magnetic field (AMF) strengths of 150, 200, and 250 Oe, respectively, which decreased after SiO2 encapsulation. The maximum magnetization and the AMF strength influenced the SAR of the nanoparticles. The results showed that SiO2 has a significant effect in determining the microstructural, optical, and magnetic properties and SAR of the nanoparticles.
Export citation and abstract BibTeX RIS

Original content from this work may be used under the terms of the Creative Commons Attribution 4.0 licence. Any further distribution of this work must maintain attribution to the author(s) and the title of the work, journal citation and DOI.
1. Introduction
Because bismuth ferrite possesses both magnetic and photocatalytic properties, it has generated significant interest. It presents many different crystal structures such as perovskite (BiFeO3), sillenite (Bi25FeO40), mullite (Bi2Fe4O9), and composite (Bi25FeO40/Bi2Fe4O9) structures [1–3]. The Bi25FeO40 and Bi2Fe4O9 structures are generally impurity phases in synthesized BiFeO3. Bi25FeO40 has a cubic structure with a space group of I23. The lattice parameters of the sillenite structure of bismuth ferrite are a = b = c = 1.018 nm [4–6]. In the sillenite structure, the Bi–O framework connects isolated oxygen tetrahedra, and the M site (the location of the metal cation) is at the center of each tetrahedron [7]. Four O atoms surround the M atom, which is located at the center of the MO4 tetrahedra with a distance of 1.65–1.95 Å from the O atoms. This distance is based on the radii of O and M atoms: ∼1.38 Å and 0.27–0.57 Å, respectively [8]. In the sillenite structure of bismuth ferrite, FeO4 tetrahedra are located at the corners and center of the unit cell, which are linked by a Bi–O polyhedral framework [3]. Bi25FeO40 nanoparticles have been reported to have different magnetic properties, including paramagnetic [9], weak ferromagnetic [10], and superparamagnetic [11] properties. In addition, Bi25FeO40 nanoparticles have a narrow bandgap energy of less than 2.5 eV [2, 12, 13]. Recently, bismuth ferrite has been most extensively studied for its applications in sensors, photovoltaics, storage devices, spintronics, photocatalysts, and hyperthermia [14–18].
Hyperthermia is a therapy for cancer treatment. It involves increasing the temperature to a general range of 42 °C–47 °C to destroy cancer cells in a body [19, 20]. The heating mediators commonly used in hyperthermia therapy are magnetic nanoparticles that can produce the heat required to damage cancer cells in the body tissues [21]. In hyperthermia therapy, magnetic nanoparticles are injected into cancerous areas of a body. The heat produced by these magnetic nanoparticles under an alternating magnetic field (AMF) kills the cancer cells without damaging nearby healthy cells. The types of magnetic nanoparticles that provide satisfactory results in hyperthermia applications and have been extensively studied are ferrite-based superparamagnetic nanoparticles, such as MFe2O4 (M = Co, Ni, Mn, Cu, and Mg), and lanthanum strontium manganese oxide [22]. Studies on bismuth ferrite as a heating mediator in hyperthermia are rare. Rajaee et al reported that bismuth ferrite nanoparticles possess unique optical, magnetic, high photoelectric absorption, and inductive heating properties, making them potential candidates for hyperthermia applications [18].
The amount of thermal energy dissipated in hyperthermia applications is determined by measuring the specific absorption rate (SAR). The SAR is the ratio of the thermal power dissipation to the mass of the magnetic nanoparticles, and is influenced by the particle size, saturation magnetization, magnetic anisotropy [23], applied strength, and frequency of the AMF [19, 24]. Research on hyperthermia therapy has also generated interest for encapsulating magnetic nanoparticles with nonmagnetic materials to serve as heating mediators. The encapsulation of magnetic nanoparticles with silica has been reported to have potential for hyperthermia therapy because of the high stability of the silica shells and the sufficient heat generation ability of the core nanoparticles [25].
Magnetic nanoparticles possess hydrophobic surfaces. Therefore, they interact to form a cluster and agglomerate [22]. To expand the application of magnetic nanoparticles, their encapsulation is required to improve their biocompatibility, solubility, and stability and prevent agglomeration. An ideal material for encapsulating the surfaces of magnetic nanoparticles is SiO2, which is non-toxic. Various cross-linking bonds and an inert external shielding layer are formed by SiO2 to protect magnetic nanoparticles [26]. SiO2 encapsulation on the surface of bismuth ferrite can affect its structural, magnetic, electrical, and optical properties [27, 28]. In this study, Na2SiO3 was used as the precursor of SiO2. Na2SiO3 is inexpensive, non-toxic, environmentally friendly, and water soluble. Sulistiani et al [29] studied the microstructural and magnetic properties of Bi25FeO40 nanoparticles using the coprecipitation method. However, they produced Bi25FeO40 nanoparticles without surface encapsulation. Bi25FeO40 nanoparticles encapsulated with SiO2 are rarely used. However, surface encapsulation of ferrite-based nanoparticles with SiO2 has been extensively conducted. SiO2 can successfully encapsulate the surfaces of ferrite-based nanoparticles, thereby reducing their agglomeration and controlling their shape to become more spherical [30, 31].
In this study, Bi25FeO40 nanoparticles were fabricated by the coprecipitation method and encapsulated with SiO2. The coprecipitation method was chosen because it has several advantages: ease of use, low temperature, short duration, ease of obtaining raw materials, and ease of obtaining a single phase of the product [2, 32, 33]. However, SAR studies on SiO2-encapsulated Bi25FeO40 nanoparticles have not yet been reported. Therefore, it is challenging to investigate their properties to obtain extensive information for achieving magnetic hyperthermia applications. This study aimed to explore the microstructural, optical, and magnetic properties and SAR of SiO2-encapsulated Bi25FeO40 nanoparticles.
2. Materials and methods
2.1. Materials
Bismuth oxynitrate (Bi5O(OH)9(NO3)4) (Merck, Germany), iron (III) chloride hexa-hydrate (FeCl3.6H2O) (Merck, Germany), sodium hydroxide (NaOH) (Merck, Germany), chloride acid (HCl 37%) (Merck, Germany), sodium silicate solution (Na2SiO3) (Merck, Emsure), and aquades. All chemical precursors were purchased from Merck (Darmstadt, GFR) and were of analytical grade and used without further purification.
2.2. Synthesis of bismuth ferrite nanoparticles
The coprecipitation method was used to synthesize bismuth ferrite nanoparticles. Bi5O(OH)9(NO3)4 and FeCl3.6H2O were the primary precursors, with NaOH as the precipitant. The first solution contained Bi5O(OH)9(NO3)4 and FeCl3.6H2O in a stoichiometric ratio of 1:5 dissolved in 33 ml aquades. Subsequently 3.4 ml 37% HCl was added to the solution. This solution was stirred at a constant temperature of 100 °C. Simultaneously, the second solution was prepared. Specifically, 6 M NaOH was dissolved in 33 ml aquades and stirred at room temperature. The precipitation process was conducted by gradually dripping the second solution into the first solution and subsequently stirring the mixed solution with pH = 13 (basic) at a constant temperature of 100 °C for 45 min. The obtained precipitate was washed and dried for 4 h at 90 °C. After washing, the pH of the precipitate was 7 (neutral). The bismuth ferrite synthesis process is illustrated in figure 1.

Figure 1. Synthesis process of bismuth ferrite nanoparticles with coprecipitation method.
Download figure:
Standard image High-resolution image2.3. Synthesis of bismuth ferrite/SiO2 nanoparticles
SiO2 solutions were prepared by mixing the Na2SiO3 solution into distilled water and stirring using a magnetic stirrer at room temperature for 30 min. The concentrations of the prepared SiO2 solutions were 20% and 25%. Subsequently 0.5 g bismuth ferrite nanoparticles were added to each solution. Each mixture was stirred at room temperature for 4 h. In the next step, the obtained precipitate was washed. The precipitate was dried at 90 °C for 2 h to obtain a nanosized powder. Figure 2 shows the synthesis process of the bismuth ferrite/SiO2 nanoparticles.
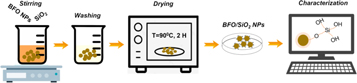
Figure 2. Synthesis process of bismuth ferrite/SiO2 nanoparticles.
Download figure:
Standard image High-resolution image2.4. Characterization of bismuth ferrite
The crystal structures of the samples were characterized by x-ray diffraction (XRD) using an x-ray diffractometer (Shimadzu XD-3H) with Cu Kα radiation. The functional group bonds of the samples were analyzed by obtaining their Fourier transform infrared (FTIR) spectra using an infra-red spectrophotometer prestige (Shimadzu-21). Their morphologies and selected area electron diffraction (SAED) were investigated by transmission electron microscopy (TEM, Jeol JEM-1400). The magnetic and optical properties of the samples were characterized using a vibrating sample magnetometer (VSM) (Riken Denshi Co Ltd.) and an ultraviolet–visible (UV–Vis) spectrophotometer, respectively. The SAR was calculated by measuring the temperature rise as a function of time using a calorimetric method.
3. Results and discussion
3.1. Structural analysis
Figure 3 shows the XRD patterns of bismuth ferrite nanoparticles before and after SiO2 encapsulation. To determine the crystallite size, quantitative phase, composition, and lattice parameters of the samples, the XRD patterns were carefully analyzed using Rietveld refinement. Single-phase formation of Bi25FeO40 (ICDD PDF #460416) was observed before encapsulation with SiO2, and no secondary phase was observed for this sample. The (220), (310), (222), (321), (530), and (611) planes in the XRD patterns of the Bi25FeO40 nanoparticles at 2  = 20–65° showed the most intense peaks, which is in good agreement with the results reported by Verma et al and Kalikeri et al [5, 17]. Bi25FeO40 is a sillenite-type bismuth ferrite with a body-centered cubic cell and I23 space group. The crystallite size of Bi25FeO40 is calculated using the Debye–Scherrer equation:

where t, k, 
 and
and  are the crystallite size, Scherrer's constant with a value of 0.9, wavelength of the x-ray radiation, full width at half maximum value of the x-ray diffraction peak, and half of the diffraction angle, respectively. The crystallite sizes of the Bi25FeO40 nanoparticles in the different samples are presented in table 1. Bi25FeO40 nanoparticles exhibited an increase in the crystallite size after SiO2 encapsulation.

Figure 3. XRD patterns of (a) bismuth ferrite, (b) bismuth ferrite/SiO 2 (20%), and (c) bismuth ferrite/SiO 2 (25%) from experimental data (black line) and Rietveld refinement analysis (color lines). Insert shows XRD pattern of SiO2.
Download figure:
Standard image High-resolution imageTable 1. Structural phases and crystallite sizes (t) of bismuth ferrite.
| Material | Phase Structure | t (nm) |
|---|---|---|
| Bismuth ferrite | Bi25FeO40 | 35.0 |
| Bismuth ferrite/SiO2 20% | Bi25FeO40 | 41.5 |
| Bismuth ferrite/SiO2 25% | Bi25FeO40 | 39.1 |
After SiO2 encapsulation, a peak corresponding to a secondary phase appeared, indicating the presence of Bi2Fe4O9 (ICDD PDF#250090). The peak of Bi2Fe4O9 was not observed for the sample before encapsulation. This may be attributed to the secondary phase forming from the interaction between the material within the samples and the inorganic element of the substrate (Si) [34]. One small peak of Bi2Fe4O9 was identified at  The diffraction peak of Bi2Fe4O9 at approximately
  corresponded to the (002) crystalline orientation [1]. Table 2 summarizes the phase compositions and lattice parameters of the different bismuth ferrite samples. The composition of the Bi2Fe4O9 phase was 12.5% and 13.2% after 20% and 25% of SiO2 encapsulation, respectively, showing an increase with increasing SiO2 concentration. The lattice parameters of Bi25FeO40 and Bi2Fe4O9 were ∼1.01 nm and ∼0.6 nm (peak of 002), respectively. The values are in good agreement with the experimental data from a previous study of Chen et al [9]. Peaks of SiO2 were not found in the XRD patterns of all encapsulated samples because it was possibly amorphous [25].
Table 2. Phase compositions and lattice parameters (a) of bismuth ferrite.
| Material | Phase | Composition (wt%) | a (nm) |
|---|---|---|---|
| Bismuth ferrite | Bi25FeO40 Bi2Fe4O9 | 100 - | 1.01 - |
| Bismuth ferrite/SiO2 20% | Bi25FeO40 Bi2Fe4O9 | 87.5 12.5 | 1.01 0.6 |
| Bismuth ferrite/SiO2 25% | Bi25FeO40 Bi2Fe4O9 | 86.8 13.2 | 1.01 0.6 |
TEM images of bismuth ferrite nanoparticles before and after SiO2 encapsulation are shown in figure 4. The morphologies of the samples agglomerated with an almost spherical shape before and after SiO2 encapsulation. This agglomeration can be attributed to the coprecipitation method producing particles of very small sizes. Thus, SiO2 cannot separate these nanoparticles. The SAED patterns of the samples showed that the crystal structures of the bismuth ferrite nanoparticles before and after SiO2 encapsulation were polycrystalline. Diffraction of the polycrystalline material formed a ring pattern. This can be related the random orientation of the diffracting hkl planes in all possible directions. The diffraction planes of the bismuth ferrite nanoparticles before and after SiO2 encapsulation were (222), (310), (321), (332), and (431), in agreement with the XRD results (figure 3). These diffraction planes indicate Bi25FeO40 with a cubic crystal structure.
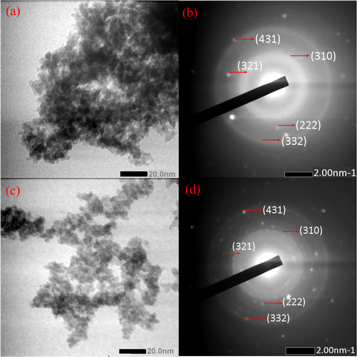
Figure 4. (a), (c) TEM images and (b,d) SAED patterns of bismuth ferrite and bismuth ferrite/SiO2 20%.
Download figure:
Standard image High-resolution imageThe FTIR spectra of the samples are shown in figure 5. The three absorption bands in the 400–700 cm−1 regions of the Bi25FeO40 samples are associated with typical absorption bands for Bi–O and Fe–O [1]. The firm absorptive peaks at 461 and 522 cm−1 are associated with the Bi–O vibration mode. The other two peaks at 578 and 804 cm−1 are the stretching vibration of the Fe–O bond, which demonstrates the cubic characteristic of sillenite-type Bi25FeO40 [35]. These four absorption peaks indicate the presence of Bi–O and Fe–O vibrations in the bismuth ferrite samples before and after SiO2 encapsulation. The peak at 1634 cm−1 is assigned to H–O–H bending, whereas that at 3420 cm−1 is attributed to O–H stretching [36]. H–O–H bending and O–H stretching vibrations are observed in the spectra of all samples. The peaks at approximately 2914 and 2368 cm−1 are assigned to C–H and C=O stretching, respectively. The peak at 1357 cm−1 indicates NO3 − vibration produced by some nitrate ions that are not completely reduced and trapped on the surfaces of the nanoparticles. The absorption bands at 1087 and 1089 cm−1 can be assigned to the Si–O–Si (siloxane) stretching vibrations in the SiO2 and bismuth ferrite/SiO2 samples, respectively. These vibrations confirm SiO2 encapsulation of the surfaces of the Bi25FeO40 nanoparticles [37].

Figure 5. FTIR spectra of (a) SiO 2 , (b) bismuth ferrite, and (c) bismuth ferrite/SiO2 20%.
Download figure:
Standard image High-resolution image3.2. Optical analysis
Figure 6 shows the absorption spectra of bismuth ferrite and bismuth ferrite/SiO2 with a SiO2 concentration of 20%. The absorption spectra of the two samples are in the UV and visible region, i.e., in the wavelength of approximately 200–600 nm, which is in good agreement with the results of Ren et al [6]. This shows that the bismuth ferrite nanoparticles present good UV- and visible-light responses. The maximum absorptions of the samples are in the ultraviolet region at approximately 200 nm, suggesting they absorb more strongly in the ultraviolet region than in the visible light region [38]. The maximum absorption peak of the bismuth ferrite nanoparticles at 221 nm increases and shifts toward a lower wavelength (blue shift) at 218 nm after SiO2 encapsulation. The shift of the absorption band edge of the sample indicates a change in the electronic transition and bandgap [39]. The calculation of the bandgap energies of the samples is shown in figure 7. The bandgap energy of a sample is obtained by applying the following Tauc plot equation to the UV–Vis absorption spectra:

where 
 C, and
  are the absorption coefficient, Planck's constant, light frequency, independent coefficient, and bandgap energy, respectively. n = ½ and 2 are for materials with direct and indirect bandgap, respectively. Bismuth ferrite is a direct-bandgap semiconductor; thus, n = ½ [40]. The bandgap energy of Bi25FeO40 was determined as 2.1 eV, which increased to 2.7 eV after SiO2 encapsulation. This increase in the bandgap energy after SiO2 encapsulation is possibly due to the insulating nature of SiO2. SiO2 has a bandgap energy of 7.62–9.70 eV and 7.6–8.75 eV from theoretical and experimental data, respectively [41]. An increase in the bandgap energy of bismuth ferrite nanoparticles after SiO2 encapsulation has been reported by Nayak et al [28]. This suggests that the SiO2 encapsulation affects the optical properties of the nanoparticles. The bandgap energy of the pure Bi25FeO40 nanoparticles in this study is close to that reported by Jebari et al [42] and smaller than those obtained by Xie et al and Köferstein et al [2, 43]. In contrast, it is larger than those reported by Ren et al and Tan et al [6, 44]. This variation in the bandgap energy is caused by several factors such as different techniques for determining the bandgap energy and differences in the syntheses and particle size [42].
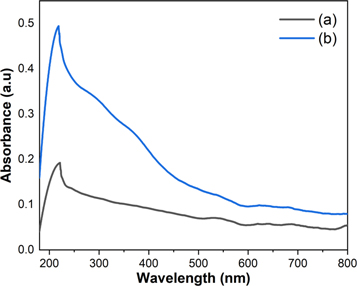
Figure 6. UV–Vis optical absorbance spectra of (a) bismuth ferrite and (b) bismuth ferrite/SiO2 20%.
Download figure:
Standard image High-resolution image
Figure 7. Plots of ( ) versus energy of (a) bismuth ferrite and (b) bismuth ferrite/SiO2 20%.
Download figure:
Standard image High-resolution image3.3. Magnetic analysis
To investigate the effect of SiO2 encapsulation on the magnetic performance of bismuth ferrite nanoparticles, M–H hysteresis loops were tested using a VSM and measured at room temperature, and the results are shown in figure 8. On applying a maximum external magnetic field of 15 kOe, saturation magnetization of the sample was not reached. The magnetization increased linearly with the applied magnetic field.
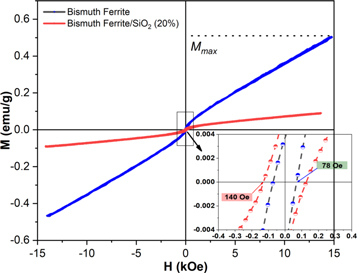
Figure 8. M–H hysteresis loops of bismuth ferrite and bismuth ferrite/SiO2 20%.
Download figure:
Standard image High-resolution imageTable 3 lists the measured magnetic parameters of the bismuth ferrite and bismuth ferrite/SiO2 samples. The coercivity (HC) increased with the addition of SiO2 in the bismuth ferrite sample. However, the maximum magnetization (Mmax) reduced after SiO2 encapsulation. These results confirm that all samples present a weak ferromagnetic ordering. Zhou et al showed that sillenite-type bismuth ferrite exhibits a weak ferromagnetic behavior. The HC obtained in their study was higher, whereas Mmax was lower than those of the nanoparticles in our study [10].
Table 3. Magnetic properties of bismuth ferrite and bismuth ferrite/SiO2 samples.
| Sample | Hc (Oe) | Mmax (emu g)−1 |
|---|---|---|
| Bismuth ferrite | 78 | 0.54 |
| Bismuth ferrite/SiO2 (20%) | 140 | 0.09 |
The increase in the coercivity of the magnetic nanoparticles after the nonmagnetic material encapsulation is due to the increase in the interparticle distance between the magnetic cores of the nanoparticles, which weakens the coupling of the magnetic dipole moments [45]. In addition, the increase in the coercivity is possibly caused by the presence of another phase of bismuth ferrite, i.e., Bi2Fe4O9 (from the XRD patterns) [46], which forms on the nanoparticles after SiO2 encapsulation. The reduction in the saturation magnetization of ferrite-based nanoparticles after SiO2 encapsulation was found in a study reported by Widakdo et al [31]. This reduction was reported to be due to the magnetic properties of SiO2 that encapsulated the nanoparticles. SiO2 is a nonmagnetic material; therefore, it can reduce the response of the nanoparticles it encapsulates to an external field.
3.4. SAR analysis
The calorimetric method can be used to measure the SAR value to determine the heating efficiency of magnetic nanoparticles. In the calorimetric method, the temperature rise of magnetic nanoparticles was recorded over a specific interval of time under an AMF with a specific strength and frequency [47], and the results are shown in figures 9(a)–(c). The SAR values of all samples are evaluated from the linear part of the slope using the following equation [24] :

where C,  and
and  are the heat capacity of the nanoparticle dispersion, mass of the magnetic nanoparticles, and initial slope of the temperature rise versus time plot, respectively. The temperature rise of all magnetic nanoparticles recorded over 10 min was very small. In hyperthermia applications, the temperature is controlled in the secure range of 42 °C–47 °C. This secure temperature range can damage cancer cells while protecting healthy cells [48]. The low temperature rise of the magnetic nanoparticles led to low SAR values. The SAR values of the bismuth ferrite nanoparticles were 49, 61, and 84 mW g−1 under AMF strengths of 150, 200, and 250 Oe, respectively, which correspondingly reduced to 35, 44, and 65 mW g−1 after SiO2 encapsulation.
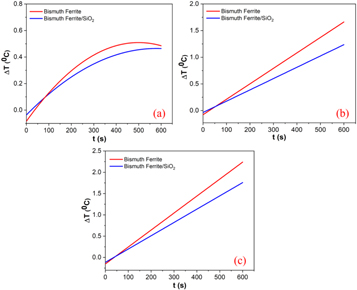
Figure 9. Temperature rise as function of time for samples with the frequency of 50 Hz and under different AMF strengths of (a) 150, (b) 200, and (c) 250 Oe.
Download figure:
Standard image High-resolution imageMagnetic nanoparticles should possess a high SAR as heating mediators in hyperthermia therapy. However, the SAR values of the magnetic nanoparticles obtained in this study were very small owing to the low AMF frequency [49], i.e., 50 Hz. The heat production mechanism occurred slowly because of the low frequency. Therefore, the amount of energy dissipation was small, resulting in small SAR values. A high frequency is required for hyperthermia applications to acquire a secure temperature range and a high SAR value. Figure 10 shows the temperature rise within 10 min with the higher AMF frequency. A higher frequency of 20 kHz can produce more heat and increases the SAR value to 123 mW g−1. Therefore, the increase in frequency increases the SAR values of the magnetic nanoparticles, which is in good agreement with the results reported by Narayanaswamy et al [50]. These high SAR values can provide efficient heat generation to destroy cancer cells. Besides the frequency, the external factor that can affect the change in the SAR values of magnetic nanoparticles is the strength of the AMF.
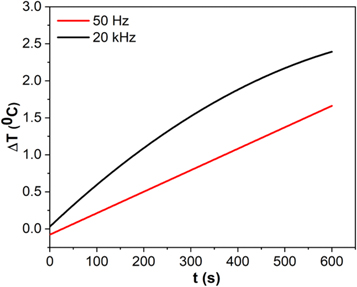
Figure 10. Temperature rise as function of time for the bismuth ferrite under AMF strengths of 200 Oe and with different frequencies.
Download figure:
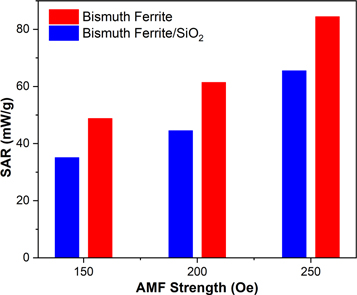
Standard image High-resolution imageTo investigate the effect of the AMF strength on the SAR values of the magnetic nanoparticles in this study, the former was varied as 150, 200, and 250 Oe while keeping the frequency constant. Figure 11 shows the SAR values of the nanoparticles under the influence of various AMF strengths. The SAR values of the nanoparticles increase with increasing AMF strength. The applied AMF strength increases the temperature of the system. Therefore, increasing the AMF strength can generate higher heat energy and higher SAR values of the nanoparticles. Atkinson et al suggested that the frequency and strength of the AMF in a clinical trial cannot exceed a certain limit (H.f < 4.85 × 10⁻⁸ A ms)−1 for safety reasons [51]. The effects of AMF frequency and strength on the SAR values of nanoparticles in hyperthermia applications have been reported in many studies.
Figure 11. SAR values of magnetic nanoparticles under various AMF strengths.
Download figure:
Standard image High-resolution image
In addition, this study showed the influence of saturation magnetization on the SAR value of the nanoparticles. The SAR values of the magnetic nanoparticles increased with increasing saturation magnetization. The effects of saturation magnetization and AMF strength on SAR values was also reported by Kerroum et al [52]. In hyperthermia applications, the magnetic properties of magnetic nanoparticles are critical factors for increasing the SAR value. Therefore, improving the magnetic properties, particularly of bismuth ferrite nanoparticles, is necessary to obtain optimal results for their applications as heating mediators.
4. Conclusion
We successfully fabricated a sillenite-type bismuth ferrite nanoparticles (Bi25FeO40). The nanoparticles were synthesized by the coprecipitation method and encapsulated in SiO2 (20 and 25%). SiO2 encapsulation affected the microstructures and magnetic and optical properties of the nanoparticles. The average crystallite size increased after SiO2 encapsulation, as confirmed by XRD analysis. The presence of the Si–O–Si stretching vibration in the FTIR spectrum of the bismuth ferrite nanoparticles after SiO2 encapsulation confirmed that SiO2 encapsulated the nanoparticle surface. The investigation of the optical properties showed that SiO2 affected the bandgap energy of the bismuth ferrite nanoparticles, causing it to increase. The coercivity increased and the maximum magnetization decreased after SiO2 encapsulation. In addition, we measured the SAR value of the nanoparticles, and found it decreased after SiO2 encapsulation and increased with increasing AMF strength. This study confirmed the effects of the magnetization, frequency, and the AMF strength on the SAR value of the nanoparticles.
Acknowledgments
The authors would like to thank Prof. Takeshi Kato (Institute of Materials and Systems for Sustainability, Nagoya University, Nagoya, Japan) and Dr Daiki Oshima (Department of Electronics, Nagoya University, Nagoya, Japan) for their advice, facility access in their laboratory for using vibrating sample magnetometer (VSM, Riken Denshi Co., Ltd.).
Data availability statement
All data that support the findings of this study are included within the article (and any supplementary files).
Fundings
This work was supported by the Indonesia Endowment Fund for Education (LPDP), Ministry of Finance, Republic of Indonesia; the grant of University Basic Research (PDUPT), the Ministry of Education, Culture, Research & Technology, Republic of Indonesia, No. 1820/UN1/DITLIT/Dit-Lit/PT.01.03/2022; and the Nanofabrication Platform Consortium Project of Nagoya University, Ministry of Culture, Sports, Science, and Technology (MEXT) Nano-Project Platform (Japan).
Conflicts of interest
The authors declare no conflict of interest.