

Abstract
Optical homodyne detection has found use as a characterisation tool in a range of quantum technologies. So far implementations have been limited to bulk optics. Here we present the optical integration of a homodyne detector onto a silicon photonics chip. The resulting device operates at high speed, up 150 MHz, it is compact and it operates with low noise, quantified with 11 dB clearance between shot noise and electronic noise. We perform on-chip quantum tomography of coherent states with the detector and show that it meets the requirements for characterising more general quantum states of light. We also show that the detector is able to produce quantum random numbers at a rate of 1.2 Gbps, by measuring the vacuum state of the electromagnetic field and applying off-line post processing. The produced random numbers pass all the statistical tests provided by the NIST test suite.
Export citation and abstract BibTeX RIS

Original content from this work may be used under the terms of the Creative Commons Attribution 3.0 licence. Any further distribution of this work must maintain attribution to the author(s) and the title of the work, journal citation and DOI.
Introduction
Homodyne detectors are ubiquitous across quantum optics. They are used to measure quantum states [1–5] and characterise quantum processes [6, 7]. They find applications in continuous variables (CV) quantum computation, quantum key distribution (QKD) [8] and sub-shot-noise quantum interferometry [9]. But the interferometric stability required for both the creation of non-classical states of light and for the subsequent homodyne detection is limiting even in small-scale experiments, requiring active stabilisation to compensate. To address this, we present a homodyne detector with the photonic components integrated onto a silicon chip. We report performance suitable for characterising optical quantum states guided in silicon-on-insulator (SOI) waveguide.
Integrated quantum photonics [10] is an approach aimed at miniaturising and integrating quantum optical components into monolithic structures in an effort to increase the scale with which phase stable quantum optics can be implemented. This includes reconfigurable nested waveguide interferometry, on-chip optical nonlinearity and on-chip detectors [11]. Most recently, cryogenically cooled superconducting nanowire single photon detectors have been integrated with electrically driven sources of single photons [12]. But to date, more general quantum states of light that are generated [13, 14] or manipulated [15] on-chip are still characterised off-chip, after undergoing a significant amount of coupling loss. By monolithic CMOS-compatible fabrication of homodyne detectors in silicon photonics, we aim to open up the prospect of measuring and fully characterising the quantum optics being explored and developed on-chip [11].
The optical components required for one homodyne detector are a phase shifter, a balanced two-mode optical beamsplitter and two photodiodes. In the SOI architecture, each of these components operate at room temperature and the required integrated photonics are commercially available from foundries. Integrated balanced detectors made of the same components have application in classical photonics [16, 17]. However, the full potential of the homodyne detector lies with its ability to detect extremely weak fields—even down to the single photon level—by measuring the field's interference with a bright laser, that acts as a local oscillator (LO), at an optical beamsplitter. Ideally, measurement of the difference in the photocurrents in the two photodiodes is proportional to the quantum quadrature operator

where ϕ is the optical phase difference between the LO and the signal field and the operators  and
and  are the lowering and raising operators of the electromagnetic field. From measurements of
  for different LO phases, it is possible to reconstruct the quantum state of the signal field in the optical mode that is given by the LO. This process of measurement and reconstruction is called optical homodyne tomography and has been studied in great detail [18].
The photonics for the reported device (figure 1(b)) were fabricated on a SOI chip as part of a multi-project wafer run organised by IMEC foundry services, using the iSiPP25G IMEC technology. For more details, see [19]. The beam-splitting operation is performed by a multi-mode interference device (MMI) with two  strip single-mode input waveguides and two identical single-mode output waveguides. The LO is generated externally by a CW laser source at a wavelength of 1550 nm and coupled into one of the input waveguides of the MMI by means of a grating coupler. When attenuated, this laser also serves as the source of the coherent state measured with the detector. Each of the output waveguides is coupled to an on-chip germanium p–i–n photodiode. The electronic signals generated by the photodiodes are then processed on a printed circuit board (PCB) by amplifying the difference of the two photocurrents. The design of this circuit is based on the one developed in [20], and details are included in the supplementary information is available online at stacks.iop.org/QST/3/025003/mmedia. The reported device does not include an on-chip phase shifter, however the addition of a thermal phase shifter is straightforward to implement in SOI photonics and is now routinely used to manipulate quantum states of light on chip [11]. We do not anticipate any of the characterised properties of the detector to be affected by the inclusion of a thermal phase shifter. The entire system, inclusive of the silicon chip and the PCB, is a few centimetres square and the total footprint of photonics is <1 mm2.
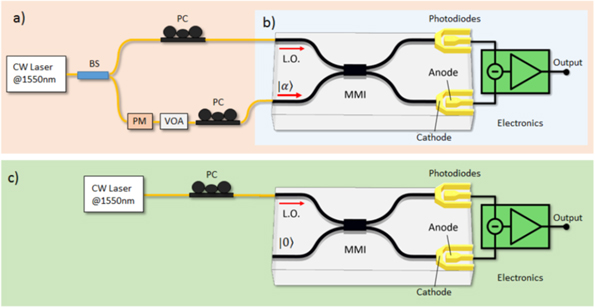
Figure 1. Schematic of the setup. (a) Setup for optical input characterisation. The laser source is a CW laser working at 1550 nm. BS refers to a 99/1 beam splitter which sends 99% of the light on the LO channel and the remaining fraction into the signal channel. Both channels have a polarisation controller (PC) to optimise the power coupled into the integrated waveguides. On the signal channel there is also an off-chip phase modulator (PM) and a variable optical attenuator (VOA). These are used when performing the tomography of coherent states, in order to tune the amplitude and phase of the coherent states. During the characterisation of the detector and for generating quantum random numbers the bottom channel was disconnected, so no light was coupled inside the chip through the bottom port. The LO and the optical signal field are coupled into the waveguides. (b) The silicon photonics homodyne detector. The beam-splitting operation of the integrated homodyne detector is performed by a multi-mode interferometer (MMI). The two outputs of the MMI are coupled into two on-chip Ge photodiodes, generating two currents that are subtracted from each other and amplified by an off-chip transimpedance amplifier (TIA). (c) Scheme used to generate the random numbers by measuring optical vacuum states. In this case the bottom port of the homodyne detector is blocked and no optical beam is present at this port. The LO is injected from the top port and, as before, a polarisation controller is used to maximise the optical power of the LO at the photodiodes.
Download figure:
Standard image High-resolution imageResults
Homodyne detector characterisation
A non-ideal homodyne detector is subject to a number of sources of noise. Photodiodes exhibiting dark current or a non-optimal quantum efficency, as well as electronic noise in the amplification circuit all contribute to measurement noise, which limits the detection efficiency. These manifestations of noise can all be modelled as optical loss in the channel of the signal field [21] and quantified by means of individual efficiencies. The global detection efficiency is given by the product of all of these inidividual contributions, including loss in the signal waveguide and in the beam-splitter.
In our device, we identified three sources of inefficiency: the electronic noise generated by the detection circuit, the optical loss in the MMI and the inefficiency of the photodiodes. The quantum efficiencies of the photodiodes were characterised by means of two effective responsivities taking into account loss in the splitter, we obtained a value of (0.78 ± 0.06) A W−1 for one photodiode and (0.80 ± 0.07) A W−1 for the other, corresponding to an estimated quantum efficiency of  . Additional information on how these values have been measured are reported in the supplementary information.
The electronic noise is a gaussian-distributed random quantity which can be measured directly in the absence of a LO. With an optical signal present, the electronic output will be gaussian-distributed, with a variance given by the sum of the variances of electrical signal and noise. So the variance of the noise-free signal can be estimated from

where  is the standard deviation of the raw output of the detector,
  is the standard deviation of the shot-noise contribution—the fundamental quantum noise of the light field—and
  is the standard deviation of the electronic technical noise contribution.
Figure 2(a) shows a plot of the variance of the signal measured by our detector for different powers of the LO. The line of best fit through the noise-subtracted variances on a bi-logarithmic scale is a line of slope 1.00 ± 0.02. This confirms the linear dependence on LO power, which agrees with the expected manifestation of quantum vacuum fluctuations as gaussian-distributed white noise.
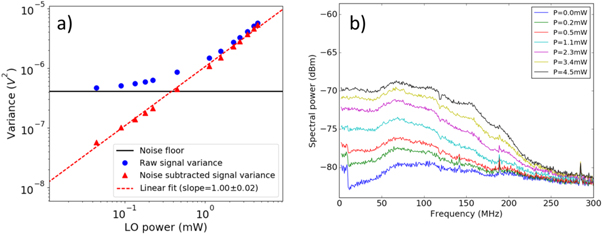
Figure 2. Performance of the on-chip homodyne detector. (a) Signal variance for different LO powers, obtained with a CW laser at 1550 nm (Tunics T100S-HP). The blue dots represent the raw signal variances, the red triangles correspond to the noise-subtracted variances and the black line marks the variance of the electronic noise. The red dashed line is a linear fit of the noise-subtracted variances with slope is 1.00 ± 0.02. The graph shows a SNC of 11 dB for a LO power of  mW over a bandwidth of ∼150 MHz. These values have been measured using a CW LO at a wavelength of 1550 nm. (b) Spectral response of the integrated homodyne detector for different LO powers, measured with a CW at 1550 nm (Tunics T100S-HP).
Download figure:
Standard image High-resolution imageThe ratio between the variance of the raw output of the detector measured at the highest LO power used (4.5 ± 0.4 mW) and zero LO power is ∼11 dB. This quantity is named shot noise clearance (SNC) and is related to the efficiency of the homodyne detector by [20]
which, combined with the photodiodes contribution, leads to a total detector efficiency of
This value is already sufficient to characterise the quantum features of optical states [22, 23].
The bandwidth of a homodyne detector defines the speed at which it can be maximally operated and the maximum spectral width that the signal field can have in order to be measured efficiently. The measured spectral response of our detector is shown in figure 2(b) and the 3 dB bandwidth is ∼150 MHz. The most significant limiting factors for this value are the parasitic capacitance of the PCB and the internal capacitances of the electronic components involved, mainly the operational amplifier (OPA847) [24]. See supplementary data for a more detailed analysis. Enhancements in the bandwidth could be achieved by taking advantage of different amplification schemes, such as the one proposed in [25] which allows to reach 300 MHz of bandwidth, with a similar SNC to the one demonstrated here.
Homodyne tomography of coherent states
Coherent states (displaced and Gaussian states in general) are amongst the main resources for CV quantum computing and CV quantum communications. For example, in CV QKD a sender shares a secret key with a receiver by encoding two randomly selected real variables x and y in a displaced coherent state described in the phase space by  . These states are sent to the receiver who performs homodyne measurements on the quadratures in order to extract the secret key. Therefore homodyne detectors capable of characterising displaced gaussian states are one of the main tools when performing CV based QKD.
The detector's capability in performing homodyne tomography was demonstrated using the full arrangement displayed in figure 1(a). A 1550 nm continuous wave laser with 2.5 μs coherence time (Tunics T100S-HP) was split at a fibre beam-splitter with 1% reflectivity. The reflected beam was further attenuated by a variable optical attenuator, phase-modulated by means of a fibre phase shifter and then injected into the chip. The transmitted beam was used as a LO. Quadrature measurements in a phase interval of length π were acquired by driving the phase shifter with a triangle wave sweeping the interval at a frequency of 200 kHz. The entire set of data was acquired within a time interval of 40 μs, significantly shorter than the time scale of phase instabilities of the optics external to the SOI chip (∼150 μs). Quadratures were sampled at 145 MHz, meaning that the state we measured is the projection of the original state on a 7 ns long temporal mode.
The Wigner function of the state was then reconstructed using an iterative maximum-likelihood reconstruction algorithm taking into account the reduced efficiency of the detector and the uncertainty on the coupling losses [26]. The characterisation was performed for three different amplitude values of the coherent state, α: 0.45, 1.04, 1.40. The Wigner functions for these states are reported in figure 4. The quantum state fidelities obtained in the three cases were respectively  ,
,  and
and  . The errors on the fidelities take into account the uncertainty on the measured efficiency of the detector and the uncertainty on the coupling losses experienced by the measured coherent states.
Generation and certification of random bits
Random numbers are a key resource for quantum cryptography, as well as classical cryptography and having application in more general computational simulation and fundamental science. However true randomness cannot be generated with a classical computer—currently used pseudo-random numbers generated with software can in-principle be predicted. In contrast, quantum random number generators (QRNGs) rely on the outcomes of inherently non-deterministic quantum processes to generate random numbers that cannot be predicted [27–31]. Examples of compact QRNGs have been recently demonstrated [32, 33]. To the best of our knowledge, our report is of the first experimental demonstration in the SOI platform. The quadrature measurements  for the vacuum states are non-deterministic and follow a Gaussian probability distribution,

as shown in figure 3. They were obtained by injecting the LO beam into the top waveguide, while blocking the bottom waveguide (figure 1(c)). To extract the random bits, the voltage output of the homodyne detector was read by an oscilloscope, in windows of 105 samples. The range of measurements of the vacuum states were divided into 28 equally spaced bins, and each bin was labelled with an 8 bit string, similarly to figure 3. Thus each measurement outcome corresponded to the generation of an 8 bit number. To be compatible with randomness extraction hardware we used equally spaced bins, but this means the bits strings associated with the central bins were more likely to appear, skewing the randomness of the random bits. Moreover, correlations in the electronic background noise could be used by an adversary. For this reason a further step of randomness extraction from the raw data was required. We implemented the Toeplitz hashing algorithm [34] as a randomness extractor with a desktop computer (details in Methods section). The output of the Toeplitz algorithm was a sample of bits characterised by a uniform distribution, where the residual correlations between the raw random data have been removed. To determine at which speed to operate our QRNG, we measured the autocorrelations of the bit-strings at different sampling rates. In figure 5(a) we plotted the autocorrelation for the raw data. While increasing the sampling rate up to 1 Gbit s−1 clearly introduces correlations, sampling at 200 Msamples s−1 does not show higher correlation than, for example, the 125 Msamples s−1 sampling rate. This is because the quantum noise is well above the electronic noise level up to 200 MHz, as can be observed in figure 2(b). Thus, a sampling rate of 200 Msamples s−1 was chosen. It can be also observed that the hashed data do not present any significant correlation, as shown in figure 5(b).
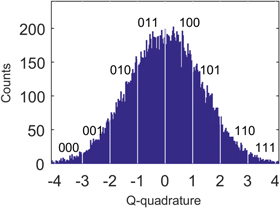
Figure 3. Measured histogram of the shot-noise signal. The quadratures have a Gaussian distribution. The corresponding shot-noise histogram is divided into  bins and each bin is labelled with a n-bit string which is used to label each sample from the oscilloscope. Since the outcomes are unpredictable, a bit string composed of all the samples will be random. We illustrate with n = 3 bits as an example.
Download figure:
Standard image High-resolution image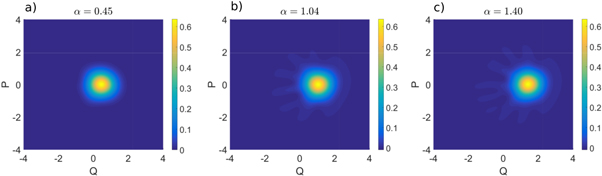
Figure 4. Experimental Wigner function for coherent states with amplitude values (a)  , (b)
, (b)  and (c)
  . We chose to set the phase such that Im
  . The respective fidelities with the ideal state are respectively
  ,
,  and
and  .
.
Download figure:
Standard image High-resolution image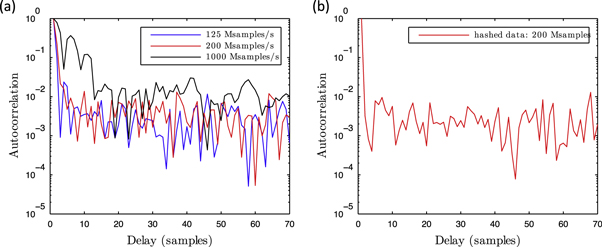
Figure 5. Autocorrelations: (a) The autocorrelation of the raw bits string of random data at different sampling rates. The autocorrelations at the sampling rates of 1 Gsamples s−1, 200 Msamples s−1 and 125 Msamples s−1 are shown respectively as black, red and blue solid lines. The autocorrelation has a larger magnitude for a sampling well above the detector bandwidth, but decreases when the sampling is 200 Msamples s−1 or below. (b) The autocorrelation of the bits string after the Toeplitz Hashing at 200 Msamples s−1. 8 × 10⁴ 8 bit samples were used to calculate these autocorrelations.
Download figure:
Standard image High-resolution imageMoreover, we estimated the amount of certified randomness of the generated bits by calculating the min-entropy [34], obtaining  (see Methods). Finally the calculated generation rate was 1.2 Gbps, obtained as the product between the calculated min-entropy of 5.9 bits/sample and the sampling rate of 200 Msamples s−1. Here we notice that since we acquired the data with an oscilloscope and used a software based Toeplitz algorithm, the randomness extraction was performed off-line. However, this estimation gives information about the capabilities of the detector itself and the obtained generation rate is the direct result of the combination of SNC and bandwidth of our homodyne detector. Hardware based randomness extractors could be used to improve the generation rate [29]. We then tested the generated random bits with the NIST SP 800-22 statistical tests provided in [35]. Our QRNG passed all the tests provided. In table 1 we report the results for the NIST SP 800-22 statistical tests. Figure 6 shows the results for the uniformiity tests on the P-values (see Methods for more details).
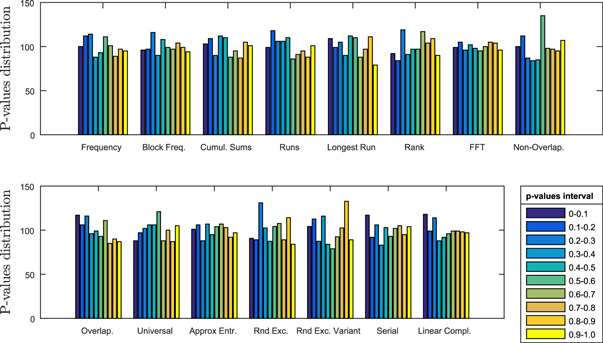
Figure 6. Uniformity test for the P-values. Under the assumption that the produced random bits are truly random, the P-values must be uniformily distributed between 0 and 1. Here the NIST statistical test provides the frequencies of the P-values, by dividing the (0, 1) interval into 10 sub-intervals. We can observe that for each test the P-values are uniformly distributed.
Download figure:
Standard image High-resolution image
Table 1. Statistical tests on the random data. Here the results for the NIST (National Institute of Standards & Technology) statistical tests suite [35]. In order to pass the NIST SP800-22 the pass rate must be above 0.98 for each type of test (column II) and the reported P-values, which refer to the uniformity test on the distributions plotted in figure 6, must be above 0.01 (column III).
| NIST SP800-22 | ||
|---|---|---|
| Test name | Pass rate | P-value |
| Frequency | 0.996 | 0.524 |
| Block frequency | 0.998 | 0.827 |
| Cumulative sums | 0.994 | 0.536 |
| Runs | 0.990 | 0.397 |
| Longest run | 0.990 | 0.233 |
| Rank | 0.990 | 0.178 |
| FFT | 0.987 | 0.998 |
| Non-overlapping template | 0.990 | 0.012 |
| Overlapping template | 0.991 | 0.180 |
| Universal | 0.992 | 0.344 |
| Approximate entropy | 0.987 | 0.910 |
| Random excursions | 0.993 | 0.214 |
| Random excursions variant | 0.995 | 0.082 |
| Serial | 0.989 | 0.528 |
| Linear complexity | 0.989 | 0.574 |
Methods
Characterisation of loss in the LO channel
The design implemented on the optical chip does not allow a direct measurement of the insertion loss in the grating coupler used to inject the LO. For this reason two other grating couplers have been placed in line with the LO input, making it possible to couple light in and out of all of the couplers simultaneously by means of a single fibre array. The two test grating couplers are connected by a single-mode waveguide that is two times as long as the one connecting the grating coupler to the MMI in the LO channel, meaning that the loss measured in this test structure provides us with a doubled estimation of the loss experienced by the LO before reaching the homodyne detector. The error on this estimation has been obtained by measuring insertion loss in a further 20 equivalent test structures and calculating its standard deviation. The obtained value of the transmissivity, including its error is 0.31 ± 0.03.
Reconstruction of coherent states Wigner function
For reconstructing the density matrix and the Wigner function we employed the maximum likelihood algorithm. The quantum fidelity between the experimental data and the ideal density matrix was calculated by setting  , where
  takes into account the uncertainty on the coupling losses and the efficiency of the detector. The fidelity was taken as the mean of the fidelities of 100 different sets of simulated data. The standard deviation was obtained as the standard deviation of these fidelities. The calculated fidelities are respectively
  ,
,  and
and  .
.
Randomness extraction
The Toeplitz hashing algorithm takes a k-bit string of raw bits obtained by binning the random data from the oscilloscope and multiplying it by a k × j Toeplitz matrix, giving as a result an unbiased j-bit random string [34]. Here j is given by the length of the input sequence of bits times the ratio between the  and number of bits used (8 bits in our case). Hence, in order to extract pure random bits, for each sequence we estimated the min-entropy which describes the amount of extractable randomness from the quantum signal distribution. It is defined as

where X corresponds to the quantum signal shot-noise distribution over  bins, and
 ![${\rm{\Pr }}[X=x]$](https://content.cld.iop.org/journals/2058-9565/3/2/025003/revision2/qstaaa38fieqn31.gif) is the probability to obtain a particular value for X. In homodyne detection however, we do not have direct information about the quantum signal distribution because it is always mixed with some classical noise. We thus estimated the true quantum variance under the assumption of a Gaussian distribution, using equation (2). For each sequence we calculated min-entropy of
is the probability to obtain a particular value for X. In homodyne detection however, we do not have direct information about the quantum signal distribution because it is always mixed with some classical noise. We thus estimated the true quantum variance under the assumption of a Gaussian distribution, using equation (2). For each sequence we calculated min-entropy of  and then built a Toeplitz matrix, using a pseudo-random seed of k + j-1 bits as in [34]. An alternative approach could be to substitute part of this pseudo-random seed with a certified random string, obtained by previous experiments. Finally the raw sequence of bits was multiplied by the Toeplitz matrix to obtain the unbiased random sequence.
NIST statistical test
We applied the NIST SP 800-22 test to a sequence of 109 random bits. This provides 15 different tests. For each test the total string of random bits was divided into 1000 blocks. All the tests were applied to each block (with the exceptions of the random excursion and random excursion variant tests, which use approximately 600 blocks), and a P-value was extracted for each single test. These P-values describe the probability to obtain a more biased string of bits than the one obtained, under the assumption that the bits are the outcomes of a perfect QRNG. In order to assess the randomness of the data, there are two requirements specified by NIST SP 800-22 test. First, the proportion of single tests with a P-value greater than 0.01, reported in the second column of table 1, must be above 0.98. Second, by definition of P-value, the P-values obtained from all the single tests must be uniformly distributed. Thus, a second set of P-values was calculated to assess the uniformity of the distributions original P-values. These final P-values, one for each of the 15 tests, must be above 0.01 to confirm the randomness of the data. In figure 6 we plotted the P-values distributions for the different tests. As can be observed, the P-values are uniformly distributed, indicating the randomness of the experimental data. In the third column of table 1 the P-values for the uniformity tests are reported.
Discussion
The reported integrated homodyne detector is fast, low noise and compact. In this work we have shown that our detector is capable of characterising optical coherent states and generating certified quantum random numbers at 1.2 Gbps. With these results we demonstrated that our homodyne detector could find use in integrated quantum cryptography devices [36, 37]. Moreover the performances of our detector show that it can be used to characterise the quantum features of non-classical states, such as Fock states, optical Schrödinger cats and squeezed states, which are essential for CV quantum computation. Furthermore, the compact design is compatible with complex and reconfigurable interferometry [15] and the lithographic manufacture is amenable to high-yield fabrication, enabling many-mode quantum characterisation using multiple homodyne detectors implemented on one chip. We therefore foresee applications of our integrated homodyne detector in a broad range of continuous and discrete variables quantum information experiments.
Acknowledgments
We thank Magnus Loutit for technical assistance. This work was supported by ERC, PICQUE, BBOI, QUCHIP, the US Army Research Office (ARO) Grant No. W911NF-14-1-0133, the EPSRC Quantum Communications Hub (EP/M013472/1) and the EPSRC programme grant (EP/L024020/1). MGT (EP/K033085/1) and JCFM (EP/M024385/1) acknowledge fellowship support from the EPSRC. Underlying data are openly available at [38].
Author contributions
FR and GF contributed equally to this work. All authors contributed to the research, experiment and writing of this paper.