
Abstract
This article reports the development of a novel embedded acoustic waveguide sensor concept for monitoring the curing process and online health of composite structures. A sleeved waveguide embedded in the composite is proposed to confine guided waves in one dimension, with leakage to the surrounding media only through specially created openings, thus enhancing the capability to inspect large structures. The method is first developed using a rectangular copper strip embedded in an epoxy plate structure having an artificial delamination-type defect. Finite element simulations are used to gain insights on parameters and limitations. The approach is also demonstrated on a more practical bi-layer composite plate with an artificial delamination and an embedded wire waveguide sensor.
Export citation and abstract BibTeX RIS

Original content from this work may be used under the terms of the Creative Commons Attribution 3.0 licence. Any further distribution of this work must maintain attribution to the author(s) and the title of the work, journal citation and DOI.
1. Introduction
Laminated composites consist of at least two layers that are bonded together. Lamination is used to combine the best aspects of the constituent layers and bonding material to achieve a more useful or functional material [1]. Defects arise in composites during the service life or during the manufacturing process due to incorrect or non-optimal cure parameters such as duration, temperature, pressure or vacuum bleeding of resin [2]. Thus there is much interest in monitoring the curing process and also the in-service condition of laminated composites. In this context, guided ultrasonic waves such as Lamb waves in plate-like structures that can cover long distances from a single transducer position (especially in uncoated structures) are of particular interest [3]. Non-destructive technologies using Lamb waves are widely used to inspect composite structures [4]. The effectiveness of ultrasonic guided waves in quantitative defect detection in composites is well documented [5, 6].
Typically, guided wave based structural health monitoring approaches for composites use surface bonded piezoelectric or magnetostrictive transducers [7–16]. Surface-bonded transducers generate cylindrical (two-dimensional) waves, which decay away from the source, limiting the field of view, especially in inaccessible/hidden regions of complex structures. An example of such a method is the Single Transmitter Multiple Receiver array approach [8] illustrated in figure 1.
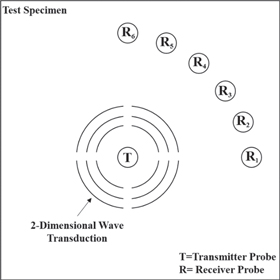
Figure 1. An illustrative diagram showing the top view of the arrangement of transducers in a surface-bonded single transmitter multiple receiver (STMR) array [8].
Download figure:
Standard image High-resolution imageHere we seek to develop a novel embedded waveguide sensor concept for detecting and monitoring the condition of composites, during curing and service. Guided wave based NDE and SHM approaches have been proposed for composites, but these are typically based on surface-bonded transducers (see [7–16] referred above). Embedded fiber-based optical waveguide approaches have also been reported [17, 18]. Waveguide approaches have been considered in literature for monitoring the setting and defect growth processes in concrete [19, 20], but our article demonstrates an extension of and improvements to this approach as applied to composites. A key innovation in this process is the use of a sleeved waveguide which serves to confine the guided waves to a single (axial) dimension. At specific opening or 'sensing' positions, waves can leak out and become two-dimensional. These leaky waves are sensitive to delamination/defects inside the structure.
Through the example case of a delamination-type defect embedded in a simple epoxy substrate, we first show that the proposed technique is promising for the health monitoring of composites. Later, an application of the proposed technique to a practical glass fiber reinforced plastic (GFRP) composite plate consisting of two laminates with an artificial delamination is also discussed. This paper primarily focuses on reporting studies intended as proof of concept. However, ultimately the waveguides used for internal sensing can be very thin, and even be integrated with reinforcing fibers of the composite (similar to studies reported on embedding Optical fiber sensors, see [17, 18]), thus minimizing possible impact on structural integrity.
This paper is organized as follows: we first introduce the concept of a sleeved waveguide sensor, followed by a description of the procedure for experiments and finite element (FE) simulations that are used to obtain insight. Results on monitoring the curing process and for detecting delamination defects are first presented using a simple epoxy plate with an artificial delamination. Studies on optimal parameters for defect detection using this approach are then discussed, followed by demonstration of the approach in a more practical GFRP composite plate. The paper concludes with a consideration of limitations of the approach and directions for further work.
2. Approach
2.1. Concept
The proposed concept of embedded sleeved waveguide sensors is illustrated in figure 2 below, for the example case of a delamination in an epoxy substrate chosen for the bulk of studies in this paper. The sleeve serves to confine ultrasonic guided waves in one dimension and leaks them from selectively chosen openings, where they effectively become two-dimensional (cylindrical waves). In contrast to the transducer being the only source of wave generation, these openings act as multiple transducers, enhancing the capability for defect detection. Bulk of the studies reported here make use of a rectangular strip type waveguide for the embedded sensor. The proposed technique is independent of the type of waveguide chosen, as discussed later (see section 6.5).

Figure 2. Illustration of the proposed sleeved waveguide sensor concept through the example of an epoxy substrate with a delamination (cross-section shown).
Download figure:
Standard image High-resolution imageThe sleeve and selective openings provide a novel sensing tool whereby the waveguide is in direct contact with the surrounding media at targeted locations. Signals arising due to the mismatch of acoustical impedance at the openings provide a reference for localizing signatures of defects in the region surrounding them, which re-enter the waveguide at the same location. For example, in the case of the substrate shown in figure 2, a portion of wave energy leaking out at the sleeve opening reflects back from the delamination. Since it is embedded at the time of manufacturing, such a sensor can continuously capture information on the condition of the structure during operation.
2.2. Waveguide and mode selection
In the rectangular strip waveguide chosen here, Lamb-type plate guided waves are expected to occur close to the strip-center (see for example [21]). At lower frequencies, and particularly in our 2D FE simulations, we have taken the strip to be well-represented by a plate waveguide under plane strain as a reasonable approximation. Dispersion curves for a copper plate waveguide of 1 mm thickness obtained using DISPERSE [22] are shown in figure 3.

Figure 3. Lamb wave dispersion curves for copper plate waveguide obtained using DISPERSE [22].
Download figure:
Standard image High-resolution imageA low-frequency excitation of 100 kHz is considered, to minimize the number of modes and wave attenuation in the received signal. At such low frequencies, only the fundamental symmetric, S0, and anti-symmetric, A0, modes exist. The S0 mode is chosen for the first set of studies due to its in-plane particle displacements and non-dispersive nature in the low-frequency thickness regime.
2.3. Waveguide placement and coating details
The waveguide should be designed to withstand high pressure at the time of manufacturing of composite plates. Owing to its high density and capability to transmit sound waves, copper has been chosen to meet the requirements for this design. In this proposed design the waveguide is embedded inside the epoxy region. The embedded waveguide protrudes out from the structure at one end, to allow for external transduction.
To ensure one-dimensional wave propagation throughout the structure, the waveguide is provided with a sleeve coating made of heat shrink polyolefin [23]. The sleeve shrinks on heating, gripping the waveguide and rendering no space for airgaps. Since the sleeve is not directly in touch with the waveguide, waves do not leak through, except at specific opening positions.
2.4. Sensing mechanism
An opening (of length in the order of wavelengths of the mode transmitted) is created at a target location by removing the sleeves. At this junction, the waveguide is in direct contact with the epoxy. Due to high impedance mismatch between copper and epoxy at the opening [Z1 (copper) » Z2 (epoxy)] a part of energy reflects back from the junction, and the remaining energy gets transmitted to the epoxy region and towards the right end of the waveguide. As a result, the given sleeve opening provides a reference signal. When waves encounter a delamination, they get reflected back to the waveguide and travel back to the transducer. In the case of no delamination/crack, only one reflection is seen, whereas in the case of delamination two reflections are visible, with the second echo emanating from the delamination/crack.
3. Experimental demonstration
The test specimen was a 400 mm × 400 mm × 6 mm plate structure made of epoxy resin with an embedded strip waveguide sensor with a cross-section of 20 mm × 1 mm. S0-type ultrasonic guided waves in the strip waveguide sensor were generated and received through a commercial probe (Panametrics V150 0.1 MHz shear probe, Olympus Corp., MA, USA). The probe was connected to a RITEC RPR-4000 pulser-receiver (Ritec Inc., Warwick, RI) which was used to generate a 3-cycle Hanning windowed toneburst at the required frequency. Signals scattered back through the waveguide were recorded using the InfiniiVision-3000 oscilloscope (Agilent Technologies, Inc., CO, USA) operating at 5 GS s−1. The comparison of transmitted and reflected energy was made possible by keeping the number of cycles (n), input voltage (V), receiver position (mm) and gain (dB) constant for all the experiments. Care was also taken to maintain consistent and similar coupling between the exciting probe and strip waveguide in all the experiments.
The epoxy plate was fabricated by the hand Lay-up [24] method with a strip waveguide embedded inside. An artificial delamination was created over the opening of the sleeve by inserting a Teflon tape. (The application of the proposed embedded waveguide method to a more 'advanced' specimen closer to practical composites, in the form of a bidirectional GFRP plate consisting of two laminates is discussed later: see section 6.5.) The curing process was monitored, and rheological changes were also observed. Figure 4 shows the schematic of the experimental setup and the epoxy plate with embedded waveguide sensor.

Figure 4. Schematic of experimental setup.
Download figure:
Standard image High-resolution image4. FE simulations
2D explicit FE simulations implemented in a commercial package [25] were performed to gain physical insight and to optimize various parameters. Figure 2 presented earlier showed a schematic diagram of copper waveguide—epoxy assembly. Different regions were labeled as follows: point of excitation, copper waveguide, sleeve opening, delamination and epoxy substrate. Material properties used for the FE models are shown in table 1 below. Confinement similar to the effect of a sleeve was achieved by imposing Dirichlet (rigid boundary) conditions at the top and bottom edges of the strip, with continuity conditions at the 'sleeve opening' connecting the 'strip' to the epoxy substrate. The average element size in epoxy region was λ/14, whereas in waveguide it was λ/200 (where λ = wavelength of the wave in the waveguide) [10, 11, 26]. In-plane excitation consisting of a Hanning-windowed toneburst centered at 100 kHz was provided at one end of the strip, generating S0-type guided waves. Waves scattered back were monitored at several locations in the strip, before and after the delamination position.
Table 1. Material properties used in FE package [25].
| Material | Density (ρ) kg m−3 | Poisson's ratio (μ) | Young's modulus (E) GPa |
|---|---|---|---|
| Copper | 8960 | 0.34 | 110 |
| Epoxy | 1200 | 0.29 | 7 |
Parametric studies using different lengths of sleeve openings and distance to the delamination were performed to understand the limits of the approach, as presented in the Discussion section.
Figure 5 presents a typical time snapshot obtained from FE simulations, showing wave propagation in the strip waveguide and scattering at the location of the delamination.
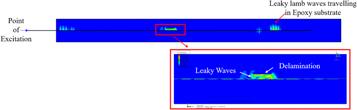
Figure 5. Typical snapshot contour of leaky waves, modeled in 2D finite element package.
Download figure:
Standard image High-resolution image5. Results
5.1. Cure monitoring
Cure monitoring of the epoxy plates was carried out for about 510 min at room temperature. Rheological changes were captured every minute. Figures 6 and 7 show sample plates without and with delamination, together with A-scan and B-scan [27] results obtained from measurements. The scans in figure 6 clearly show indications of the left and right end of the plate and the sleeve opening location, while an additional signature of the delamination appears in the scans shown in figure 7. From the received reflected signals, based on velocity calculations, we ascertained that there is no mode conversion.

Figure 6. (a) Sample plate without delamination. (b) A-scan showing time domain signal. (c) Corresponding B-scan showing curing time versus scanning time received from 1—left end of the plate, 2—sleeve opening, 3—right end of the waveguide. (Experimental results).
Download figure:
Standard image High-resolution image
Figure 7. (a) Sample plate with delamination. (b) A-scan showing time domain signal. (c) Corresponding B-scan showing curing time versus scanning time received from 1—left end of the plate, 2—sleeve opening, 3—delamination, 4—right end of the waveguide. (Experimental results).
Download figure:
Standard image High-resolution imageIt is evident from the B-scans that the curing was rapid and uniform throughout the process. By comparing the A-scan as well as the B-scan for both the cases (with and without delamination), it can be inferred that the signal received from position 3 in figures 7(b) and (c) is from the delamination.
Further, in order to capture the energy variation with process, the square of the peak-to-peak voltage captured is shown plotted as a function of curing time in figure 8. As expected, the amplitude of the reflected signal increases uniformly throughout the curing process corresponding to the increase in acoustical impedance mismatch as the epoxy resin solidifies.
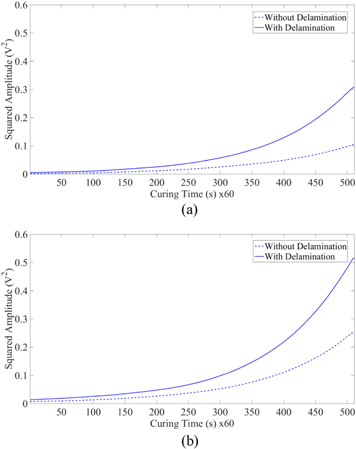
Figure 8. Plots showing the comparison of energy variations (squared amplitude) versus curing time (a) at sleeve opening (b) at the right end of the waveguide. (Experimental results).
Download figure:
Standard image High-resolution imageAt the sleeve opening ultrasonic guided waves leak out in the epoxy substrate as the boundary conditions change due to the change in impedance of the two materials at the junction, a portion of energy reflects back due the change in impedance. In the case of delamination, leaked wave energy reflects back from delamination as well and travels back to the receiver and to the right end of the waveguide. Hence, in the case of delamination over sleeve opening, the reflection received from sleeve opening and the right end is higher than the case of no delamination. Figure 8 shows the energy variations for both the cases (with and without delamination) at the sleeve opening and at the right end of the waveguide.
5.2. Defect monitoring
Once the samples were cured, experiments were carried out with the aim of defect monitoring. Figure 9 shows the A-scan for the sample plate with delamination.

Figure 9. Plot of displacement versus time (A-scan) of the experimental result shows S0 mode reflection, where 1—left end of the plate, 2 and 3—sleeve opening and delamination, 4—right end of the waveguide. (Experimental results).
Download figure:
Standard image High-resolution imageSimulations were performed, to understand the behavior of waves reflected from the sleeve opening region. Reflection from the right end of the plate was not considered for the simulation. Field quantities at the point of excitation was monitored, and variations in the displacement of the reflected waves were captured as the function of time. Figure 10 shows the displacement as the function of time for the point of excitation, for a particular case where delamination was at a vertical distance of 8 mm from the sleeve opening (the reflection received from the delamination was found to be maximum around this distance value, as discussed later, see section 6.3).

Figure 10. Plot of displacement versus time (A-scan) for the point of excitation after Hilbert envelope, where 1—initial signal (a low frequency (100 kHz) S0 mode), 2—reflection from sleeve opening and 3—reflection from the delamination. (FE results).
Download figure:
Standard image High-resolution imageThe results from the experiments and simulations are in good agreement. Thus the proposed method is demonstrated to be effective for monitoring delamination-type defects as well.
6. Discussion
Next we examine parameters which influence the defect monitoring, to optimize and obtain limits on the detection capabilities of the embedded sleeve sensor system.
6.1. Study of waves transmitted
The amount of energy leaking into the epoxy region through the opening was studied for different sizes of openings provided over the copper waveguide. A sleeve opening value of half a wavelength (λ/2) of the (S0-like) mode in the strip was found to be optimum for the study.
6.2. Reflection from sleeve opening
The waves reflected back from the opening were studied and reflection coefficient was calculated for different distances of delamination from the opening. For these studies, the vertical distance was varied between sleeve opening and delamination from 1 to 15 mm with an interval of 1 mm. The delamination length was kept constant (=3/4 λ, slightly larger than the sleeve opening length fixed at λ/2, in order to avoid diffraction effects from the tips of the delamination). Figure 11 shows the variation in reflection coefficient (ratio of the amplitude of the reflection received from the opening to that of the incident signal) as a function of delamination to sleeve opening distance.

Figure 11. Plot showing the behavior of reflected waves from the sleeve opening for different distances of delamination from sleeve opening. (FE results).
Download figure:
Standard image High-resolution imageIdeally, the reflection from the opening should remain constant for all the cases and should not have any influence of the delamination above. However, as the delamination was introduced at 1 mm above the sleeve opening, the reflection coefficient exhibits a sudden decrease. This is likely due to the destructive interference of the reflected wave from the delamination with the wave reflected due to impedance mismatch at the opening of the sleeve. As the distance between the sleeve opening and the delamination increases eventually the reflection, now composed primarily of the reflection from the sleeve opening, stabilizes to a constant value.
6.3. Reflection from delamination
Figure 12 presents results for the reflection coefficient from the delamination alone, (calculated after the point when it is possible to temporally separate the reflection components from the delamination and the sleeve opening) as a function of the distance from the sleeve opening. As discussed above, the wave reflected from the delamination interferes destructively with the reflected wave from sleeve opening. It becomes distinguishable as the vertical distance between delamination and opening increases (approximately 6 mm) and the reflection reaches a maximum value around a value of λ/2 (epoxy). As expected, the reflection from the delamination reduces as we move it farther from the sleeve opening position. This places limits on the range of the technique in practical applications.
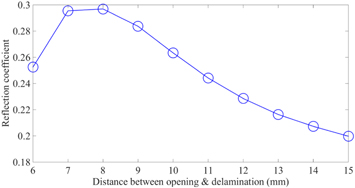
Figure 12. Plot showing the reflection behavior from delamination for various monitoring points. (FE results).
Download figure:
Standard image High-resolution image6.4. Minimum detectable delamination size
To assess the defect detection capabilities of the sensor, various lengths of delamination from λ/4 to 2λ (of the wave mode generated in the waveguide) were considered in the simulations. Reflected signals were captured, and the reflection coefficient was calculated for each case and plotted as a function of delamination length (figure 13). Experiments for validating this phenomenon were also performed by fabricating epoxy plates each with designated size of delamination, all maintained at a distance of 8 mm from the sleeve opening. Figure 13 compares the simulation and experimental results: while the trend is consistent, as expected, the values are lower in the latter case.
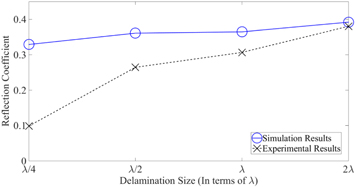
Figure 13. Plot of reflection coefficient versus delamination size gives the comparison between simulation and experimental results.
Download figure:
Standard image High-resolution imageThis is possibly due to the fact that the FE simulations are performed in 2D, and when the cracks are small, the energy leaked out to surrounding regions in larger in experiments. Moreover, for our simple parametric studies, we have not assumed viscoelasticity in our FE models. However this discrepancy does not affect our key finding, that experimentally, the embedded waveguide approach is able to detect delaminations as small as λ/4 in the substrate.
6.5. Influence of waveguide choice
The base waveguide for the proposed system can be in the form of rod, wire, strip or in the form of fiber. The circular, cylindrical, tubular and elliptical waveguide generate longitudinal (L(m, n)), torsional (T(m, n)), and flexural (F(m, n)) wave modes, whereas rectangular and square waveguide generate anti-symmetric (A(n)), symmetric (S(n)) or shear horizontal (SH(n)) modes (wherein m: symmetry, n: number of mode).
Circular waveguide sensors provided with unique embodiments (a bend or a notch) have been used in the past to measure the material properties of metals and viscous liquids at high temperatures [28–30]. These embodiments reflect ultrasonic waves, which act as a reference signal to identify the location inside the test specimen. A waveguide with embodiments such as notch and bend can be prone to buckling inside the structure at high pressures. However, the concept of coated strip with opening as explored in the present paper has the advantage that the structural integrity of the waveguide is maintained [31].
In order to demonstrate a more practical scenario and a wider applicability of the proposed method, feasibility studies were performed for detecting a delamination defect in a bidirectional GFRP composite plate consisting of two laminates using an embedding circular wire waveguide (again made of copper). The L(0, 1) wire waveguide mode was used for this set of studies, with a shrink-fit sleeve as for the earlier studies. Again, an artificial delamination was created by providing a Teflon tape over the sleeve opening (see figure 14). The peak to peak voltage was captured and plotted as a function of time, as shown in figure 15.
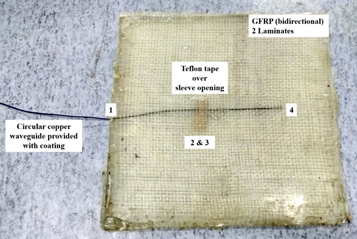
Figure 14. Photograph showing the various positions from which the signals were received in the composite plate, where 1—left end of the composite plate, 2 and 3—sleeve opening and delamination, 4—right end of the waveguide. (Circular waveguide).
Download figure:
Standard image High-resolution image
Figure 15. Plot showing the voltage signals of L(0,1) mode generated through 100 kHz commercial transducer as a function of time received from, 1—the left end of the composite plate, 2 and 3—sleeve opening & delamination, 4—the right end of the waveguide. (Experimental results with circular embedded waveguide).
Download figure:
Standard image High-resolution image
These results demonstrate that the embedded waveguide approach can be performed with other types of waveguides such as circular wire, and the method may work for detecting delamination-type defects in more practical composite plate structures.
6.6. Possibility of imaging using multiple embedded waveguide sensors
The present system consists of a single embedded waveguide sensor, which focuses on localized inspection inside the composite as it has only one opening. To enhance the inspection area, we propose a novel idea of having multiple openings on the waveguide sensor. These openings can act as multiple sources of wave generation enhancing the inspection capabilities along the waveguide sensor. Ultimately, a multitude of such embedded sleeved waveguides with multiple openings can potentially help achieve complete coverage area in large plate structures. These concepts are topics for ongoing and further work at our group.
7. Conclusions and further work
This paper described the development of an embedded sleeved acoustic waveguide sensor for SHM of composite plate structures. The approach was first demonstrated using an epoxy substrate (and later using a GFRP laminated composite) with a delamination. 2D simulations were performed to gain physical insight and optimize various parameters for the experimental setup. Experiments have shown promising results. This work suggests that the delamination/crack can be detected at various distances above the opening. Guided wave reflection is also shown to be sensitive to the size of delamination. The proposed method can prove to be effective for structural health monitoring of large composite plate structures and can also to monitor the curing. However, the method focuses on localized inspection. For complete inspection of the composite structure, multiple openings can be provided to the waveguide, and a matrix of such waveguides can be embedded into the composites.