

Abstract
Nickel-yttria stabilized zirconia (Ni-YSZ) supported tubes were fabricated by plastic extrusion molding (PEM). YSZ was used as the electrolyte and LSM-YSZ (lanthanum-strontium doped manganite) as the oxygen electrode. Both layers were deposited by dip coating and were then sintered at 1500 °C and 1150 °C, respectively. Coelectrolysis experiments were performed in these cells at 850 °C, using different fuel gas conditions varying the amount of steam, carbon dioxide, nitrogen and hydrogen. Area specific resistance (ASR) values ranged from 0.47 Ωcm2, when rich steam and CO2 flows are used, to 1.74 Ωcm2, when a diluted composition is used. Gas chromatography was used to examine the amount of H2 and CO in the output gas. The obtained results are consistent with the equilibrium of the water gas shift reaction. For all the different analysed conditions, faradaic efficiency was found to be close to 100%. This experiment confirmed that there is no electronic conduction taking place through the YSZ electrolyte. The threshold for electronic conduction in the diluted feeding conditions (Poor H2O and CO2) for these particular YSZ-based cell was found at voltages of about 1.65 V.
Export citation and abstract BibTeX RIS

Original content from this work may be used under the terms of the Creative Commons Attribution 3.0 licence. Any further distribution of this work must maintain attribution to the author(s) and the title of the work, journal citation and DOI.
1. Introduction
Simultaneous coelectrolysis of H2O and CO2 is becoming as an emerging technology to produce syngas from CO2 waste and steam. The said reaction constitutes an extensively energy demanding process. The use of this technology will be predominantly of interest combined, for example, with waste heat from other industrial processes. In this case, an increase of the electrolysis temperature implies that the heat-to-electric energy ratio required for the process will be also higher. High temperature electrolysis could be performed with solid oxide fuel cells (SOFC) which are operated in reverse mode (solid oxide electrolysis cells, SOEC). An additional benefit of this process is the fabrication of synthetic fuels, as syngas can be transformed into a high value added product through an additional catalytic process. The combination of this process with a SOEC results in an endothermic process which is favourable at high temperatures. Finally, the total efficiency of the process could be increased, as the joule heat of the cell during electrolysis operation could be used to maintain some of the heat needed for the coelectrolysis [1–3].
Although according to thermodynamics, H2O and CO2 electrolysis require about the same amount of electrical energy, lower performances are typically obtained for CO2 electrolysis in comparison with steam electrolysis [4–6]. In this sense, a much higher area specific resistance (ASR) was found for dry CO2 electrolysis, while simultaneous CO2/H2O electrolysis presents similar behaviour as pure H2O electrolysis [7]. In addition, common fuel electrode catalysts such as nickel are catalytically active for the reverse water gas shift reaction (RWGS), and in practice most of the electrolytic process takes place through the H2O to H2 electrolysis reaction, while the formed H2 subsequently reacts through the RWGS equilibrium producing CO [8]. Using thermodynamics, it is possible to calculate the equilibrium concentrations (Keq) for each component at a desired temperature. For example, Keq values for the WGS reaction at RT (25 °C) and at the operation temperature (850 °C) are 548.3 and 0.74, respectively. As a consequence, similar concentrations from both sides of the WGS reaction will be expected at the operation temperatures. The idea is then that by the coelectrolysis reaction, oxygen will be eliminated by reduction, producing an enrichment of the feeding gas in H2 and CO.
The traditional design for co-electrolysis is the planar configuration. As for fuel cell and electrolysis applications, one interesting alternative is the use of microtubular designs. Their advantages include smaller start-up times, better resistance to thermal stresses and higher energetic density, compared to traditional planar configuration [9–11]. In tubular geometry, by decreasing the diameter of the tube, the electrolyte surface area to volume ratio will be increased. For example, according to the estimations of Sarkar et al [12], using fuel cell stack tubes of 22 mm in diameter will have approximately an eight times lower electrolyte surface area than a similar stack formed with microtubes of 2 mm in diameter. It is then demonstrated that the volumetric power density (VPD) increases with the inverse of the tube radius, reaching VPD values of about 2 Wcm−3. Even higher VPD values (2.5 Wcm−3) were predicted by Suzuki et al [13], which are significantly higher than those of large diameter tubular and planar SOFCs [14]. In fact, there are a few recent studies in the literature proposing the use of microtubular cells for coelectrolysis. For example, Lee et al [15] studied the performance of a tubular solid oxide coelectrolysis cell fabricated using standard materials (Ni/YSZ-YSZ-LSM/YSZ) and they reported current densities of about −0.5 A cm−2 at 1.3 V and 800 °C using a fuel composition of 20% CO2–40% H2O–30% Ar–10% H2. Similar studies were performed by Yu et al [16]. Their tubular cells were composed of Ni-YSZ-based fuel electrode supports, YSZ or ScSZ electrolytes, and composite air-electrodes of LSM or LSCF. They found maximum current densities of about −0.7 A cm−2 at 1.3 V and 850 °C for the ScSZ cell using a fuel composition of 30% CO2–60% H2O–10% H2. In addition, direct synthesis of CH4 from a CO2–H2O feedstock was also recently demonstrated using a tubular design by combining the CO2–H2O co-electrolysis and methanation reactions in a single tubular unit [17, 18]. Although those previous works have demonstrated the feasibility of using microtubular configurations, it is still lacking in the literature about the factors governing the selectivity of the different reactions for the microtubular configuration, where the temperature along the length of the tube is not uniform. Detailed gas chromatography (GC) analysis will be also performed in the present work in order to give some insight to this issue.
2. Experimental details
Nickel-yttria stabilized zirconia (Ni-YSZ) supporting tubes were fabricated by plastic extrusion molding (PEM). YSZ electrolyte was deposited by dip coating and cosintered at 1500 °C. Subsequently, LSM ((La0.8Sr0.2)0.98MnO3))-YSZ cathode was also deposited by dip coating and sintered at 1150 °C. The final dimensions of the cells are: 8 cm length, 3.2 mm diameter, ∼600 μm thick fuel electrode, 20 μm thick YSZ electrolyte, 15 μm thick LSM-YSZ (50/50 vol%) functional layer and 15 μm thick LSM-YSZ (80/20 vol%) current collection layer. The length of the LSM-YSZ was limited to ∼1 cm2 of active area. Additional details about the fabrication procedure are described in the following references [19, 20].
As for the electrochemical measurements, gold wires and paste were used for the electrical contacts. The cells were then sealed using a ceramic paste into alumina tubes for gas input and output. Afterwards, the cell was heated to 800 °C under nitrogen in order to purge all the oxygen inside the chamber. Finally, hydrogen was introduced into the cell to allow NiO to Ni reduction, and left for 24 h in order to assure the microstructural stabilization of the Ni-YSZ support [21]. Initial electrochemical characterization was performed at 800 °C and 850 °C using a VSP Potentiostat/Galvanostat (Princeton Applied Research, Oak Ridge, US) in SOFC mode under a fuel composition of 97% H2-3% H2O, followed by characterization in electrolysis mode using a fuel composition of 50% H2-50% H2O. Subsequently, coelectrolysis experiments were performed in galvanostatic mode using different feeding gas conditions. Combined SOFC/SOEC experiments were performed in a galvanodymic mode at an scan rate of 2.5 mA s–1, starting from OCV down to 0.5 V, then up to 1.5 V and finally back to OCV conditions. The measurement using a Poor H2O and CO2 composition was performed up to 2 V in order to confirm YSZ electroreduction. The outlet gas composition was analyzed using a gas chromatograph (Agilent Technologies 490 Micro-GC). Each experiment was performed at a fixed current density, assuring that the cell reached a stationary state, as confirmed by subsequent GC measurements. Hydrogen was maintained in all compositions to avoid reoxidation to NiO. The first run of measurements was performed using a Rich H2O and CO2 composition (50% water, 25% CO2 and 25%H2). The second set of experiments was performed using a Rich CO2 composition (3% water, 25% CO2, 20% H2 and 52% N2). Finally, the third experiment was performed at high utilization conditions using a Poor H2O and CO2 composition (3% water, 5% CO2, 10% H2 and 82% N2). A summary of the different feeding compositions is listed in table 1.
Table 1. Real feed stream concentration for each experiment.
| H2 | H2O | CO2 | N2 | |
|---|---|---|---|---|
| Rich H2O | 20% | 50% | 0% | 30% |
| Rich H2O and CO2 | 25.5% | 49% | 25.5% | 0% |
| Rich CO2 | 20.4% | 3.1% | 25.5% | 51% |
| Poor H2O and CO2 | 10.2% | 2.3% | 5.1% | 82.4% |
3. Results and discussion
3.1. Fuel cell and electrolysis characterization
Preliminary studies were previously shown [22]. Detailed electrochemical characterization in terms of j-E (current density versus voltage) was performed as shown in figure 1. The different area specific resistance (ASR) results are also summarized in table 2. As observed, ASR values for steam electrolysis (Rich H2O) and coelectrolysis (Rich H2O and CO2) are very similar, and much lower than the one for CO2 electrolysis (Rich CO2), which is consistent with the results of Stoots et al [7], where they found that the cathodic reactions are probably dominated by the reduction of steam to hydrogen, whereas carbon monoxide is mainly produced via the RWGS.
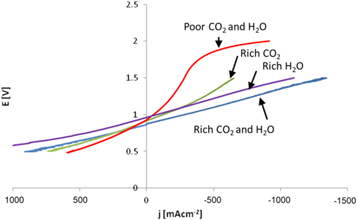
Figure 1. j-E (current density-voltage) curves in SOFC and SOEC modes under different fuel conditions.
Download figure:
Standard image High-resolution imageTable 2. Different ASR values obtained for each experiment.
| ASR (Ωcm2) | ||
|---|---|---|
| SOFC at 0.7 V | SOEC at 1.3 V | |
| Poor H2O and CO2 | 0.85 | 1.74 |
| Rich CO2 | 0.66 | 0.80 |
| Rich H2O | 0.45 | 0.52 |
| Rich H2O and CO2 | 0.49 | 0.47 |
Results for the Rich H2O and CO2 composition are very similar to the one obtained for pure water electrolysis (Rich H2O), which is in good agreement with other results in the literature [7]. In addition, higher overpotentials were obtained for the Rich CO2 composition. Finally, for the Poor H2O and CO2 composition, an increased ASR at high current densities was observed, probably due to a gas diffusion limitation producing concentration polarization. At a certain voltage (about 1.65 V), this tendency is inverted and the resistance is decreasing gradually. However, as confirmed by GC analysis, this resistance decrease is accomplished by a decreased faradaic efficiency. This effect is associated to YSZ electroreduction, where zirconia is being reduced acting as an electronic conductor producing an internal short circuit in the cell, as previously observed in electrolysis mode [23, 24]. This conduction is typically attributed to YSZ electrolyte reduction and is unavoidably linked to cell damage [25–27].
Area specific resistance (ASR) was calculated for both SOFC and SOEC modes from recorded data as a function of inlet gas composition, as described in table 2. ASR values in electrolysis/coelectrolysis mode are ranging from 0.47 Ωcm2 for the Rich H2O and CO2 composition to 1.74 Ωcm2 when a diluted composition is used (Poor H2O and CO2). In concordance with previous results, increased ASR values were obtained by lowering the concentration of the electrolyzed species. It seems that water concentration presents higher impacts than CO2 in terms of ASR, suggesting that the reaction takes place through H2O electrolysis followed by RWGS. This finding is consistent with the predictions from Kazempoor and Braun [28], as they concluded that the influence on RWGS is more significant than temperature, fuel composition and flow rate. Joule heat can be easily obtained as the overpotential and current intensity is known for each operation point. In addition, using thermodynamic data, it is possible to calculate the heat demanded by the reaction. It was found that the selectivity towards H2 and CO is in good agreement with the WGS equilibrium constant. Finally, the thermo-neutral potential is defined where both calculated heats are equal.
3.2. Coelectrolysis operation regime and selectivity
Unlike to steam electrolysis where the thermo-neutral voltage is only temperature dependent, this value for CO2 and steam coelectrolysis is also a function of the obtained selectivity for each of the reduced gas species. For this purpose, outlet gases where monitorized using a micro-GC by fixing the supplied current density and left for stabilization for the different feed stream concentrations. From those measurements, it is possible to estimate the faradaic efficiency of the process in order to conduct the energetic balance and then to identify the endothermic, thermo-neutral and exothermic operation regimes. GC analysis of the hydrogen, carbon dioxide and carbon monoxide content in the output gas revealed a good agreement with the gas shift reaction equilibrium. The different measured concentrations are shown in figure 2.

Figure 2. Gas species evolution in the output of the cell as a function of the applied current density for the Rich H2O and CO2, Rich CO2 and Poor H2O and CO2 conditions.
Download figure:
Standard image High-resolution imageFaradaic efficiency was estimated by measuring the amount of electrolyzed species. For all the studied conditions, it was found to be almost 100%, except for the Poor H2O and CO2 condition. These results confirm that there is no electronic conduction taking place through the YSZ electrolyte. Despite carbon monoxide not being present in the feeding stream, substantial CO concentrations on the output stream were measured, presumably due to the WGS equilibrium reached in the presence of Ni, even under OCV conditions. This finding was observed for all the studied compositions.
The equilibrium temperature for the different studied concentrations is also marked in figure 2. It is observed that this temperature is always lower than the operation temperature for all the conditions. This finding could be explained by the catalytic activity of nickel for the WGS reaction. During the experiment, a gradient of temperature from the centre of the tube (were the oxygen electrode is placed) is generated by the introduction of a gas flow (the oxygen electrode presents a temperature fixed at 850 °C). The homogeneous central zone of the used furnace is about 3 cm long, while the rest of the tube presents a steep gradient with temperatures of about 200 °C at the edges, where the feeding and product gas lines where connected.
Figure 3 represents the energetic balance taking place in the reaction, taking into account solely the energy consumption during electrolysis (dotted blue line) and the predicted energy consumption required for the fulfillment of the observed equilibrium state (doted purple line). The voltage correspondent to the intersection of this line with the red line (which corresponds to the generated heat during steam electrolysis) represents the thermo-neutral operation voltage. In this case, two voltages were generated, which are called thermo-neutral voltage (Etn) and apparent thermo-neutral voltage (Etna). The latter could be defined as the required energy consumption to reach the equilibrium, which is estimated taking into account the equilibrium temperatures found from GC analysis. The obtained values are listed in table 3. As a consequence, the optimum operation regime will be between these two found values (Etn and Etna), while the region E < Etn will be considered as the endothermic operation region and E > Etna as the exothermic operation region.
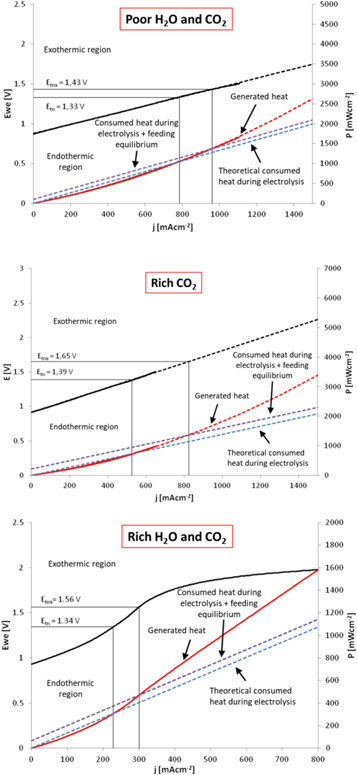
Figure 3. j-E (current density-voltage, black lines); Heat generated during operation (red) and theoretical consumed heat during the electrolysis reaction (dotted lines). Thermo-neutral voltage (Etn) and apparent thermo-neutral voltage (Etna) are found at the theoretical consumed heat and the real consumed heat intersection, respectively. Rich H2O and CO2 (down), Rich CO2 (middle) and Poor H2O and CO2 (up) conditions.
Download figure:
Standard image High-resolution imageTable 3. Thermo-neutral voltage (Etn) and apparent thermo-neutral voltage (Etna) values for the different studied conditions.
| Etn (V) | Etna (V) | |
|---|---|---|
| Poor H2O and CO2 | 1.33 | 1.43 |
| Rich CO2 | 1.39 | 1.65 |
| Rich H2O and CO2 | 1.34 | 1.56 |
Due to current limitations of the experimental setup, and given that the operation conditions were limited to the endothermic region, it is expected for the internal cell temperature to be lower than the furnace setpoint (850 °C, fixed on the oxygen electrode). This is evidenced by the calculated equilibrium temperatures, which are significantly lower than the intended operation temperature.
In any case, we have demonstrated that the tested microtubular cells are able to operate in coelectrolysis mode obtaining similar and even better yields than those obtained for previous steam electrolysis studies. In any case, although apparently the reaction takes place via steam electrolysis followed by the RWGS reaction, we have to take into account that part of the combined reaction can take place via CO2 electrolysis (as found for example by Graves et al [6]) and thus both H2O and CO2 are reduced electrochemically in co-electrolysis mode. There is still no general agreement in the literature about the extent of direct CO2 electrolysis and the magnitude of the chemical reaction of CO2 with electrochemically produced hydrogen via the RWGS reaction.
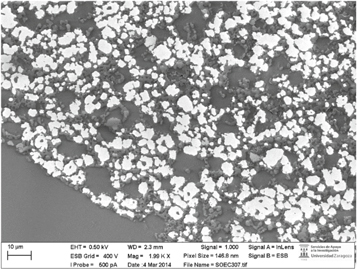
After the electrochemical experiments, a transverse-cross section of the cell was cut and polished for SEM examination. During SEM preparation, complete delamination of the LSM-YSZ oxygen electrode was witnessed, evidencing several damages, probably caused by the aforementioned electrolyte reduction (not found in similar cells not exposed to this process). No additional damage was witnessed on the anode (see figure 4), and no carbon deposition was found, as confirmed by Raman spectroscopy and SEM analysis. In any case as the cell was under operation for short intervals in a wide range of conditions, carbon deposition is not discarded in case of long term operation. The observed degradation was attributed to YSZ electroreduction at high operation voltages, possibly after the experiment conducted at low H2O and CO2 concentrations.
Figure 4. SEM image showing the fuel electrode microstructure and the interface with the YSZ electrolyte after all the electrochemical experiments.
Download figure:
Standard image High-resolution image
4. Conclusions
CO2 and steam electrolysis studies using a microtubular solid oxide cell confirmed their utility for syngas production. Similar ASR values were obtained at 850 °C for steam electrolysis (0.47 Ωcm2) and coelectrolysis (0.52 Ωcm2). For the studied cell, the electronic conduction threshold of the YSZ electrolyte was about 1.65 V. Surpassing this threshold value will result on oxygen electrode delamination and/or electrolyte cracking. According with the electrochemical experiments and the GC analysis, it is concluded that hydrogen is mainly produced by electrolysis but CO is mostly produced by RWGS. In any case, a long term experiment in the coelectrolysis mode is proposed in order to discard any possible carbon deposition.
Acknowledgments
This work was funded by the MAT2015-68078-Rand RTI2018-098944-J-I00 projects, financed by the Spanish Government (Ministerio de Ciencia, Innovación y Universidades) and the Feder Program of the European Union, and also grants GA-LC-035/2012 and LMP154_18 financed by the Aragon Government. The use of Servicio General de Apoyo a la Investigacion-SAI, Universidad de Zaragoza is finally acknowledged for the use of the electron microscopy facilities.