
Abstract
In the present research, work is carried out for the parametric effects like tool rotation speed, tool profile and reinforcement in friction stir processing (FSP) of AA7075 on the microhardness and microstructural properties. The experiment design was carried out using Taguchi L9 orthogonal array with three factors at three levels. Three different tool pin profiles viz. circular, triangular and square were used to experiment. The AA7075 matrix material was reinforced with SiC, RHA, and B4C. The tool rotational speed was chosen as 700, 1000 and 1300 rpm. Using the Taguchi method, the optimum level of each of these parameters was obtained. It was found that rotational speed is the most influential parameter followed by the type of reinforcement and tool profile respectively. The average microhardness of AA7075/B4C composite was found to be increased by 1.5–1.6 times of the base indicating that B4C is better compared to SiC and RHA in improving the microhardness value of the composites.
Export citation and abstract BibTeX RIS
1. Introduction
Materials having a good ratio of strength to weight are exhibiting tremendous importance in modern-day applications especially in the field of automobile and aerospace engineering where importance is placed on improved efficiency and reduced fuel consumption [1]. The fields of automotive, aerospace, defense, marine and recreation require materials with enhanced characteristics of wear resistance, fatigue resistance, temperature withstanding ability, and fracture toughness with cost considerations [2, 3]. Modern infrastructure, equipment, and machinery require a complex mix of material properties to meet the demands [4]. Metal Matrix Composites are an entirely new generation of composites that can satisfy the broad spectrum of demands of the modern-day applications with their characteristic isotropic properties, and try to develop HMMC using ceramics particles and natural fibres like SiC,RHA and, GSA as a reinforced material [2, 5, 6]. Al-based MMC have aluminum as matrix metal that has properties which are well concerned with the automobile industry [3]. The highlighting properties of aluminum and magnesium matrix composites are lower density, better wear resistance, better corrosion resistance, and high formability, especially under condition, which promote creep for which these can be employed for automotive, aerospace and various other technologies [3, 6]. Aluminum matrix composites can be reinforced with silicon carbide, boron carbide, aluminum oxide, titanium carbide, titanium oxide, etc there is an enhancement in the properties of hybrid composites so formed on addition of these reinforcing materials to aluminum composites [7].
A schematic of the Friction stir process is shown in figure 2(a) and FSW setup shown in figure 2(b)illustrates the basic working principle of FSP. Friction stir processing has been developed as a non- consumable rotating tool was inserted into the base metal that developed severe plastic deformation of the materials due to combined action of tool stirring and friction heat for materials processing and modification. Stirring was created through the tool pin and heat was generated by the axial force of the tool. After achieving the direction from advancing to retreating side of the base metal, a non- consumable tool, rotating at high rpm and traverse along the length of the base metal and to achieve the desired surface composite [8, 9]. Around 80 million tons of RHA is produced annually worldwide which poses as a major environmental threat to the areas in which it is dumped. Thus, the use of RHA for making composites is beneficial to the environment.
There are various ways to synthesize reinforced AMCs, some of the techniques used come from liquid metallurgy processing routes and solid route processing. There are many liquid metallurgy processing techniques, which include the process of stir casting, compos casting, liquid infiltration and many more [1]. Solid route processing includes the method of powder metallurgy and friction stir processing can be used on aluminum alloy [10]. Without disregarding the technical proficiency of any of the processing routes available, friction stir processing is the technique used for synthesizing AMCs. Friction stir processing is a short route, solid-state processing technique with one-step processing that can achieve microstructural homogeneity and refinement densification [11]. Friction Stir Processing (FSP) is one of the most effective techniques for fabrication of MMCs. FSP can be considered as a derivative of Friction stir welding, which was used to join materials with low melting temperatures such as aluminum alloys [12]. Surface Composites are being widely used nowadays, owing to their improved surface properties, and FSP provides an effective way for their fabrication [13]. This process makes up for the shortcomings of liquid-phase processing techniques, employment of a process for composite fabrication which can be conducted below melting points of given matrix material can go a long way to improve and consequently optimize the MMCs design and fabrication issue [14]. A non-consumable tool having specially designed pin as well as shoulder undergoes rotational motion during the FSP [15]. During FSP, softening and plastic deformation of the base materials occur owing to frictional heat generation between the tool rotation and base materials [16]. As the tool traverses, the material which comes in contact with the front face of the pin undergoes plastic deformation as a consequence of the friction between the tool and the workpiece. This FSP region results in a stirred zone (SZ) with a fully recrystallized, equiaxed and very fine-grain microstructure and refinement of constituent particles [17, 18].
Friction stir processing has also been used in various types of particle reinforced aluminium composite materials and among them, SiC particle reinforced aluminium alloys have been the ones which are studied the most. Wang et al [19] concentrated their work on the feasibility of making silicon carbide (SiC) reinforced aluminium metal matrix composites. Good interface bonding was observed between the particles and the base metal. The volume percentage of silicon carbide particles is kept at 1.5% in the reinforced region. The microhardness value of the reinforced metal matrix composites was found to be nearly about 10% higher as compared to the base metal Al-6Mg-Mn. Shafiei-Zarghani et al [20] had used Friction stir processing (FSP) to incorporate the nano-sized Al2O3 particles into AA6082 aluminium alloy in order to form a particulate composite surface layer. The Al2O3 particles had an average particle size of approximately 50 nm. The microhardness value of the fabricated composite surface had improved by nearly three times when compared to that of the non-processed aluminum alloy. After this work, a lot of work on surface composite fabrication is reported. Initially, FSP was used to modify aluminium alloys but over time, FSP gains shining role in the modification of other alloys like magnesium alloys, copper alloys, titanium alloys and even steel [21]. Optimum combinations of process parameters were determined for higher microhardness and ultimate tensile strength respectively using signal/noise ratio graphs, response tables, and analysis of variance method [22]. AA6xxx series aluminium alloys are heat treatable whose properties are affected with the exposure of heat and experience annealing effect during FSP. With the reduction of heat exposure time, i.e. reduction of grain growth time or accelerating the cooling effect, larger grain refinement occurs which results in enhanced mechanical characteristics of SCs [23]. Analysis of microstructures and distribution of SiC particles in the fabricated Surface composite were studied by optical microscope and FESEM, respectively and found in good corroboration with the mechanical properties [24]. Some researchers have been reported that different reinforcement like SiC, TiC, ZrO2, and B4C particle are investigated and also to study the effect of different pin profile on the distribution of reinforcement and it concluded that TiC particle exhibit higher hardness value compared to others [25]. In another researcher investigated that the fabrication of AA6061/TiB2 composite and the effects of process parameter like tool rotation, tool traverse, axial load and reinforcement on mechanical and microstructure were studied. Using ANOVA results it indicates that tool rotation speed was found to be the most influencing process parameter followed by the reinforcement, axial load and traverse speed [26].
The objective of this research is to establish the effects of Friction stir processing (FSP) parameters viz. tool profile, reinforcements and tool rotation speed on the microhardness of AA7075 surface modification and to the utilization of ceramics and agro-waste particles to influence the properties of the base material.
Table 1. Composition of AA7075.
| Element | Al | Zn | Mg | Cu | Si, Fe, Mn, Ti, Cr, and other |
|---|---|---|---|---|---|
| % | 90 | 5.6 | 2.5 | 1.6 | 0.23 |
2. Experimental method
The experiment was conducted in two phases. In the first phase, capping pass was performed with a pin-less tool on each groove to cover the reinforcement and maximum load during the capping pass was 590 N. In the second phase, the tool profile and rpm of the tool were adjusted per the design of the experiment prepared in table 2, and the maximum load during processing is around 850 N. For both the phases, traverse speed was kept constant at 40 mm min−1. The tilt angle for capping pass was kept at 0° while for the second phase it was set at 2°. The process parameter were fixed at constant value given in table 3. In figure 1, different pin profile FSP tool was made of H13 tool steel is hot worked chromium-molybdenum steel that is prominently used in hot work as well as cold work tooling applications. The hot hardness of this tool steel resists thermal fatigue cracking which occurs due to the repeated cycles of heating and cooling while performing hot working.
Table 2. Taguchi's L9 Orthogonal array.
| Exp. no | Rotation speed (rpm) | Tool profile | Reinforcement |
|---|---|---|---|
| 1 | 700 | Triangular | SiC |
| 2 | 700 | Circular | RHA |
| 3 | 700 | Square | B4C |
| 4 | 1000 | Triangular | RHA |
| 5 | 1000 | Circular | B4C |
| 6 | 1000 | Square | SiC |
| 7 | 1300 | Triangular | B4C |
| 8 | 1300 | Circular | SiC |
| 9 | 1300 | Square | RHA |
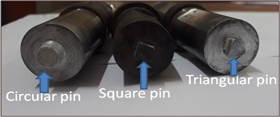
Figure 1. Different tool pin profile used for experimental work.
Download figure:
Standard image High-resolution image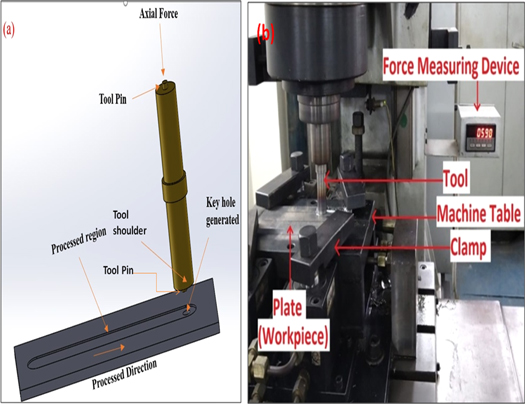
Figure 2. (a). Schematic of Friction stir processing, 2(b) FSW Setup.
Download figure:
Standard image High-resolution image2.1. Matrix material
The base material used here is AA7075, which has zinc as its primary alloying element. The size of workpiece used is (200 × 80 × 8) mm as per the requirements of Friction stir processing setup. Grooves were made in the workpiece lengthwise with the help of a milling slitting cutter. Milling cutter had a bore (inner diameter) of 1.25 inch and outer diameter of 4 inch. The grooves made, were of 3.5 mm depth and 2 mm width. The alloy composition of AA7075 is given in table 1.
Table 3. Process parameters.
| Process paramters | Value taken |
|---|---|
| Tool shoulder profile | Flat |
| Tool shoulder dia | 19.95 mm |
| Tool pin profile | Triangular, Circular, Square |
| Tool pin length | 3.5 mm |
| Tool plunge depth | 0.50 mm |
| Tool tilt angle | 2° constant |
| Type of reinforcement | SiC, RHA, and B4C |
2.2. Reinforcements
Several agro-waste and industrial materials have been deeply investigated to use them as reinforcement but the prominent ones include coconut shell ash(CSA), bagasse ash and rice husk ash (RHA) [27, 28]. Several experiments have been carried out by the researchers and several other researchers on the utilization of ground-nut shell ash (GSA) as reinforcing materials [1–3]. These composites provide improved physical properties such as low density and low thermal coefficient of expansion. Moreover, their cost is reduced too. Mechanical properties and features of the composite has been investigated to establish the viability of RHA, SiC and B4C in development of the composites.

Figure 3. (a) Rice Husk Ash (b) Ball milling machine (c) Fine Rice husk ash powder obtained after sieving.
Download figure:
Standard image High-resolution image2.2.1. Rice Husk Ash (RHA)
Rice Husk was obtained from rice mill near Hisaar shown in figure 3(a). It was burned overnight and the ash was collected in a plastic container. To reduce the size of the RHA particles shown in figure 3(c), ball milling shown in figure 3(b)were done in sand testing lab.
Ball milling works on the principle of impact and size reduction of the particles as steel balls jiggle in a cylindrical shell. Ball milling was performed for 8 h using 16 steel balls. Sieve testing of the obtained ash particles was performed to segregate particles of size 53 or less microns. For this purpose, a sieve of aperture size ASTM 270 was used. SiC, RHA, B4C SEM images are shown in figures 4(a)–(c), were used as a reinforcement.
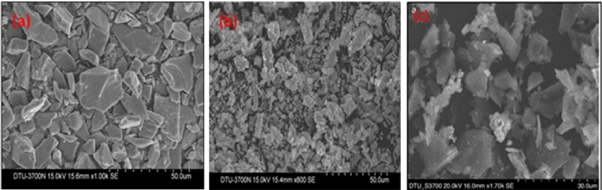
Figure 4. (a) SEM image of SiC at 50 um (b) SEM image of RHA at 50 um (c) SEM image of B4C at 30 um.
Download figure:
Standard image High-resolution image2.2.2. Silicon carbide (SiC)
Silicon carbide is also known by the name of carborundum, and contains silicon and carbon. The main use of SiC powder is it being used as an abrasive. The mesh size of SiC used is 400, which corresponds to the average particles size of 37 microns.
2.2.3. Boron carbide (B4C)
Boron carbide is known to be the third hardest material and is a boron carbon ceramic. It is used in bullet-proof vests, tank armor and engine sabotage powders. For the experiment, B4C of average particles size less than 30 nm was used.
3. Experimental design using Taguchi methods
DOE is an experiment technique in which we analyze the effect of process parameters by varying them simultaneously at different levels. In this manner we are able to capture how different factors interact with each other. Three three-level parameters (rotation speed, tool profile, type of reinforcement) are selected for this study using L9 orthogonal array design. It should be mentioned that only the main factor effects are taken into consideration and not the interactions. A total of nine runs of the experiment need to be conducted using the combination of levels for each process parameters. The full factorial experimental design would have required 3*3*3 = 27 runs. Thus using Taguchi experiment design, we have eliminated 18 FSP runs. This helps to save a lot of time and resources. The experimental design carried out with the help of MINITAB 17 software.
3.1. Filling of reinforcements in the groove
Before filling the reinforcements, the plates were cleaned by keeping them dipped in 500 ml of acetone overnight. The filling of reinforcements has been done considering volume fraction in case of RHA and SiC while for B4C the same was done considering molar solution.

where,
w denotes width of slot cut
d is depth of slot
t is pin length
dp is effective diameter of pin
Based on experimental work, volume fraction of 20% were chosen for filling RHA and SiC in the slots whereas in case of B4C, one molar solution with acetone was prepared and 5 ml solution was poured in each of the three slots.
3.2. Samples preparation for microhardness and microstructure
Specimens of dimensions 10 mm × 10 mm × 4 mm were cut from the processed region through wire EDM cutting. Dry polishing of the specimens were done using emery paper of grit sizes 220, 320, 400, 600, 800, 1000, 1200, 1500 and 2000. After dry polishing, wet polishing is done on abrasive wheel to obtain smooth surface of specimens.
4. Results and discussion
4.1. Microstructure
The square cross-section samples were prepared especially for their microstructure analysis. Samples for the microstructure analysis were cut perpendicular to the processed line at the center of the plate. After the wet polished specimens were then etched in an acidic medium comprised of Hydrochloric acid and Nitric acid mixed in an optimal molar ratio. The process of etching helps to identify the presence of grain boundaries, which is shown in figure 5. Viewing the microstructure was important because one of the most significant effects of FSP was to be the resultant refinement of the grain structure and reinforcement particles like SiC,RHA and B4C, which is shown in figure 6, figure 7 and figure 8. This would be translated into superior mechanical properties imparted to the composite material. For microstructure observations, we used an Olympus GX41 inverted metallurgical optical microscope. The images were taken at 500× for all the square cross-section samples.

Figure 5. Microstructure of base metal at 500× resolution.
Download figure:
Standard image High-resolution image
Figure 6. Microstructure of specimen 1 at 500× resolution.
Download figure:
Standard image High-resolution image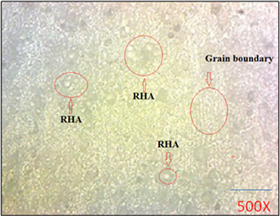
Figure 7. Microstructure of specimen 2 at 500× resolution.
Download figure:
Standard image High-resolution image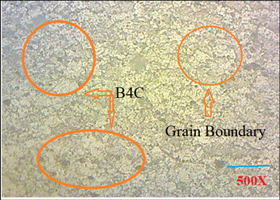
Figure 8. Microstructure of specimen 3 at 500× resolution.
Download figure:
Standard image High-resolution image4.2. Microhardness
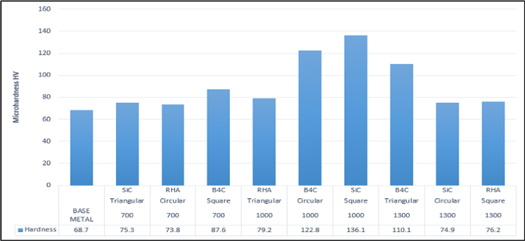
The Vickers microhardness testing of the specimens was performed using Fischer scope HM2000 S microhardness tester. The indenter makes an impression on the polished specimen surface under a designated load for a specified period. Microhardness test has been carried out at 0.300 N or 0.03 kg and the dwell time was 20 s. Repeated measurements of the hardness value were taken at different positions on the specimen surface and subsequently, the arithmetic mean was used for further calculations. The average hardness was calculated using 3 readings on the same load. The average hardness value of FSP processed sample is found to be more than that of base metal alloy. The reason behind this result is the fine dispersion of B4C hard particle in the aluminium substrate. Increase in hardness value of FSPed sample is also due to the Hall-Petch strengthening or grain boundary strengthening. In this, the material strengthens through the changing grain size. In FSP due to friction between base metal and tool probe grain at the surface of the matrix, become fine. The hardness of the parent metal was 68.7 Hv. During the microhardness test, an average of 3-hardness value was taken in the entire sample, see figure 11. Show the hardness bar graph of the entire processed and unprocessed sample with micro and nanoparticle. This observation in micro and Nanoparticle size reinforcement is investigated by literature review in various other material systems. Asadi et al [29] have been reported that the hardness of SiC nanocomposite to be increased due to the uniform distribution of SiC particle and refinement of grain size. Dolatkhah et al [30] have achieved a maximum hardness of 116 Hv in the surface composite of Al 5052 with 50 nm SiC particle size due to grain reduction of the particle. Shamsipur et al [31] reported that the microhardness value of Ti/SiC nano surface composite is three-time greater than the base metal due to the uniform distribution of nano-size reinforcement particles size. Due to the presence of nanoparticles, size reinforcement contributes to producing ultra-fine grain size. The microhardness of the surface composite using B4C nanoparticle reinforcement is higher comparison with SiC or RHA microparticles.
For optimization purpose, Taguchi method utilizes signal to noise (S/N) ratio. The signal to noise ratio signify that the effects of noises on the average responses are computed by the influence on the deviations from the average responses, which will help to gauge the responsiveness of the output of experiment relative to the involved noise factors [32]. In this study, microhardness value of the friction stir processed (FSPed) material is measured. The S/N ratio of the performance characteristic is analyzed according to the criterion higher-the-better which can be expressed as:

where, n = number of repetitions
Yi = value of performance characteristic for the test in ith run
Using the above expression S/N ratio for HV value of each specimen is calculated. The result obtained from micro-hardness testing of the samples is provided in table 4.
Table 4. Experimental results and calculate mean and S/N ratio.
| S. No. | Rotation speed (rpm) | Tool Profile | Reinforcement | HV (mean) | S/N Ratio |
|---|---|---|---|---|---|
| 1 | 700 | Triangular | SiC | 75.3 | 37.536 |
| 2 | 700 | Circular | RHA | 73.8 | 37.361 |
| 3 | 700 | Square | B4C | 87.6 | 38.850 |
| 4 | 1000 | Triangular | RHA | 79.2 | 37.974 |
| 5 | 1000 | Circular | B4C | 122.8 | 41.784 |
| 6 | 1000 | Square | SiC | 136.1 | 42.677 |
| 7 | 1300 | Triangular | B4C | 110.1 | 40.856 |
| 8 | 1300 | Circular | SiC | 74.9 | 37.489 |
| 9 | 1300 | Square | RHA | 76.2 | 37.639 |
Minitab 17 software is used to carry out analysis of this Taguchi experiment design. Table 5 represents the response table for mean HV value. The response table clearly explains that rotation speed is most influential factor in the determination of HV value followed by type of reinforcement and tool profile.
Table 5. Main effects response table of HV (mean).
| Level ↓ | Rotation speed | Tool profile | Reinforcement |
|---|---|---|---|
| 1 | 78.90 | 88.20 | 95.43 |
| 2 | 112.70 | 90.50 | 76.40 |
| 3 | 87.07 | 99.97 | 106.83 |
| Delta | 33.80 | 11.77 | 30.43 |
| Rank | 1 | 3 | 2 |
Table 6 is the response table for the S/N ratio. The S/N ratio is used as a performance measurement characteristic to develop process which is insensitive to the variance factors. For this experiment the process parameter with high S/N ratio gives the optimum setting with least variance. The response table clearly indicates that rotation speed is the most influential factor followed by type of reinforcement and tool profile.
Table 6. Main effects response table of HV (S/N ratio).
| Level ↓ | Rotation speed | Tool profile | Reinforcement |
|---|---|---|---|
| 1 | 37.92 | 38.78 | 39.23 |
| 2 | 40.81 | 38.88 | 37.66 |
| 3 | 38.65 | 39.72 | 40.49 |
| Delta | 2.90 | 0.94 | 2.83 |
| Rank | 1 | 3 | 2 |
The main effects plot for means (figure 9) shows the variation of response variable (HV value) with process parameters i.e. rotation speed, tool profile and type of reinforcement. The horizontal dashed line represents the overall mean value of the response variable. From the plot it is evident that HV value is maximum at second level of rotation speed (1000 rpm), third level of tool profile (square profile) and third level of reinforcement type (B4C).

Figure 9. Main effects plot for means.
Download figure:
Standard image High-resolution imageFigure 10 show the main effects plot for S/N ratios. From the plot it is evident that S/N ratio is maximum at second level of rotation speed (1000 rpm), third level of tool profile (square profile) and third level of reinforcement type (B4C).

Figure 10. Main effects plot for S/N ratios.
Download figure:
Standard image High-resolution imageRepeated measurements were also done to determine the HV value of the base metal and it was found to be 68.7. A bar graph is plotted to visualize the HV values of the nine specimens with respect to the base metal. It is clearly evident from figure 11, that the microhardness value of all FSPed samples is improved with respect to the base metal.
Figure 11. Bar graph of microhardness (HV value) of all specimens.
Download figure:
Standard image High-resolution image
The improvement achieved in micro hardness value of the processed zone is very significant and evident from the bar graph shown in figure 11. The results of this study are in complete agreement with the previous works carried out by distinguished researchers.
4.3. Analysis of variance (ANOVA)
Each of the FSP process parameter responses were estimated and significant contribution using ANOVA to understand their significance. The ANOVA responses along with the related terms are summarised in table 7. Percentage contribution of individual FSP parameter for different responses was summarised in the ANOVA.
Table 7. ANOVA result for various responses.
| FSP Parameter | SS | DOF | Variance | % Contribution | F-ratio |
|---|---|---|---|---|---|
| Microhardness Tool Rotation(rpm) | 5122.0201 | 2 | 2561.01 | 35.1604 | 14.0425 |
| Tool Profile | 1301.5117 | 2 | 650.756 | 8.934 29 | 3.568 22 |
| Reinforcement | 4496.5639 | 2 | 2248.28 | 30.8669 | 12.3278 |
| Error | 3647.5065 | 20 | 182.375 | 25.0385 | |
| Total | 14 567.602 | 26 | * | 100 |
Table 7 indicates that tool rotational speed in rpm as the most influential factor for microhardness followed by the type of reinforcement and tool profile. In the previous literature survey, ANOVA was used to evaluate the process parameter and find out the most influencing parameter for micro hardness and UTS [21]. Taguchi method was used to establish the relation between input and output parameter and ANOVA was used to determine the significance of the parameters [33]. In another research, using ANOVA was performed to find the influence of reinforcement on the mechanical properties like hardness, % elongation, UTM and yield strength of the composite material [28]. It is a systematic method to determine the relationship between factors affecting a process and the output of that process. It is used to find cause-and-effect relationships. This information is needed to manage process inputs to optimize the output. DOE gives the optimized result of given experimental values or the outcome of the experiment performed [34, 35].
5. Conclusion
A detailed account of fabrication of AA7075 surface composite with different process parameters is presented. The results of the present investigation can be concluded as follows:
- 1.With the help of Taguchi technique, optimum condition was obtained to achieve the maximum value of microhardness. Increase in rotation speed from 700 rpm to 1000 rpm led to increase in HV value but further increase to 1300 rpm decreased the Hv value. Thus, 1000 rpm is the optimal choice.
- 2.Percentage contribution of the process parameters towards microhardness was achieved. Tool rotation speed is found to be the most influential factor followed by the type of reinforcement and tool profile.
- 3.Tool profile had much less significance on the Hv value compared to other parameters. Still square tool profile was found to be the optimal choice. This is attributed to the high pulsating action generated from square tool profile.
- 4.The average hardness value of AA7075/B4C composite is found to be increased by 1.5–1.6 times of base metal, which was around 68 Hv. B4C is found to be the most effective reinforcement compared to SiC and RHA in improving the microhardness value of the composite.
- 5.The average hardness value of AA7075/RHA composite was observed to be 76.4 which is about 11 % more than the base metal thus instead of dumping, RHA can be used to make aluminium composites with improved microhardness.