
Abstract
Carbide free nano-bainitic (NSB) steels have a dual phase structure comprising of retained austenite (RA) and bainitic ferrite (BF). The content and morphology RA and BF in NSB steels can be easily modulated by changing the austempering temperature. This results in significant changes in the strength and is expected to influence the corrosion resistance as well. The corrosion behavior of three NSB steel blocks austempered at 250, 300 and 350 °C has been studied in aqueous chloride (3.5 wt% NaCl) environment. Electrochemical impedance spectroscopy (EIS) and potentiodynamic polarization have been used to investigate the role of austempering temperature on the corrosion response. It is found that the corrosion current density and hence the corrosion rate decreases with a reduction in austempering temperature. Moreover, a reduction in the austempering temperature shifts the corrosion potential towards the nobler side. The EIS studies have shown that the charge transfer resistance gets enhanced for specimens austempered at lower temperatures. This comes with a concomitant lowering in the capacitance of the electrical double layer formed between the steel specimen and electrolyte. Thus, it is possible to achieve a combination of high hardness and corrosion resistance by fabricating the NSB steels at low austempering temperatures.
Export citation and abstract BibTeX RIS
1. Introduction
Nanostructured bainitic (NSB) steels can potentially replace commercial alloys in automobile, rail, defence and structural applications due to their high tensile strength, wear resistance, fracture toughness and ductility [1–7]. The unique combination of strength and toughness arises from the dual phase microstructure comprising of very thin laths of bainitic ferrite (BF) separated by films of carbon enriched ductile retained austenite (RA) [8–11]. NSB steels can be formed in bulk by transformation at low temperatures if sufficient amount of alloying elements have been added to decrease the martensitic start temperature [8].
Corrosion is one of the major challenges faced during service of mechanical components and may lead to material loss, high maintenance cost and failure. Corrosion resistance is dependent on factors like environment, temperature, alloy composition as well as its microstructure. Thermo-mechanical treatments of steels may yield unique microstructures consisting of various equilibrium (ferrite, pearlite) and metastable phases (bainite, martensite). The local heterogeneities in crystal structure and chemical composition in multi-phase structures accelerate the electrolyte attack due to formation of micro galvanic cells leading to selective dissolution [12–14].
A bainitic rail steel with 0.71C-1.15Mn-0.4Cu-0.59Cr-0.2Ni-0.35Si-Fe(rest) (wt%) has been found to exhibit better corrosion resistance in salt fog test in 0.6 M NaCl than a pearlitic steel of same composition due to the formation of a compact non porous oxide layer in the former [15]. However, both steels have shown comparable corrosion current densities during immersion and polarization test [15]. It has been found that during a salt fog test of 0.47C-0.87Mn-0.5Si-Fe(rest) (wt%) steels with different microstructures in 3.5 wt% NaCl solution, bainitic steels transformed for long duration exhibited improved corrosion resistance in comparison to pearlitic steel as well as bainitic specimens transformed for relatively shorter time. However, bainitic specimens austempered for a shorter time showed improved polarization resistance [16]. The comparative corrosion behavior of five microstructures of steel with 0.7C-0.24Si-1.12Mn-Fe(rest) (wt%) has been investigated using electrochemical techniques in 3.5 wt% NaCl solution [17]. Tempered martensitic specimen exhibited the highest corrosion rate which decreased in the order: martensite > spheroidized > bainite > pearlite. The different nature of the micro galvanic cells formed between the cathodic carbide and anodic ferrite particles due to variations in morphology, composition and phase contents amongst these different microstructures led to this trend [17].
Electrochemical impedance spectroscopy (EIS), potentiodynamic and galvanostatic polarization studies of two steel blocks of NSB and martensitic steels in 3.5 wt% NaCl solution have been performed [18]. The polarization resistance obtained from EIS for NSB steel (3400 Ω cm2) is higher than martensitic steel (2000 Ω cm2). The corrosion current density of NSB steel is 85% lower than martensitic steel thus reflecting higher corrosion resistance of NSB steel [18]. Galvanostatic polarization tests have shown that the phase constituents with a higher concentration of carbon and greater number of high energy grain boundaries have larger susceptibility for localized attack resulting in increased dissolution rates [18]. Kazum et al [19] have used potentiodynamic and galvanostatic polarization to study the corrosion response of two NSB steel blocks in 3.5 wt% NaCl solution. NSB block transformed at 350 °C constitutes a higher fraction of RA resulting in a larger corrosion current density (3.98 μA cm−2) compared to the block transformed at 200 °C (1 μA cm−2). This has been attributed to the higher degree of dissolution of RA than BF due to RA's higher carbon concentration than BF.
Austempering temperature is a convenient way to modulate the microstructure of NSB steels and in turn control the mechanical properties. However, the difference in the volume fraction and morphology of RA and BF formed at different austempering temperatures invariably affects the corrosion response. Therefore, it is critical to thoroughly investigate the differences in corrosion behavior triggered by a change in isothermal transformation temperature. EIS and potentiodynamic polarization studies of specimens made from three steel blocks austempered at 250, 300 and 350 °C respectively have been used to characterize the corrosion behavior of NSB steels. It has been found that the corrosion potential moves towards the nobler side and current density decrease with a reduction in austempering temperature while the polarization resistance is enhanced. The results give hope that a combination of high strength and corrosion resistance can be achieved in NSB steels by decreasing the austempering temperature.
2. Experimental procedure
2.1. Steelmaking
Steel of chemical composition Fe-0.86% C-1.4% Si-1.8% Mn-0.47% Al-1.88% Co- 0.23% Mo (in weight %) has been used in the current work to obtain nanobainitic structure after heat treatment. Presence of high carbon in the alloy decreases the transformation temperatures for metastable phases (bainite, martensite) and increases the gap between bainitic start (BS) and martensitic start (MS) temperature [8, 20, 21]. This makes it possible to form nanobainite over a range of temperatures (T) such that MS < T < BS. Addition of Si has been done to prevent the precipitation of cementite during the transformation [22, 23]. Mn has been added to decrease the BS temperature and to delay the pearlitic transformation by shifting the time-temperature- transformation (TTT) curves towards a larger time [24]. Alloying elements like Co and Al have been added to accelerate the kinetics of bainite formation [25, 26]. The steel has been produced in a vacuum induction furnace and the ingot has been homogenized at 1000 °C for 48 h followed by hot rolling in multiple passes with 57% reduction in thickness. Multiple steel blocks comprising of nanobainite have been obtained by austenitizing the homogenized sample at 1000 °C for 75 min followed by austempering at 250 °C, 300 °C and 350 °C respectively in a salt bath furnace for 48 h. The isothermal temperatures were selected based on the BS (400 °C) and MS (120 °C) determined from empirical equations [17, 27–29]. A difference of 50 °C between the three isothermal transformation temperatures was chosen to get different morphologies and content of bainitic ferrite and retained. The specimens extracted from the different steel blocks have been referred to as NB250, NB300 and NB350 based on the respective austempering temperatures of the steel blocks.
2.2. Characterization
The initial microstructures of all samples have been examined before electrochemical testing using scanning electron microscopy (SEM) and X-ray diffraction (XRD). Small rectangular specimens of size 10 × 5 × 5 mm3 have been cut from each austempered block for metallographic examination. The specimens have been polished to a surface finish of 1 μm using silicon carbide papers and diamond paste followed by chemical etching with 2% Nital. X-ray diffraction (XRD) of all three specimens has been carried out in PANalytical X'pert Pro MPD system with Cu-Kα radiations using a monochromator detector to determine the volume fraction of phases in each specimen. A current of 30 mA and a voltage of 40 kV has been applied during the scan over a 2ϴ range of 40°–120° with a step size of 0.01°. The XRD data has been subsequently analyzed using X'Pert Highscore software and volume fraction of bainite and retained austenite was calculated from integrated intensities of ferrite {110}, {200}, {211}, {220} peaks and austenite {111}, {200}, {220}, {311} peaks respectively [30, 31].
2.3. Electrochemical tests
EIS and potentiodynamic polarization have been used to evaluate the corrosion behavior of nanostructured bainitic steel. Specimens of size 5 × 10 × 5 mm3 have been cut from the heat-treated blocks. The samples were mounted in a cold setting resin such that an area of 0.5 cm2 was exposed. The exposed surface of sample was polished to 1 μm finish to avoid any micro grooves and rinsed with ethanol and deionized (DI) water prior to electrochemical tests. All the crevices on the exposed surface were sealed using a quick setting epoxy to stop the penetration of electrolyte. A three-electrode set up was used with the bainitic specimen being the working electrode, saturated calomel electrode (SCE) with standard potential of E°SHE = +0.244 V as a reference and platinum mesh with 1 cm2 area as a counter electrode. The electrolyte used in this study was 3.5 wt% NaCl solution. The electrochemical tests were performed on AUTOLAB PGSTAT204 potentiostat. Prior to EIS and potentiodynamic polarization experiments, the samples were kept immersed in the electrolyte for 5 h to attain the open circuit potential (OCP). The EIS was carried out by applying sinusoidal potential of 10 mV amplitude in frequency range from 105 to 10−2 Hz at the respective OCP values of the specimens. Impedance data was fitted to an equivalent circuit using NOVA 2.1 software. Polarization tests were performed at ambient temperature at a scan rate of 0.166 mV s−1 in range of ±1.5 VSCE with respect to OCP. Corrosion current density and polarization resistance for the different specimens were calculated using circuit fitting and polarization plot extrapolation values. The polarization resistance and corrosion rate has been calculated by the equations shown below (equations (1), (2)) using corrosion current density and slopes:


RP represents polarization resistance in ohm cm2, icorr is corrosion current density in μA cm−2, βA and βC are slopes expressed in volts per decade for anodic and cathodic regions respectively, CR represents corrosion rate in milli inches per year (mpy), E.W is the equivalent weight of iron and 'd' is density in g cm−3. The corrosion current density has been calculated by extrapolating the linear portion of anodic curve to the point where it cuts the corrosion potential. The anodic slope was measured above ±100 mV of Ecorr over 1 decade.
3. Results
3.1. Initial Microstructure
The detailed microstructural characterization of the three specimens was done using SEM and XRD. Figure 1 shows the microstructure of nanostructured bainitic specimens after austempering at 250, 300 and 350 °C respectively. Two phases with distinct morphologies can be observed in the micrographs: fine laths of BF separated by films and blocks of RA. Figure 1 also shows the refinement in the morphology of microstructure with a decrease in austempering temperature. Nanobainitic transformation is displacive in nature and doesn't involve diffusion of substitutional alloying elements like Mn, Si, Al, Co and Mo between the parent and product phase [29, 32–34]. However, carbon partitions from BF to RA during the transformation resulting in chemical heterogeneity between the two phases [35–37]. The volume fraction of RA and BF has been calculated from XRD and is shown in table 1.

Figure 1. SEM micrographs of specimens transformed at (a) 250 (b) 300 and (c) 350 °C.
Download figure:
Standard image High-resolution imageTable 1. Morphology and volume fraction of the phases in the specimens used for electrochemical testing. Lt is the bainitic lath thickness, Vα is fraction of bainitic ferrite and Vγ is fraction of retained austenite.
| Specimen | Lt (nm) | Vα | Vγ |
|---|---|---|---|
| NB250 | 44.6 ± 9.0 | 0.90 ± 0.04 | 0.1 |
| NB300 | 53.3 ± 12.0 | 0.80 ± 0.07 | 0.2 |
| NB350 | 77.1 ± 15.5 | 0.77 ± 0.06 | 0.23 |
Figure 2 shows the XRD spectra of isothermally transformed specimens prior to immersion test. The intensity of ferrite peaks in figure 2 grows stronger with decreasing austempering temperature and is an indication of a large fraction of bainitic ferrite. The volume fraction of BF and RA in NSB steels is influenced by the austempering temperature for a fixed transformation time. A lower austempering temperature offers a large free energy change from austenite to ferrite promoting the formation of larger fractions of BF in the final microstructure. Moreover, a decrease in austempering temperature results in formation of finer bainitic laths and films of RA.
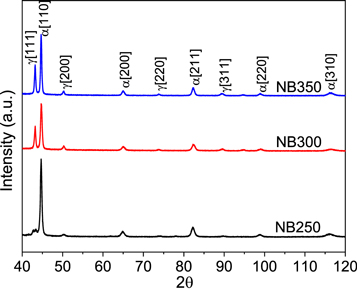
Figure 2. XRD spectra of three specimens austempered at 250, 300 and 350 °C.
Download figure:
Standard image High-resolution image3.2. Electrochemical characterization
The electrochemical characteristics of all austempered specimens have been analyzed after extracting the data from EIS and potentiodynamic polarization measurements. The results from the EIS tests are shown in the form of a) Nyquist plot and (b) Bode plot for all specimens in figure 3 and 4 respectively. Nyquist curve is plotted between the imaginary (Zʹʹ Ω cm2) and real (Zʹ Ω cm2) impedance component at different excitation frequencies (figure 3).

Figure 3. Nyquist plot for NSB steel specimens in 3.5 wt% NaCl Solution.
Download figure:
Standard image High-resolution image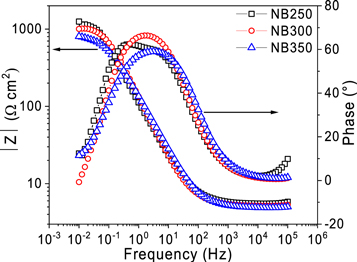
Figure 4. Bode plot for the three austempering conditions.
Download figure:
Standard image High-resolution imageThe shape of the Nyquist plot reflects the electrochemical behavior and the output has been simulated using electrical circuit with components like resistors and capacitors (circuit shown in figure 5). RS and RCT represent the solution resistance and charge transfer resistance respectively. The diameter of the semicircle along the x-axis on Nyquist plot represents the charge transfer resistance (RCT). It can be seen from figure 3 that the diameter of the semicircle decreases with an increase in bainitic transformation temperature signifying lowest value of RCT for NB350 specimen. The shape of Nyquist plot shown in figure 3 isn't a perfect semicircle. A depressed and distorted semicircle often refers to a non-ideal capacitive behavior and therefore it is appropriate to simulate the response using a constant phase element (ZCPE). The constant phase element can simulate the electrode surface roughness and heterogeneities as well as the non-uniform charging of double layer formed at the interface of metal and electrolyte [12, 15] The equation for ZCPE is given below:

where Qdl is a constant with units mΩ−1 cm−2 sn, 'j' is the imaginary number, 'ω' is the angular frequency. The value of n varies between 0 < n < 1; 0 for an ideal resistor and 1 for pure capacitor. The EIS data has been fitted with an equivalent circuit using electrochemical software Nova 2.1 and is shown in figure 5.
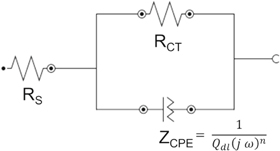
Figure 5. Equivalent circuit of the corrosion response of NSB steels in 3.5 wt% NaCl solution.
Download figure:
Standard image High-resolution imageThe modulus of impedance and phase angle is plotted with respect to the frequency in a Bode plot as shown in figure 4. The Bode modulus plot clearly shows the trend for the variation with austempering temperature of charge transfer and solution resistance at low and high frequencies respectively. The metal-electrolyte system can be considered as an electrical circuit and electrons will always follow the path of least impedance. At high frequency, the capacitance is negligible due to its inverse proportionality to frequency and therefore only the value of RS is accounted. At low frequency, capacitance is very high and therefore, electrons flow through RCT. This gives the total resistance of RS + RCT at low frequency. No distinct variation amongst different specimens is observed in the Bode magnitude plot at high frequency due to similar values of solution resistance however, at low frequency each specimen exhibits a clear variation in the impedance. The value of capacitance cannot be directly determined from either of the plots (Nyquist or Bode) and therefore, circuit fitting is required.
All parameters obtained after circuit fitting are compiled in table 2. It can be seen from table 2 that specimen NB250 shows the highest corrosion resistance which can be observed from the Nyquist plot and Bode magnitude plot as well. The RCT of NB250 is 42% greater than that of NB350. The value of Qdl represents the capacitance of the double layer formed at the interface of specimen and electrolyte. The highest Qdl was observed in NB350 specimen with the lowest 'n'. A slight evidence of two-time constants (horizontal region at the peak of phase -frequency plot for NB250) can be observed in figure 4 for NB250 in Bode magnitude plot. The two peaks however are not properly resolved and hence only a single time constant circuit is fitted for NB250. This behavior is in general a result of accumulated corrosion products on surface acting as the second film. However, in the present case for NB250, the layer is not stable enough to yield a separate capacitive peak on the Bode plot [38].
Table 2. Fitting parameters of EIS spectra of different specimens immersed in 3.5 wt% NaCl solution.
| Specimen | RS (Ω cm2) | RCT (kΩ cm2) | Qdl (mΩ−1 cm−2 sn) | n |
|---|---|---|---|---|
| NB250 | 5.5 | 1.23 | 1.56 | 0.92 |
| NB300 | 5.5 | 1.05 | 1.63 | 0.88 |
| NB350 | 5.4 | 0.88 | 1.97 | 0.77 |
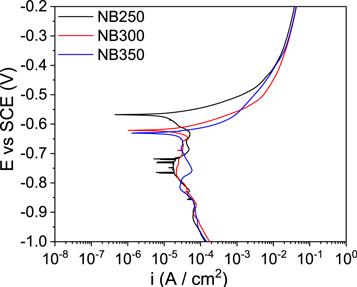
Potentiodynamic polarization curves in figure 6 and the extracted corrosion potential (Ecorr) and corrosion current density (icorr) in table 3 show that the Ecorr moves towards the active side and icorr increases with austempering temperature. NB350 shows the highest corrosion current density and therefore is more prone to corrosion than NB300 and NB250. Equation (1) has been used to calculate the polarization resistance and table 3 shows that polarization resistance decreases with an increase in austempering temperature. NB250 in chloride solution experiences a polarization resistance of 1.48 kΩ cm2 whereas the specimen with the highest fraction of RA (NB350) exhibited lowest resistance of 1.02 kΩ cm2.
Figure 6. Potentiodynamic polarization curves for nanostructured bainitic steel transformed at 250, 300 and 350 °C in 3.5 wt% NaCl solution.
Download figure:
Standard image High-resolution image
Table 3. Summary of results obtained after potentiodynamic polarization test for all specimens.
| Specimen | NB250 | NB300 | NB350 |
|---|---|---|---|
| Ecorr (VSCE) | −0.56 | −0.62 | −0.63 |
| icorr (μA cm−2) | 21.5 | 27.9 | 31.2 |
| −βc (V dec−1) | 0.28 | 0.25 | 0.28 |
| βa (V dec−1) | 0.1 | 0.1 | 0.1 |
| Polarization resistance (kΩ cm2) | 1.48 | 1.11 | 1.02 |
| Corrosion rate (mpy) | 9.7 | 12.6 | 14.1 |
4. Discussion
EIS and potentiodynamic polarization tests have been conducted to understand the corrosion mechanisms in NSB steels. NSB steels do not exhibit passivation due to absence of elements like Cr and Ni. Therefore, the severity of anodic dissolution during polarization is dependent on the nature and characteristics of double layer measured from EIS. Large value of Qdl for NB350 specimen indicates low resistance to charge discharge of electrons in double layer making it more susceptible to dissolution compared to the other specimens [17]. A higher value of Qdl also suggests non homogeneous, rough and loose surface layer with poor adherence of corrosion products [12, 17]. The value of Qdl is lowest for NB250 specimen indicating a homogenous, compact surface layer adhered to metal resulting in high resistance towards corrosion (also indicated by high value of RCT). This can be attributed to the least amount of RA in NB250 and also to the fine microstructure with uniform distribution of BF and RA, effectively anchoring the corrosion products onto surface. Moreover, the exponent 'n = 0.92' for NB250 shows a near ideal capacitive behavior signifying formation of a stable double layer which acts as a barrier for electrons and inhibits corrosion. The value of 'n' decreases with increase in austempering temperature indicating larger deviation from pure capacitive behavior at higher austempering temperatures (seen in figure 4).
Potentiodynamic polarization results have shown that decreasing the austempering temperature shifts the Ecorr towards the noble side as well decreases the icorr. Reduction in the content of RA, as an effect of decreased austempering temperature, is the probable reason of reducing the icorr and shifting of Ecorr in the positive direction. Large fraction of carbon enriched RA results in large number of sites for micro galvanic cell formation. The galvanic cell formation is an outcome of variation in carbon concentration between RA and BF which eventually leads to selective dissolution of RA [18, 19]. Hence, the highest corrosion rate was observed in NB350 specimen due to large fraction of carbon rich RA. The cathodic curves for all specimens (figure 6) suggest diffusion controlled reactions while the steps in the cathodic arm indicate the reduction of various reacting species majorly: dissolved oxygen and hydrogen ions [15, 18, 19].
The results from the present work highlight the significance of microstructure in designing corrosion resistant NSB steels. It has been observed that low temperature austempering of NSB steels not only results in refined microstructure but also improves the corrosion resistance. The fine microstructure with less fraction of carbon rich RA in NB250 led to the formation of compact double layer with near ideal capacitive nature which effectively slowed the diffusion of electrolyte ions into the metal thereby reducing the corrosion rate.
5. Conclusion
The corrosion resistance of NSB steels was examined in 3.5 wt% NaCl aqueous medium as a function of the austempering temperature. The content and morphology of RA decreased with a reduction in austempering temperature. The following conclusions have been drawn from the study:
- (a)EIS studies have showed that decreasing the austempering temperature stabilized the steel against corrosion. This has been manifested in the form of higher charge transfer resistance in the circuit between the specimens and the electrolyte. The thickness of the double layer also increased with a reduction in austempering temperature.
- (b)The corrosion potential moved towards the nobler side with a decrease in austempering temperature and all specimens exhibited diffusion controlled cathodic reaction.
- (c)The corrosion current density increased with an elevation in austempering temperature. It is suspected that galvanic cell formation due to the large difference in carbon concentration between RA and BF led to selective dissolution of RA which was the most voluminous in specimens austempered at the highest temperature.