


Abstract
Brain aging research relies mostly on cross-sectional studies, which infer true changes from age differences. We present longitudinal measures of five-year change in the regional brain volumes in healthy adults. Average and individual differences in volume changes and the effects of age, sex and hypertension were assessed with latent difference score modeling. The caudate, the cerebellum, the hippocampus and the association cortices shrunk substantially. There was minimal change in the entorhinal and none in the primary visual cortex. Longitudinal measures of shrinkage exceeded cross-sectional estimates. All regions except the inferior parietal lobule showed individual differences in change. Shrinkage of the cerebellum decreased from young to middle adulthood, and increased from middle adulthood to old age. Shrinkage of the hippocampus, the entorhinal cortices, the inferior temporal cortex and the prefrontal white matter increased with age. Moreover, shrinkage in the hippocampus and the cerebellum accelerated with age. In the hippocampus, both linear and quadratic trends in incremental age-related shrinkage were limited to the hypertensive participants. Individual differences in shrinkage correlated across some regions, suggesting common causes. No sex differences in age trends except for the caudate were observed. We found no evidence of neuroprotective effects of larger brain size or educational attainment.
Introduction
Knowledge about the aging brain is derived mostly from cross-sectional studies (Raz, 2000; Sullivan and Pfefferbaum, 2003; Hedden and Gabrieli, 2004; Raz, 2004). Such studies estimate the average rate of aging from correlations with age but, unlike longitudinal investigations, are incapable of directly gauging rates of change and individual differences therein. Cross-sectional evidence suggests that in healthy adults, age-related volume reduction is more pronounced in gray (especially prefrontal) matter, and shrinkage of sensory and entorhinal cortices is virtually nil (Raz, 2000). Thus far, longitudinal studies, with only a few exceptions, have used global indices of brain integrity, and reveal little about regional change (Raz, 2004). Three exceptions are longitudinal studies revealing significant shrinkage of prefrontal regions with smaller but significant declines of other regions (Pfefferbaum et al., 1998; Resnick et al., 2003; Scahill et al., 2003). However, in those studies the sample size and/or the number of examined regions were limited. In addition, the extant longitudinal studies, while relying on the samples of generally healthy adults, included some participants with cardiovascular illness, which is common in older persons. The effects of mild vascular conditions, which can exert subtle but detectable negative influence on the brain and cognition (Raz et al., 2003a), have not been examined in the context of longitudinal change.
The studies of brain change have also been limited by reliance on standard linear models that emphasize average trends, are oblivious to measurement issues and disregard individual differences in regional changes, thus obscuring the heterogeneity in brain aging. Those methods assume, without testing, that the same construct is measured over time without separating construct variance from specific variance and measurement error. New longitudinal methods, such as Two-Occasion Latent Difference Modeling (LDM) (McArdle and Nesselroade, 1994), alleviate most of those problems by greatly reducing unreliability of difference scores, examining mean change and individual differences within the same framework, and formally testing measurement equivalence across occasions and groups (cf. Meredith, 1964). In this study, we used LDM to examine average changes, individual differences in change and covariances of change in multiple brain regions, with attention to departures from linearity. We also assessed the associations of brain volumes at baseline and brain volume changes with age, sex and vascular health (hypertension). While some average age trends in a portion of this sample have been reported (Raz et al., 2003b,c, 2004a), most cortical regions, variability of change and the influence of health-related factors have not yet been examined.
On the basis of cross-sectional (Raz, 2000; Bartzokis et al., 2001; Jernigan et al., 2001; Raz, 2004) and longitudinal (Pfefferbaum et al., 1998; Resnick et al., 2003) findings, we hypothesized the steepest decline in the lateral prefrontal cortex, with smaller shrinkage of the temporal association cortices and sparing of the primary visual cortex and the inferior parietal lobule. Because of reported nonlinear cross-sectional age trends (Courchesne et al., 2000; Bartzokis et al., 2001, 2004; Jernigan et al., 2001; Raz et al., 2004b), we hypothesized acceleration of white matter shrinkage with age. Connectivity between the prefrontal cortex and the striatum (Alexander et al., 1986), and age-related shrinkage in both (Raz et al., 2003b; Rodrigue and Raz, 2004), suggested significant associations between changes in those regions. In addition, we tested hypotheses that hypertension exacerbates age-related shrinkage in prefrontal regions (Raz et al., 2003a), that women show lesser brain aging than men (Coffey et al., 1998), that larger brain volume is a neuroprotective factor (Satz, 1993), and that higher formal education delays brain aging and ameliorates its course (Stern et al., 1992; Kramer et al., 2004).
Materials and Methods
Participants
The data for this study were collected in a major metropolitan area in the USA. The participants of multiple cross-sectional studies (Raz et al., 1997, 1999, 2000, 2004b) were contacted by mail and telephone, and invited for the longitudinal follow-up. Of 323 eligible persons, 226 (70%) responded to the invitation and 140 (43% of the total eligible pool, or 62% of the responders) agreed to participate in the study. The participants signed a consent form approved by the University Committee for Protection of Human Subjects in Research and by the Hospitals Patients Participation Committee. All participants were screened with a mail-in health questionnaire completed by the participants and augmented by telephone and personal interviews.
Of 140 persons who agreed to participate, 127 (91%; 39% of the initial eligible pool) completed the follow-up study. Screening criteria applied to the follow-up sample were identical to those used to determine eligibility at the first occasion. Persons who reported a history of severe cardiovascular, neurological or psychiatric conditions, head trauma with loss of consciousness for >5 min, thyroid problems, diabetes, treatment for drug and alcohol problems, or a habit of taking three or more alcoholic drinks per day were excluded from the study. Participants with two types of cardiovascular problems were included in the analysis: hypertension controlled by medication (19 cases) and mitral valve prolapse (three cases). Hypertensive participants took standard hypertension treatment: beta-blockers, calcium channel blockers, ACE-inhibitors and potassium-sparing diuretics. None of the participants used anti-seizure medication, anxiolytics or antidepressants. Persons who suffered or suspected they suffered from claustrophobia were advised not to participate in the study.
Of the 127 subjects who completed the follow-up, 29 (23%) were not included in the data analyses reported here because they no longer met the health screening criteria. The excluded participants ranged in age from 31 to 83 years, and the reasons for exclusion were Parkinson's disease, cerebral hemorrhage, cardiac bypass surgery, angioplasty, hypo- and hyperthyroidism, diabetes mellitus and cancer. The follow-up magnetic resonance imaging (MRI) data on an additional 26 subjects (20%) were either completely lost (four cases) or not suitable for a longitudinal analysis (22 cases that were acquired with a different field of view). Including those cases would have confounded time of measurement with coarser resolution after re-slicing the acquired images. Thus, the final sample consisted of 72 participants (23% of the eligible cohort, 30 men).
All subjects were screened for dementia and depression using a modified Blessed Information-Memory-Concentration Test (BIMC) (Blessed et al., 1968) with a cut-off of 85% correct, Mini-Mental State Examination (MMSE) (Folstein et al., 1975) with a cut-off of 26 (87% correct) and Geriatric Depression Questionnaire (CES-D) (Radloff, 1977) with a cut-off of 15. The BIMC and CES-D were administered on both testing occasions whereas the MMSE was used only at follow-up. All participants were consistent right-handers, as indicated by a score above 75% on the Edinburgh Handedness Questionnaire (Oldfield, 1971). An experienced neuroradiologist (J.D.A.) examined the MR scans for space-occupying lesions and signs of significant cerebrovascular disease. Only 10% of the participants smoked tobacco and 63% exercised at least once a week, regardless of their sex or hypertension status (both χ2 < 1). Some of the participating women (31%) were on hormone replacement therapy (HRT) at the inception of the study.
To estimate the selectivity of the sample, we compared the returnees with the rest of the original sample. The returnees were older than the participants who failed to return for follow-up (52.49 versus 44.82, t = 3.53, P > 0.001) and had somewhat higher vocabulary scores (27.12 versus 24.97, t = 2.15, P < 0.05). However, the returning sample did not differ from the original one in general cognitive status (BIMC = 90% correct), education (15 years) or sex composition (58% women).
The mean ± SD follow-up interval was 5.27 ± 0.30 years, with a range from 4.83 to 6.08 years; it did not differ between the sexes (t < 1). The age of the participants at baseline ranged from 20 to 77 years (mean ± SD = 52.56 ± 14.05 years, 50.33 for men and 54.14 for women, t = 1.07, ns). Average education was 15.90 ± 2.40 years; there was a trend for men to have more formal education than women: 16.46 versus 15.45 years, t = 1.70, P < 0.10. Despite the MMSE cut-off score of 26 to exclude subjects with dementia, only one person (a 33-year-old normotensive woman) scored below the cut-off at follow-up. Most MMSE scores at the time of second scanning were substantially higher than the cut-off (28.86 ± 1.11), and were unrelated to age (r = −0.06, ns) or sex (t = 0.58, ns). The participants who were excluded from the analysis because of the wrong field of view parameter did not differ from those included in the sample in age, education, MMSE or BIMC scores (all t < 1.12, ns).
Twelve participants (four men and eight women) with medically controlled hypertension were also included in the sample at baseline. In addition, six women and one man received diagnoses of hypertension during the follow-up period. Thus, a total of 19 treated hypertensive subjects (14 women) were included. The hypertensive subjects were older than the remainder of the sample (mean age at baseline = 63.79 ± 12.99 years, t = 2.29, P < 0.05), but had the same number of years of formal schooling (t = 0.80, ns) and equivalent MMSE scores (t = −1.59, ns).
MRI Protocol
All imaging was performed on 1.5 T Signa scanners (General Electric Co., Milwaukee, WI) installed in the same hospital. However, whereas only one scanner was used for the baseline data collection, two additional scanners were employed for re-testing four of the subjects at follow-up. One subject was re-scanned on an identical GE Signa scanner located in an adjacent room and three subjects were re-scanned on a mobile 1.5 T GE scanner located at the entrance to the imaging center. The scanners were routinely calibrated using the same standard GE phantom.
At baseline and follow-up all subjects were scanned with identical pulse sequences. Sagittal localizer images with repetition time (TR) = 400 ms, echo time (TE) = 16 ms, one excitation and slice thickness = 5 mm were acquired first. Dual-echo fast spin echo (FSE) T2 and proton-density weighted axial images (TR/TR = 3300/90ef or 18ef, slice thickness = 5 mm, and inter-slice gap = 2.5 mm) were acquired to screen for cerebrovascular disease. Volumes were measured on two sets of images acquired using a T1-weighted 3-D spoiled gradient recalled (SPGR) sequence with 124 contiguous axial slices, TE = 5 ms, TR = 24 ms, square field of view = 22 cm, acquisition matrix = 256 × 192, slice thickness = 1.3 mm and flip angle = 30°.
MR Image Processing
Image processing and regional volume measures are described in detail elsewhere (Raz et al., 2003b,c). The images acquired on both occasions were coded and the order of their tracing was randomized within each subject by a person other than the operators who traced the regions of interest (ROIs). The operators were blind to the time of acquisition of the specific images and the demographic characteristics of the participants, as well as to the scanner on which the images were acquired. To ensure the blindness of the operators, the baseline measurements previously published in cross-sectional studies (Raz et al., 1997, 1998, 2001, 2004b) were not used and all structures were measured anew. Reliability of ROI measures (intraclass correlation for random raters) (Shrout and Fleiss, 1979) exceeded 0.90, as in Raz et al. (2004b).
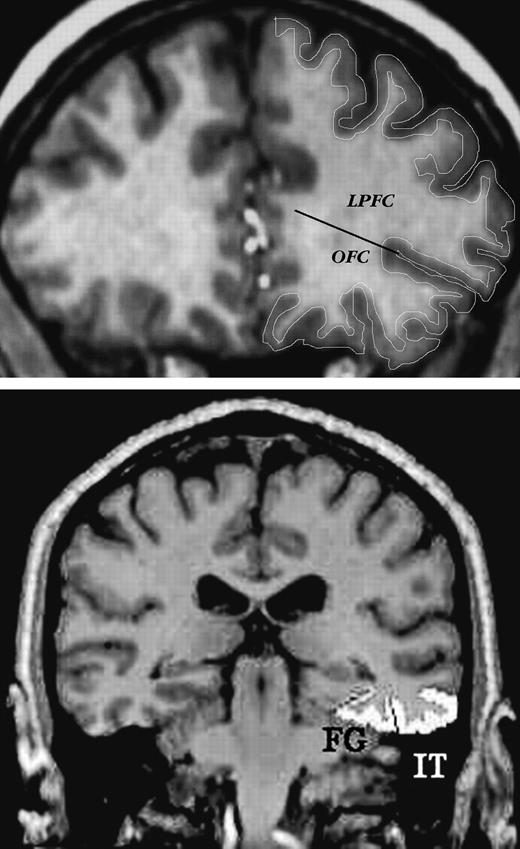
The volumes were computed from measured areas of the ROIs on consecutive slices (for details, see Raz et al. 2004b). The following ROIs were measured: the intracranial vault (ICV), lateral prefrontal cortex (LPFC), orbital frontal cortex (OFC), adjacent prefrontal white matter (PFw), inferior parietal lobule (IPL) and adjacent white matter (IPw), inferior temporal cortex (IT), fusiform cortex (FF), visual (pericalcarine) cortex (VC), hippocampus (HC), entorhinal cortex (EC), striatal nuclei (caudate, Cd) and cerebellar hemispheres (CbH). The illustrations of the traced ROIs are presented in Figures 1–4. Additional images are available in our previous publications (Raz et al., 2001, 2004b,c).
Examples of ROI demarcation on typical slices of MR images. Top panel: lateral prefrontal cortex, and orbito-frontal cortex, with a line indicating separation between the two. Bottom panel: inferior temporal (IT) and fusiform (FG) cortices.
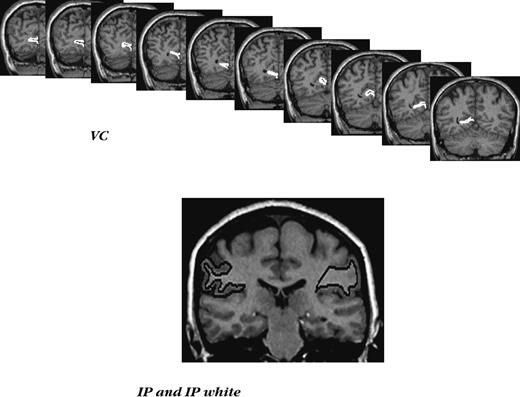
Examples of ROI demarcation in the posterior cortex. Top panel: a series of slices with traced primary visual cortex (VC). Bottom panel: a typical slice with inferior parietal lobule (IP) and inferior parietal white matter (IPw) traced.
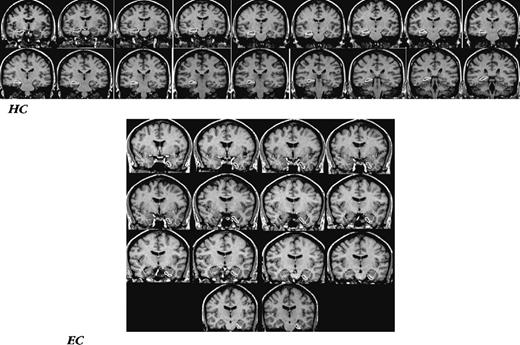
Examples of ROI demarcation in the medial temporal cortex. Top panel: a series of slices with the hippocampus (HC) outlined. Bottom panel: a series of slices with entorhinal cortex outlined.
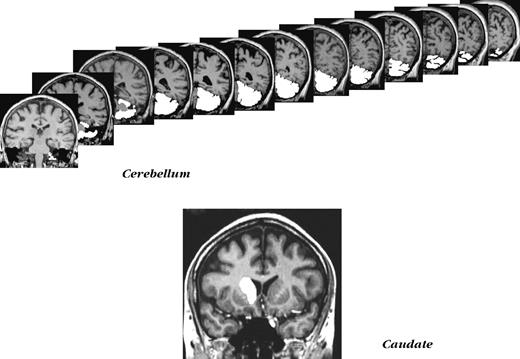
Examples of non-cortical ROIs demarcation. Top panel: a series of slices used in measuring cerebellar volume. Bottom panel: a typical slice with the caudate nucleus outlined.
Data Conditioning
Before conducting the LDM analyses, we examined the data for possible sources of systematic error. The effects of the scanner (scanner 1, scanner 2 and the mobile scanner) on the intracranial volume measured at time 2 were examined using two separate linear models. In these models ICV was the dependent variable, scanner and participant's sex were grouping factors, and age was a continuous independent variable. The results of these analyses demonstrated that changes in scanner occurring between baseline and follow-up did not affect measured intracranial volume, i.e. produced no systematic bias. The mean intracranial volume remained stable across the five-year delay, showing a total mean change of only −0.3% (t < 1, ns).
Intracranial volume differed between the sexes, with men having larger crania [t(70) = 6.82 and 6.85 for baseline and follow-up, both P < 0.001]. It was not, however, correlated with age: r = −0.04 and −0.05 for baseline and follow-up, respectively, both ns. Therefore, ICV was used to adjust the regional volumes for sex differences in body size. The adjustment was performed on each ROI volume in each hemisphere via a formula based on the analysis of covariance approach: adjusted volume = raw volume − b × (ICV − mean ICV), where b is the slope of regression of an ROI volume on ICV. The adjusted volumes were used as dependent variables in the analyses presented below.
Latent Difference Modeling
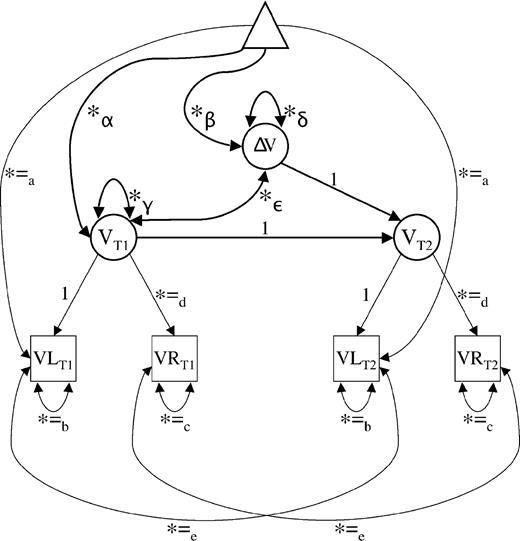
We applied LDM (McArdle and Nesselroade, 1994) to assess mean changes as well as variances and covariances of change in regional volumes. Difference scores based on observed variables are especially vulnerable to the consequences of less than perfect reliability of measurement (Cronbach and Furby, 1970; cf. Rogosa and Willett, 1985; Baltes et al., 1988). LDM circumvents those problems by handling mean change and individual differences (i.e. variance) in change at the level of latent factors (see Fig. 5; cf. McArdle and Nesselroade, 1994). In the present set of LDM analyses, ROIs were defined as latent factors representing the variance common to the two hemisphere of a given ROI and measurement occasion (see Fig. 5). For example, a latent factor of hippocampal volume at baseline (time T1) was estimated by the volume of the left and right hippocampi measured at that occasion. The same was done for follow-up (time T2), and the difference between hippocampal volumes at T1 and T2 was expressed as the difference between T1 and T2 latent factors of the hippocampus. LDM were established for each ROI to compute average change and individual differences in change (i.e. the variance of change). Specifically, at the latent level, five parameters were estimated: (i) mean volume at T1; (ii) mean volume change from T1 to T2; (iii) variance in volume at T1; (iv) variance in volume change from T1 to T2; and (v) the covariance between volume at T1 and change in volume between T1 and T2. In Figure 5, these five latent parameters are designated as α, β, γ, δ and ε, respectively.
Measurement model for the assessment of two-occasion changes in regional brain volume. Squares represent observed variables, circles represent latent variables and the triangle serves to represent information regarding means and intercepts. Free parameters are indicated by an asterisk. Parameters with equal sign and the same subscript are constrained to be equal to each other. T1 = baseline; T2 = follow-up; VL = regional volume of left hemisphere; VR = regional volume of right hemisphere; V = regional latent volume; ΔV = difference in regional volume between first and second occasions; α = latent mean of regional brain volume at first occasion (baseline); β = mean difference between latent regional brain volumes at first and second occasions; γ = variance (individual differences) in latent regional brain volume at first occasion; δ = variance (individual differences) in latent regional brain volume changes between first and second occasions; ε = covariance between individual differences in regional brain volume at first occasion and individual differences in regional brain volume changes. The model has four observed variables, 10 free parameters and four degrees of freedom. For further information on two-occasion latent difference modelling in general, see McArdle and Nesselroade (1994).
To ensure interpretability and identification of the models, the following equality constraints were imposed on the latent difference models: (i) residual means of the left hemisphere across time to accommodate possible time-invariant hemisphere differences in volume; (ii) unique variances of the left hemisphere across time; (iii) unique variances of the right hemisphere across time; (iv) factor loadings of the right hemisphere across time; and (v) autocorrelated residuals of the two hemispheres. To define the metric of latent factors, the factor loading of the left hemispheres were set to unity at both occasions. With four observed variables and 10 free parameters, this measurement model is overidentified with four degrees of freedom, which means that it can be estimated empirically (e.g. Kline, 1998). Tenability of this model is consistent with the assumption of strict metric invariance (Meredith, 1964), which implies that the relation between observed and latent variables does not change over time so that differences at the latent level can be interpreted with confidence. Note also that a mathematically equivalent autoregressive counterpart exists for each two-occasion LDM (McArdle and Nesselroade, 1994).
We first computed univariate LDMs separately for each of the 12 ROIs to examine baseline volume, mean change, variance in change, and associations of initial level and change with linear age, quadratic age, sex and diagnosis of hypertension by the follow-up time. The latter variables were specified as time-invariant covariates measured without error. Then, for the 11 ROIs showing reliable inter-individual differences in change, we specified a single overall multivariate LDM to explore covariance relations across ROIs. To obtain numerically balanced matrices, chronological age and cerebellar volumes were divided by 10.
Results
Descriptive Statistics
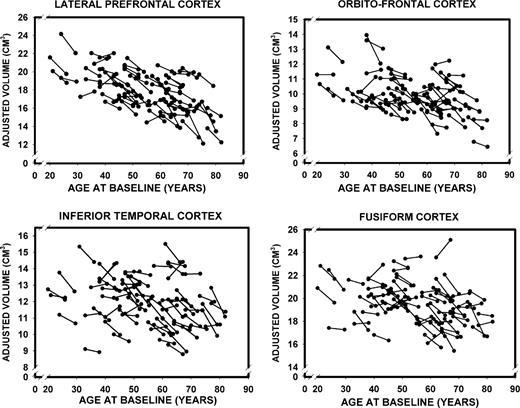
Descriptive statistics for ICV-adjusted regional volumes [mean, SD and coefficient of variation(CV)], as well as their correlations with age at baseline and at the five-year follow-up, are presented in Table 1. Values refer to observed scores averaged over hemispheres. For each ROI and for each scanning occasion, we gauged the strength of association between the adjusted volume and age, as well as the change in volume over time. The coefficients of stability (Pearson correlations between T1 and T2 measures of all ROI volumes) were high, ranging between r = 0.89 for the fusiform cortex to r = 0.97 for the inferior parietal lobule, median r = 0.91. The plots of changes in cortical and subcortical ROI volumes as a function of age are presented in Figures 6–8. The figures show age-related differences in the magnitude and shape of age–volume associations at both measurement occasions, individual differences in change between the occasions and the differences in magnitude and rate of change of the cortical ROIs.
Longitudinal changes in adjusted volumes of the lateral prefrontal, orbito-frontal, inferior temporal and fusiform cortices as a function of baseline age.
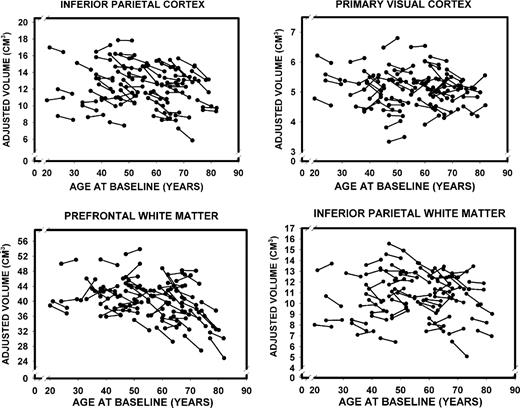
Longitudinal changes in adjusted volumes of the inferior parietal and primary visual (pericalcarine) cortices as well as prefrontal and inferior parietal white matter as a function of baseline age.
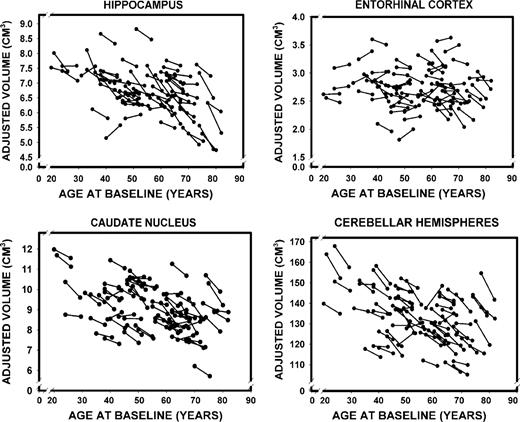
Longitudinal changes in the adjusted volumes of the hippocampus, the entorhinal cortex, the caudate nucleus and the cerebellar hemispheres as a function of baseline age.
Descriptive statistics and age-related differences in regional brain volumes at two measurement occasions
| ROI | Regional volumes | ||||||||||||||
|---|---|---|---|---|---|---|---|---|---|---|---|---|---|---|---|
| T1 | T2 | ||||||||||||||
| Mean | SD | CV | rage | Mean | SD | CV | rage | ||||||||
| LPFC | 9.12 | 1.04 | 0.11 | −0.55*** | 8.69 | 1.12 | 0.13 | −0.59*** | |||||||
| OFC | 5.03 | 0.61 | 0.12 | −0.41** | 4.80 | 0.60 | 0.13 | −0.37* | |||||||
| IT | 6.07 | 0.69 | 0.11 | −0.20 | 5.85 | 0.74 | 0.13 | −0.26 | |||||||
| FF | 9.87 | 0.86 | 0.09 | −0.31 | 9.63 | 0.93 | 0.10 | −0.29 | |||||||
| IPL | 6.31 | 1.23 | 0.20 | −0.08 | 6.03 | 1.20 | 0.20 | −0.13 | |||||||
| VC | 2.56 | 0.31 | 0.12 | −0.11 | 2.54 | 0.29 | 0.12 | −0.10 | |||||||
| PFw | 20.37 | 2.40 | 0.12 | −0.27 | 19.83 | 2.74 | 0.14 | −0.41** | |||||||
| IPw | 5.47 | 1.06 | 0.19 | −0.11 | 5.33 | 1.06 | 0.20 | −0.01 | |||||||
| HC | 3.43 | 0.39 | 0.11 | −0.41** | 3.29 | 0.39 | 0.11 | −0.50*** | |||||||
| EC | 1.38 | 0.18 | 0.12 | −0.01 | 1.35 | 0.18 | 0.13 | −0.12 | |||||||
| Cd | 4.61 | 0.61 | 0.12 | −0.38* | 4.43 | 0.55 | 0.12 | −0.42** | |||||||
| CbH | 67.55 | 6.28 | 0.09 | −0.36* | 65.36 | 5.95 | 0.09 | −0.40** | |||||||
All raw ROI volumes were measured in cm3 and adjusted for intracranial volume. Pearson correlations were two-tailed and Bonferroni-adjusted for multiple comparisons. ROI = region of interest, LPFC = lateral prefrontal cortex, OFC = orbito-frontal cortex, IT = inferior temporal cortex, FF = fusiform cortex, IPL = inferior parietal lobule, VC = primary visual (pericalcarine) cortex, PFw = prefrontal white matter, IPw = inferior parietal white matter, HC = hippocampus, EC = entorhinal cortex, Cd = caudate, CbH = cerebellar hemispheres; CV = coefficient of variation (SD over mean), rage = correlation between volume and age.
P < 0.05;
P < 0.01;
P < 0.001.
To check further the degree of selectivity in the longitudinal sample we compared the magnitude of association with age exhibited by the regions studied in the longitudinal sample among the returnees and participants who did not return. In 65% of the examined ROIs, the association between volume and age was numerically, though not statistically, stronger in the remainder of the sample compared to the returnees, and in none was the reverse observed.
Univariate LDM
Results are summarized in Table 2. Standardized factor loadings of hemispheric indicators on the latent volume factors ranged from 0.88 (fusiform gyrus) to 0.99 (cerebellum), with a mean of 0.92. Also, inspection of the path testing for time-invariant differences in volume between right and left hemispheres indicated that the assumption of equally large hemispheres could not be rejected for any of the regions. By conventional criteria (Kline, 1998), all models, with the exception of those for the IPL and VC, fit the data well. Specifically, for the former 10 models, comparative fit indexes (CFI) were 0.98 or higher, standardized root-mean-square residuals (SRMRs) were <0.05, root-mean-square errors of approximation (RMSEA) were <0.05 and χ2-values did not reach statistical significance (df = 18, χ2 < 19.50, P > 0.36). The VC model was also acceptable, with a CFI of 0.984, SRMRs of 0.026, an RMSEA of 0.064 [90% confidence interval (CI) = 0.000–0.129] and χ2 = 23.05 (df = 18, P = 0.189). In contrast, the IPL model had a CFI of 0.961, SRMRs of 0.029, an RMSEA of 0.119 (90% CI = 0.060–0.173) and χ2 = 35.91 (df = 18, P = 0.007). Thus, by some of the conventional criteria (e.g. RMSEA), the strong assumption of strict metric invariance of latent brain volume factors at T1 and T2 could not be rejected for any of the models, except the IPL. Therefore, latent differences for all ROIs except IPL can be interpreted with confidence.
Estimates of mean brain shrinkage: cross-sectional annual percent change, longitudinal annual percent change, and mean latent five-year changes
| ROI | Annual percent change (APC) | Mean latent five-year changes | ||||||||
|---|---|---|---|---|---|---|---|---|---|---|
| Cross–sectional regression estimates | Observed longitudinal change ± SEM | Mean changes in cm3 | t-value | Effect size d ± SE | ||||||
| T1 | T2 | |||||||||
| LPFC | 0.39 | 0.45 | 0.91 ± 0.12* | −0.83 | −7.82 | 0.92 ± 0.17 | ||||
| OFC | 0.31 | 0.31 | 0.85 ± 0.12* | −0.45 | −6.85 | 0.79 ± 0.18 | ||||
| IT | 0.16 | 0.23 | 0.69 ± 0.11* | −0.42 | −5.56 | 0.65 ± 0.16 | ||||
| FF | 0.18 | 0.19 | 0.48 ± 0.10* | −0.48 | −4.75 | 0.55 ± 0.16 | ||||
| IPL | 0.11 | 0.19 | 0.87 ± 0.12* | −0.64 | −7.66 | 0.89 ± 0.17 | ||||
| VC | 0.08 | 0.08 | 0.10 ± 0.12 | −0.05 | −1.51 | 0.18 ± 0.16 | ||||
| PFw | 0.21 | 0.35 | 0.52 ± 0.14 | −1.07 | −3.89 | 0.45 ± 0.16 | ||||
| IPw | 0.01 | 0.02 | 0.46 ± 0.15* | −0.28 | −3.29 | 0.38 ± 0.17 | ||||
| HC | 0.28 | 0.35 | 0.79 ± 0.10* | −0.29 | −7.93 | 0.92 ± 0.17 | ||||
| EC | 0.08 | 0.11 | 0.32 ± 0.12 | −0.04 | −2.68 | 0.31 ± 0.16 | ||||
| Cd | 0.30 | 0.32 | 0.75 ± 0.08* | −0.37 | −9.11 | 1.06 ± 0.17 | ||||
| CbH | 0.22 | 0.24 | 0.61 ± 0.07* | −4.43 | −9.17 | 1.07 ± 0.17 | ||||
APC and d are presented with ±SEM. Mean latent changes refer to differences in latent bilateral volume between T1 and T2. ROI = region of interest, LPFC = lateral prefrontal cortex, OFC = orbito-frontal cortex, IT = inferior temporal cortex, FF = fusiform cortex, IPL = inferior parietal lobule, VC = primary visual (pericalcarine) cortex, PFw = prefrontal white matter, IPw = inferior parietal white matter, HC = hippocampus, EC = entorhinal cortex, Cd = caudate, CbH = cerebellar hemispheres. APC was calculated as the difference between the estimates at T2 and T1, divided by the estimate at T1, multiplied by 100, and divided by the delay duration. *>2 SEM greater than cross-sectional estimate. Except for VC, t-values for mean latent changes were significant at P < 0.05 or below.
Five-year changes in mean volumes of all examined regions except the primary visual cortex were negative and statistically significant. The magnitude of five-year decline (effect size, d) (Hedges and Olkin, 1985) expressed in standard deviation units is presented in Table 2, along with the annualized percent change (APC) observed longitudinally and the APC estimated from regression equations at each measurement occasion. The greatest change was observed not in the cortical regions but in the caudate and cerebellum (d = 1.06 and 1.07, respectively), and the smallest magnitude of average shrinkage was found in the primary visual cortex (d = 0.18). The tertiary association cortices (prefrontal and inferior parietal) and the hippocampus showed a similar degree of decline, which was greater than that of the fusiform and the entorhinal cortices.
Despite the high degree of relative stability reported above, all areas except the inferior parietal lobule showed statistically reliable individual differences in change. The effect size estimates for mean changes was on average greater than that for individual variances in change (median d = 0.72 versus d = 0.38) and the two effects were uncorrelated across the 11 regions (Spearman ρ = −0.03, ns). In other words, the mean regional differences in shrinkage and variability in individual trajectories of change describe two independent aspects of the data. The cerebellum showed the greatest variance in change, but there was no clear difference among the tertiary cortices and the other regions of the neocortex, including the primary visual.
Whereas only linear age trends appear in Tables 2 and 3, nonlinear trends were suggested by visual inspection of some of the distributions in Figures 6–8. Therefore we formally tested this impression by including quadratic trends in follow-up LDMs, and by inferring nonlinearity from associations between change and age.
Variances in latent change of the regional volumes after 5 years
| ROI | Variance of change in cm3 | t-value | Effect size d | 95% CI of d |
|---|---|---|---|---|
| LPFC | 0.22 | 3.23 | 0.38 | 0.05 to 0.70 |
| OFC | 0.09 | 3.17 | 0.38 | 0.05 to 0.70 |
| IT | 0.13 | 3.56 | 0.40 | 0.07 to 0.73 |
| FF | 0.24 | 3.74 | 0.43 | 0.11 to 0.77 |
| IPL | 0.06 | 1.18 | 0.11 | −0.21 to 0.43 |
| VC | 0.02 | 3.40 | 0.40 | 0.07 to 0.73 |
| PFw | 2.29 | 4.93 | 0.57 | 0.24 to 0.91 |
| IPw | 0.12 | 2.32 | 0.28 | −0.05 to 0.60 |
| HC | 0.02 | 2.92 | 0.34 | 0.01 to 0.67 |
| EC | 0.005 | 2.93 | 0.34 | 0.01 to 0.67 |
| Cd | 0.03 | 2.49 | 0.29 | −0.03 to 0.62 |
| CbH | 7.50 | 5.84 | 0.62 | 0.29 to 0.96 |
Variances in change refer to individual differences in latent bilateral volume change between T1 and T2. ROI = region of interest, LPFC = lateral prefrontal cortex, OFC = orbito-frontal cortex, IT = inferior temporal cortex, FF = fusiform cortex, IPL = inferior parietal lobule, VC = primary visual (pericalcarine) cortex, PFw = prefrontal white matter, IPw = inferior parietal white matter, HC = hippocampus, EC = entorhinal cortex, Cd = caudate, CbH = cerebellar hemispheres. Except for IPL, t-values for variances in latent change were significant at P < 0.05 or below.
Cross-sectional analyses revealed nonlinearities in associations between age and adjusted volumes in some ROIs at baseline and follow-up. At baseline, quadratic age trends were observed in the cerebellum (LDM, r = 0.28, P < 0.05), and the inferior parietal white matter (r = −0.25, P < 0.05). Whereas the link between age and the volume of cerebellar hemispheres weakened with age, the opposite tendency was observed in the IPw volume, in which age-related differences increased with age. A nonsignificant trend toward age-dependent increase in age differences was observed in the PFw volume (r = −0.21, P < 0.10). At follow-up, adjusted PFw and IPw volumes displayed significant quadratic trends (r = −0.28 and r = −0.25, both P < 0.05), reinforcing the impression created at baseline measurement. In contrast, the nonlinearity in cerebellar age differences observed at baseline disappeared at follow-up.
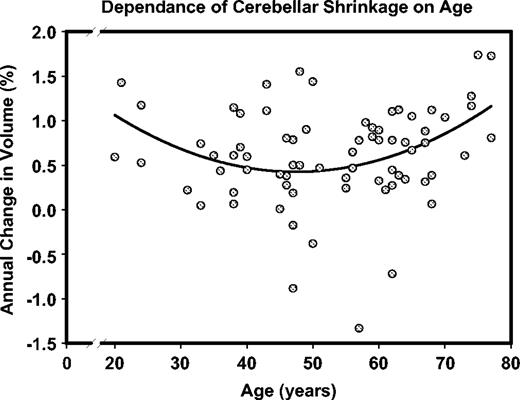
Significant incremental negative change with age was found in the prefrontal white matter, the inferior temporal cortex, the hippocampus, and the entorhinal cortices (see Table 4). In the listed regions, older adults show greater negative longitudinal change (i.e. shrinkage) than their younger peers. In addition, similar (though nonsignificant) trends towards age-related increase in shrinkage were noted in the lateral prefrontal and the inferior parietal cortices. Finally, an association between change and quadratic age was found for the hippocampus (r = −0.36, P < 0.05) and the cerebellum (r = −0.40, P < 0.05), indicating a particularly pronounced increase in longitudinal shrinkage with advancing age. That is, older participants showed a greater increase in the rate of change than their younger peers. Inspection of Figures 6–8 suggests that when age-related acceleration of shrinkage is observed, it starts in the mid-50s. The relationship between age and the rate of the cerebellar shrinkage is illustrated in the Figure 9.
A nonlinear trend in age-related shrinkage of the cerebellar hemispheres. Note that in this trend decline in volume reduction with age is observed among younger participants, whereas older individuals show a significant age-related increase in shrinkage rate. In this inverted U-curve, acceleration and deceleration at the opposite ends of the age range cancel each other, resulting in the absence of a significant linear component. Note that larger numbers on the ordinate represent greater shrinkage.
Univariate effects of age, sex and hypertension on adjusted brain volumes at baseline assessment (T1) and five-year change (CH)
| ROI | Effect | ||||||
|---|---|---|---|---|---|---|---|
| Age | Hypertension | Age × hypertension | Age × sex | ||||
| LPFC T1 | −0.58*** | −0.21 | 0.06 | 0.05 | |||
| Change | −0.27 | −0.01 | −0.11 | −0.31 | |||
| OFC T1 | −0.42** | 0.02 | −0.10 | 0.05 | |||
| Change | 0.04 | −0.35* | 0.10 | −0.19 | |||
| IT T1 | −0.21 | −0.03 | −0.06 | 0.05 | |||
| Change | −0.30 | −0.23 | 0.04 | −0.24 | |||
| FF T1 | −0.33* | −0.20 | 0.10 | −0.03 | |||
| Change | −0.01 | 0.03 | −0.07 | −0.25 | |||
| IPL T1 | −0.07 | −0.00 | −0.01 | −0.01 | |||
| Change | −0.46 | −0.03 | −0.41 | −0.23 | |||
| VC T1 | −0.11 | −0.04 | −0.19 | −0.01 | |||
| Change | 0.06 | −0.19 | 0.17 | −0.11 | |||
| PFw T1 | −0.28* | −0.08 | −0.09 | −0.04 | |||
| Change | −0.42** | −0.25 | −0.17 | −0.16 | |||
| IPw T1 | 0.01 | 0.05 | −0.05 | −0.03 | |||
| Change | −0.11 | 0.29 | −0.13 | −0.07 | |||
| HC T1 | −0.43** | −0.23 | 0.17 | 0.01 | |||
| Change | −0.36* | −0.10 | −0.35* | −0.11 | |||
| EC T1 | −0.01 | −0.15 | 0.09 | −0.13 | |||
| Change | −0.39* | −0.08 | 0.07 | 0.08 | |||
| Cd T1 | −0.38** | −0.11 | 0.09 | 0.25 | |||
| Change | −0.11 | −0.20 | −0.30 | −0.45* | |||
| CbH T1 | −0.36** | −0.12 | 0.11 | −0.06 | |||
| Change | −0.07 | −0.10 | −0.07 | −0.16 | |||
Effects for age, age × hypertension and age × sex are Pearson correlations, and effects for hypertension are point-biserial correlations (0 = normotensive, 1 = hypertensive). Abbreviations: T1 = baseline, ROI = region of interest, LPFC = lateral prefrontal cortex, OFC = orbito-frontal cortex, IT = inferior temporal cortex, FF = fusiform cortex, IPL = inferior parietal lobule, VC = primary visual (pericalcarine) cortex, PFw = prefrontal white matter, IPw = inferior parietal white matter, HC = hippocampus, EC = entorhinal cortex, Cd = caudate, CbH = cerebellar hemispheres.
P < 0.05;
P < 0.01;
P < 0.001.
Associations of sex and hypertension diagnosis with brain volumes and their shrinkage are also displayed in Table 4. No main effects of sex were noted. However, a significant age × sex interaction for caudate volume change was observed (r = −0.45, P < 0.01). To decompose that interaction, we examined simple correlational effects, which are based on observed rather than latent scores, because sample sizes were too small for subsidiary LDM analyses. The magnitude of change in the caudate increased with age in women (correlation with age: r = −0.35, P < 0.05) but not in men (r = 0.12, ns).
The main effects of hypertension were found only in the OFC: greater shrinkage of OFC was observed in hypertensive participants, r = −0.35, P < 0.05. We noted two trends, one suggesting the association between hypertension and reduced HC volume at baseline (r = −0.23, P = 0.07) and another pointing to a possible link between the decline in prefrontal white matter volume and hypertension (r = −0.25, P = 0.06). Furthermore, the change in HC volume was significantly associated with the linear age × hypertension interaction (r = −0.35, P < 0.05) and with the quadratic age × hypertension interaction (r = −0.33, P < 0.05). The change in cerebellar volume was not associated with the quadratic age × hypertension interaction (r = 0.04, ns).
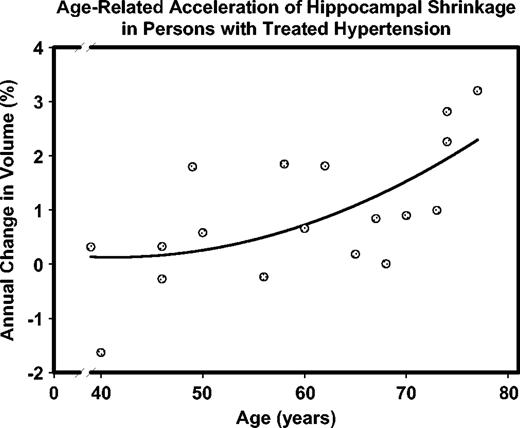
The significant interactions reflect the differences in regression of HC change on age in normotensive and hypertensive participants. Specifically, the slope of regression for the hypertensive participants (−0.0542 ± 0.0175%/year) was significantly steeper than that for the normotensives (−0.0113 ± 0.0070%/year). The latter did not significantly differ from zero. The respective correlations (standardized slopes) were r = −0.60, P < 0.01 for the hypertensives and r = −0.22, ns for the normotensives. Thus, age-related increase in shrinkage was limited to persons who had hypertension diagnosed and treated before the follow-up assessment. The acceleration of age-related increase in shrinkage with age was also restricted to hypertensive participants. Specifically, the slope of HC change on the unique quadratic age term was −0.7023 ± 0.2296 in the hypertensives and −0.1121 ± 0.0985 in normotensives, with the corresponding correlations of r = −0.60, P < 0.01 and r = −0.16, ns. The difference in slopes exceeded two standard errors, confirming the significance of the differences between the groups. The accelerating increase of HC shrinkage with advancing age among hypertensive participants is illustrated in Figure 10.
Accelerated age-related increase in hippocampal shrinkage observed in the participants who were diagnosed with hypertension and received treatment. Note that larger numbers on the ordinate represent greater shrinkage.
We tested the hypothesis that having larger brain volumes at baseline may ameliorate longitudinal brain shrinkage. Of the 12 examined ROIs, only two evidence significant though relatively small correlations between the initial level and the magnitude of change, and it was in the direction opposite to the predicted, i.e. smaller initial volumes were associated with lesser decline: r = −0.35 for VC and −0.32 for the cerebellum.
We inquired whether there were any changes in general cognitive status and if there were, whether they related to regional shrinkage. No consistent declines in gross cognitive functioning level (as measured by the BIMC test: t = 0.41, ns) were observed in this sample, and there were no associations between BIMC change scores and any of the regional difference scores, with correlations ranging from r = −0.22 to 0.21, median r = −0.08, all ns.
Finally, we examined whether higher levels of educational attainment were associated with reduced brain shrinkage. In this sample, we found no support for that proposition as the correlations between the rates of decline and the number of years of formal education ranged from r = −0.20 to 0.19, median r = 0.06, all ns.
Multivariate LDM
The inferior parietal region was excluded from the multivariate model because its variance of change did not reliably differ from zero so that covariances in change were not interpretable (see also Lindenberger and Ghisletta, 2004). The fit for the resulting multivariate model with eleven regions was marginal (χ2 = 1142.382, df = 704, CFI = 0.910, SRMR = 0.043, RMSEA = 0.095, 90% CI = 0.083–0.103). However, the parameter estimates of the multivariate model closely matched those that were obtainable in the 11 univariate models, and inspection of residuals did not yield any indication of a local lack of fit.
Of the 55 correlations referring to individual differences in brain volumes at baseline, 23 were reliably different from zero (P < 0.05, two-tailed), all in the positive direction (see Table 5, values above the main diagonal). Thus, perhaps not surprisingly, and analogous to classical findings in psychometric research on intellectual abilities, individual differences in regional brain volumes formed a ‘positive manifold’ of correlations (cf. Spearman, 1904). Of the 55 change correlations, 13 were reliable; again all in the positive direction (see Table 5, values below the main diagonal). The strongest correlations in change were found between fusiform gyrus and inferior temporal (r = 0.77), lateral prefrontal cortex and frontal white matter (r = 0.71), cerebellum and fusiform gyrus (r = 0.60), caudate and orbito-frontal cortex (r = 0.58), lateral prefrontal cortex and cerebellum (r = 0.54), visual cortex and orbito-frontal cortex (r = 0.53), and cerebellum and inferior temporal (r = 0.51). Finally, of the 121 level × change correlations, only four differed reliably from zero, two in each direction, confirming the lack of association between brain volume at baseline and the change within each region.
Regional brain volumes: correlations at first occasion and correlations of five-year changes
| ROI | LPFC | OFC | IT | FF | VC | PFw | Ipw | HC | EC | Cd | CbH |
|---|---|---|---|---|---|---|---|---|---|---|---|
| LPFC | − | 0.66*** | 0.10 | 0.48** | 0.00 | 0.74*** | −0.27 | 0.34* | 0.17 | 0.33* | 0.49*** |
| OFC | 0.38 | − | 0.24 | 0.33* | 0.07 | 0.60*** | −0.03 | 0.24 | −0.11 | 0.17 | 0.25 |
| IT | 0.22 | 0.36 | − | 0.75*** | 0.30* | 0.20 | 0.51*** | 0.31* | −0.04 | 0.31* | 0.29* |
| FF | 0.35 | 0.21 | 0.77*** | − | 0.20 | 0.53*** | 0.44** | 0.41** | 0.08 | 0.40** | 0.38** |
| VC | 0.35 | 0.53* | 0.32 | 0.45* | − | 0.20 | 0.25 | 0.23 | −0.18 | 0.05 | 0.10 |
| PFw | 0.71*** | 0.23 | 0.08 | 0.21 | 0.01 | − | −0.06 | 0.16 | 0.11 | 0.01 | 0.25 |
| Ipw | 07 | −0.01 | 0.04 | 0.09 | 0.26 | 0.13 | − | 0.26 | −0.16 | 0.07 | 0.03 |
| HC | 0.34 | −0.03 | 0.17 | 0.17 | −0.17 | 0.70*** | 0.12 | − | 0.32* | 0.40** | 0.35* |
| EC | 0.43* | 0.02 | −0.13 | 0.01 | 0.13 | 0.30 | −0.11 | 0.22 | − | 0.09 | 0.18 |
| Cd | 0.35 | 0.58* | 0.49* | 0.23 | 0.03 | 0.23 | 0.05 | −0.01 | 0.03 | − | 0.31* |
| CbH | 0.54** | 0.32 | 0.51** | 0.60*** | 0.31 | 0.35* | −0.05 | 0.35* | 0.26 | 0.15 | − |
Correlations referring to individual differences in regional brain volume at first measurement occasion are shown above the main diagonal, whereas correlations referring to individual differences in five-year regional brain volume changes are shown below the main diagonal. Values are based on latent factors obtained in a multivariate two-occasion latent difference score model. The inferior parietal lobule was not included in the model because this region did not show reliable variance in change. ROI = region of interest, LPFC = lateral prefrontal cortex, OFC = orbito-frontal cortex, IT = inferior temporal cortex, FF = fusiform cortex, VC = primary visual (pericalcarine) cortex, PFw = prefrontal white matter, IPw = inferior parietal white matter, HC = hippocampus, EC = entorhinal cortex, Cd = caudate, CbH = cerebellar hemispheres.
P < 0.05;
P < 0.01;
P < 0.001.
Discussion
This study produced two major findings. First, in healthy adults, longitudinal changes in brain volume are not uniform. Although brain shrinkage is widespread, its magnitude varies across regions. The greatest mean shrinkage was observed in the caudate and the cerebellum, with comparable rates in the hippocampus and tertiary association cortices, and significantly smaller contraction of the fusiform (secondary association) cortex. The mean entorhinal shrinkage was minimal, and the primary visual cortex volume was stable. Second, longitudinal changes in brain volume during adulthood vary across individuals. In selected healthy volunteers, reliable individual differences in change were found in all measured regions except the inferior parietal lobule. The differences were especially pronounced in the cerebellum, prefrontal white matter, fusiform gyrus, visual cortex and inferior temporal cortex.
In some regions, especially the hippocampus and the prefrontal white matter, shrinkage increased with age. Late-onset age-related increase in shrinkage was observed in the entorhinal cortex, a region that showed no shrinkage in the younger and the middle-age part of the sample. Moreover, hippocampal and cerebellar shrinkage increase accelerated with age, indicating that the oldest participants experienced particularly pronounced shrinkage.
Age-related increases in the rate of decline are consistent with the notion of nonlinear regional brain aging. Such increases confirm the cross-sectional findings that suggested an inverted-U trajectory of lifespan change, with volume increase in young adulthood, plateau in middle age and precipitous decline in the old age (Courchesne et al., 2000; Bartzokis et al., 2001; Jernigan et al., 2001; Jernigan and Fennema-Notestine, 2004; Raz et al., 2004b). The mid-fifties appear as a likely point of inflection of age trend, with sizeable variation across individuals. Nonlinear shrinkage is consistent with age-related augmentation of age differences in other indices of white matter integrity, e.g. MRI relaxation times (Bartzokis et al., 2003, Bartzokis 2004) or the ratio of small to large myelinated axons (Tang et al., 1997). Thus, it is plausible that the regions that are late to mature and contain more thin myelinated fibers are exceedingly vulnerable to age-related declines (Raz, 2000; Bartzokis et al., 2004; Head et al., 2004). These findings underscore the importance of sampling a wide range of ages in future studies of the aging brain. With a restricted age range, important nonlinear trends would be missed.
The nonlinearity of brain aging trajectories may stem from multiple factors. However, in this sample, one such factor was identified. In at least one region — the hippocampus — both age-related increase and acceleration of shrinkage were limited to participants who have received diagnosis of hypertension. Thus, if we assume that the age of onset of hypertension was unrelated to calendar age at the time of brain assessment, the effects of hypertension on HC volume shrinkage appear cumulative and progressive. First, the association of HC volume shrinkage with the linear age × hypertension interaction suggests that not age per se, but years spent living with hypertension, bring about the link between age and the magnitude of shrinkage. Second, the association of HC shrinkage with the quadratic age × hypertension interaction suggests that the effects of hypertension are not only cumulative but also progressive. In other words, the negative effects of exposure to additional years of hypertension increase with years of prior exposure. In the prefrontal white matter and the orbitofrontal cortex, the effects of hypertension may be more direct and additive to the effects of age. By any account, however, the effects of treated hypertension appear restricted to specific regions. The sources of such regional vulnerability are unclear and merit further exploration.
Additional caution is in order. Hypertension results from and is associated with multiple physiological, pathological and behavioral factors. Although we took care to exclude participants who have been diagnosed with potentially confounding vascular disease, we could not take into account all the important vascular risk factors such as stress levels and history, as well as subclinical variations in glucose homeostasis or lipid metabolism. Thus, all the unknown but relevant influences that could be confounded with hypertension were by default included in the error term. Consequently, we have to treat our finding pertaining to hypertension as the effect of vascular health rather than hypertension specifically on brain aging.
Although the effects of aging and its modifiers on the brain exhibit specific regional predilections, total independence of brain regions is unlikely. At baseline, a variable degree of association among regions was observed (upper Table 5). Some of the relatively high correlations (e.g. between prefrontal gray and white or inferior temporal and fusiform) may stem from proximity of the regions that were measured on an identical set of brain slices. Operator-related, equipment-related and image-related factors common to all measures obtained from the same slice, but unspecified in the model could produce high correlations among the measures. Other associations invite further scrutiny. For example, the findings that baseline LPFC, caudate and cerebellar volumes positively correlated with more than half of the other regional volumes may reflect a commonality of developmental factors. Although fewer inter-regional associations were observed for longitudinal change (Table 5, bottom), the links between decline in the prefrontal cortex and adjacent white matter, between the fusiform and inferior temporal cortices, and between all of the above and the cerebellar volume were relatively strong. The correlation between the shrinkage of the hippocampus and the prefrontal white matter and the observed effects of hypertension on both ROIs suggest that common pathological processes may contribute to their precipitous decline in old age. Besides vascular risk factors, there may be a variety of neurochemical changes that are yet to be explored in the context of structural brain shrinkage.
The course of brain aging is predicated on multiple factors that are expressed to varying degrees in each individual. Some of those factors may be genetic, such as apolipoprotein E 4/4 genotype (ApoE-ϵ4), which has known negative effects on the brain (Moffat et al., 2000) but was not evaluated in this sample. However, a single genetic factor may explain only some of the associations among the regions because the development and morphogenesis of distinct neocortical regions are autonomous processes that are controlled by multiple independent genes (Piao et al., 2004). Our results show that even mild pathology (hypertension) can introduce individual differences in the trajectories of brain aging. In contrast to the multiple variables that affect brain aging, an individual's sex does not play a significant role in brain aging according to the results of this study (except one isolated finding for the caudate nucleus).
Substantial cognitive declines in persons without dementia are associated with neuroanatomical declines in the regions examined in this study, especially the prefrontal, posterior parietal and medio-temporal cortices (e.g. Tisserand et al., 2004). However, in this sample, we observed no significant drop in global cognitive performance (at least as crudely measured by BIMC scores), nor was there any association between change in global mental status and regional shrinkage. Thus, the observed pattern of differential brain aging cannot be attributed to inclusion of individuals with gross cognitive dysfunction in the sample.
We found no support for the brain reserve hypothesis. Having a bigger brain at baseline did not stave off age-related atrophy. In addition, we observed no link between the level of global indices of cognitive function (BIMC scores at both occasions and MMSE at follow-up) and regional shrinkage rates. That statement needs to be qualified by the fact that in this selected healthy sample, the range of global cognitive indices was extremely narrow, and associations between more refined behavioral measures and cortical changes need to be analyzed simultaneously to clarify the question of brain reserve.
The fundamental issue of the neurobiological underpinnings of the observed pattern of brain shrinkage remains unresolved. What complicates the interpretation is that the longitudinal change in adults appears an extension of the processes observed in children and adolescents (Giedd et al., 1999). When the trajectories of volumetric changes from childhood through adolescence are viewed together with the adult aging trajectories, linear decline in neocortical (especially association cortices) volume and U-shaped trajectory of the white matter volume become apparent. It is highly improbable that the same biological phenomena underlie the MRI derived changes across the life-span. The superficial similarity of the volume-age curves may be belied by a wide variety of neuroanatomical and neuropathological changes. For example, volume reduction in adolescent prefrontal cortex may be driven by experience-related pruning of dendritic arbor and elimination of excessive neurons (Johnston et al., 2001), whereas the comparable volume loss in older adults may be inflicted by shrinkage and loss of neurons in specific sub-regions and laminae (Haug et al., 1984; Kril et al., 2004), loss of intralaminar myelin (Courchesne et al., 2000), loss of dendritic arborization (Jacobs et al., 1997) or other factors. Although some clues are provided by post-mortem findings in AD patients that show correlation between reduced HC volume and neurodegeneration stages (Gosche et al., 2002; Jack et al., 2002) or total number of neurons (Kril et al., 2004), the clear picture of neurobiological meaning of regional brain shrinkage will emerge only from systematic longitudinal studies that would apply both neuroimaging and histological tools to a suitable animal model.
Assessment of vulnerability to aging depends on what index of change is used. Two types of discrepancy among indices of decline are apparent (Table 2): inconsistency in the rank-order of shrinkage magnitude between APC and d, and underestimation of the shrinkage rate by APC derived from cross-sectional data. The main reason for the APC versus d discrepancy is that APC ignores variability and confounds measurement error with change, whereas the latent score d is error-free and takes variability into account. Thus, shrinkage estimates reported in the literature as APC may be misleading, and d is a more appropriate metric for gauging longitudinal change. In almost all regions, longitudinal measures of shrinkage exceeded the cross-sectional estimates: median APCs of 0.65 % (longitudinal) versus 0.22% (cross-sectional). In cross-sectional analyses, the ‘signal’ of intra-person changes is immersed into the ‘noise’ of age-independent individual differences. In longitudinal analyses, age effects are evaluated within individuals, thereby excluding the contribution of age-independent individual differences to estimates of change.
The most extreme example of underestimation is the inferior parietal lobule, with lack of age differences within occasions and robust longitudinal declines. Notably, the parietal volumes showed the greatest individual variability, with the coefficient of variation of 0.20 at baseline and 0.21 at follow-up (two SDs above the ROIs' mean of 0.13). The IPL was the only region with no individual differences in change. Thus, pre-existing individual differences in the IPL were probably imported into the examined period and not produced during the follow-up. The underestimation of shrinkage by regression-based estimates may reflect the error term augmentation by individual differences from the sources unaccounted by the model. In contrast, when individual differences were controlled in the longitudinal comparison of latent scores, a robust effect was revealed in the IP white matter.
In the field of cognitive aging, greater sensitivity of longitudinal designs to detect intra-person change often is countered by opposing influences. Cross-sectional studies have been shown to overestimate age-related change due to cohort effects and inclusion of people with pre-clinical dementia (Sliwinski and Buschke, 1999). At the same time, longitudinal studies tend to underestimate population change because of non-random attrition and retest effects (Lindenberger et al., 2002). With respect to brain volumes, the results of this study suggest that average longitudinal declines are sufficiently pronounced to outweigh such attenuating influences if they exist.
The generalizability of our findings is conditioned by the desire to examine brain change in successful aging (the best case scenario). Nevertheless, despite the efforts to select healthy participants at both measurement occasions, the observed pattern of brain aging may not represent a normal physiological course. Vascular risk factors (e.g. hypertension) act as negative modifiers of brain aging and target the prefrontal regions and the hippocampus. As in cross-sectional studies (Raz et al., 2003a), effects of hypertension were observed in age-sensitive regions, thus suggesting that age-related modifiers may contaminate the picture of ‘normal’ brain aging.
Longitudinal imaging studies posit several challenges to stability of measurements. First, changes in hardware and software may differentially affect the measures at two occasions. Although in 94% of cases we acquired both scans on the same scanner, some inevitable routine upgrades occurred. These changes, however, are unlikely to bias our findings because even major alterations of gradient hardware on a similar scanner do not affect repeated images (Gunter et al., 2003). Change in head position is another source of error. We controlled alterations in head positioning by aligning the brains according to robust and stable neuroanatomical landmarks. Visual inspection of the images and ranking of the severity in head position change from none (0, n = 28), to some (1, n = 34), to significant (2, n = 10) revealed neither a main effect of position change on rates of decline (F < 1), nor position change × region interaction: F(12,414) = 1.52, P = 0.13, ns. The third potential contribution to non-biological inter-scan variability is operator differences and within-operator unreliability. We minimized systematic operator bias by dividing the stack of slices for each ROI between two operators at random, and attained reliability of 0.90–0.97, with a median of 0.95, for all ROIs, regardless of size (Raz et al., 2004b). Finally, intracranial vault measures revealed no longitudinal drift, implying no bias in image parameters.
In addition to substantive findings, this study makes a methodological contribution by introducing a new way of analyzing lifespan brain changes. In the two-occasion LDM (McArdle and Nesselroade, 1994), the hemispheric measures proved to be excellent indicators of latent brain volume. With the possible exception of the inferior parietal lobules, the hemispheric volumes were truly congeneric, equivalent measures identifying metrically invariant brain volume factors for multiple regions. Indicators of such outstanding psychometric quality are extremely rare in behavioral assessment. The corresponding measurement model (Fig. 5) can serve as a template for future two-occasion analyses. Future investigations of brain changes and their relations to simultaneously assessed cognitive changes in larger longitudinal samples will further benefit from this approach by sampling more than two longitudinal occasions, allowing testing of hypotheses about temporal relations (lead versus lag) among the variables as illustrated in a recent study of a global CT-based brain index and cognition (McArdle et al., 2004).
In sum, the brain shrinks with age even in reasonably healthy adults who showed no gross cognitive declines. It remains to be seen whether cognitive measures that are more sensitive to the negative consequences of brain aging, such as measures of fluid intelligence, will show mean longitudinal change, variance of change and correlations with regional changes in brain volume. The pace of shrinkage exceeds the predictions of cross-sectional studies, varies across regions and, in some regions, increases linearly or even nonlinearly with age. Individual differences in the magnitude and variability of change are significant and in certain critical regions are augmented (or, to a significant degree, determined) by vascular risk factors. Because such factors are malleable, bringing them under control may bode well for slowing of age-related declines in some critical brain regions.
This study was supported in part by National Institute of Health grant AG-11230. We thank Yvonne Brehmer, Thomas Grandy, and Michael Minge for help in data analysis.
References
Alexander GE, DeLong M, Strick, PL (
Baltes PB, Reese HW, Nesselroade JR (
Bartzokis G (
Bartzokis G, Beckson M, Lu PH, Nuechterlein KH, Edwards N, Mintz J (
Bartzokis, G, Cummings JL, Sultzer D, Henderson VW, Nuechterlein KH, Mintz J (
Bartzokis G, Sultzer D, Lu PH, Nuechterlein KH, Mintz J, Cummings JL (
Blessed G, Tomlinson BE, Roth M (
Coffey CE, Lucke JF, Saxton JA, Ratcliff G, Unitas L, Billig B, Bryan RN (
Courchesne E, Chisum HJ, Townsend J, Cowles A, Covington J, Egaas B, Harwood M, Hind S, Press GA (
Folstein MF, Folstein SE, McHugh PR (
Giedd JN, Blumenthal J, Jeffries NO, Castellanos X, Liu H, Zijdenbos A, Paus T, Evans AC, Rapoport JL (
Gosche KM, Mortimer JA, Smith CD, Markesbery WR, Snowdon DA (
Gunter JL, Shiung MM, Manduca A, Jack CR (
Haug H, Kuhl S, Mecke E, Sass NL, Wasner K. (
Head D, Buckner RL, Shimony JS, Williams LE, Akbudak E, Conturo TE, McAvoy M, Morris JC, Snyder AZ (
Hedden T, Gabrieli JD (
Jack CR, Dickson DW, Parisi JE, Xu YC, Cha RH, O'Brien PC, Edland SD, Smith GE, Boeve BF, Tangalos EG, Kokmen E, Petersen RC (
Jacobs B, Driscoll L, Schall M (
Jernigan TL Archibald SL, Fenema-Notestine C, Gamst AC Stout JC, Bonner J, Hesselink JR (
Johnston MV, Nishimura A, Harum K, Pekar J, Blue ME (
Kramer AF, Bherer L, Colcombe SJ, Dong W, Greenough WT (
Kril JJ, Hodges J, Halliday G (
Lindenberger U, Ghisletta P (
Lindenberger U, Singer T, Baltes PB (
McArdle JJ, Nesselroade JR (
McArdle JJ, Hamagami F, Jones K, Jolesz F, Kikinis R, Spiro R, Albert MS (
Moffat SD, Szekely CA, Zonderman AB, Kabani NJ, Resnick SM (
Pfefferbaum A, Sullivan EV, Rosenbloom MJ, Mathalon DH, Lim KO (
Piao X, Hill RS, Bodell A, Chang BS, Basel-Vanagaite L, Straussberg R, Dobyns WB, Qasrawi B, Winter RM, Innes AM, Voit T, Ross ME, Michaud JL, Descarie JC, Barkovich AJ, Walsh CA (
Radloff LS (
Raz N (
Raz N (
Raz N Gunning FM, Head D, Dupuis JH, McQuain JD, Briggs SD, Loken W J, Thornton AE, Acker JD (
Raz N, Gunning-Dixon FM, Head DP, Dupuis JH, Acker JD (
Raz N, Briggs SD, Marks W, Acker JD (
Raz N, Williamson A, Gunning-Dixon F, Head D, Acker JD (
Raz N, Gunning-Dixon F, Head D, Williamson A, Acker JD (
Raz N, Rodrigue KM, Acker JD (
Raz N, Rodrigue, KM, Kennedy, KM, Head, D, Gunning-Dixon, FM, Acker JD (
Raz N, Rodrigue KM, Kennedy KM, Dahle C, Head D, Acker JD (
Raz N, Rodrigue KM, Head D, Kennedy KM, Acker JD (
Raz N, Gunning-Dixon F, Head D, Rodrigue KM, Williamson A, Acker JD (
Resnick SM, Pham DL, Kraut MA, Zonderman AB, Davatzikos C (
Rodrigue KM, Raz N (
Rogosa D, Willett J (
Satz P (
Scahill RI, Frost C, Jenkins R, Whitwell JL, Rossor MN, Fox NC (
Shrout PE, Fleiss JL (
Sliwinski M, Buschke H (
Spearman CE (
Stern Y, Alexander GE, Prohovnik I, Mayeux R (
Sullivan EV, Pfefferbaum A (
Tang Y, Nyengaard JR, Pakkenberg B, Gundersen HJ (
Author notes
1Department of Psychology and Institute of Gerontology, Wayne State University, 87 East Ferry St, 226 Knapp Building, Detroit, MI 48202, USA 2Center for Lifespan Psychology, Max Planck Institute for Human Development, Berlin, Germany, 3School of Psychology, Saarland University, Saarbrücken, Germany, 4Department of Psychology, Washington University, Saint-Louis, MI, USA, 5Department of Psychology, University of Memphis, Memphis, TN, USA and 6Baptist Memorial Hospital-East, Diagnostic Imaging Center, Memphis, TN, USA