


Abstract
We questioned the significance of haplotype structure in gene regulation by testing whether individual single nucleotide polymorphisms (SNPs) within a gene promoter region [interleukin-1-beta (IL1B)] might affect promoter function and, if so, whether function was dependent on haplotype context. We sequenced genomic DNA from 25 individuals of diverse ethnicity, focusing on exons and upstream flanking regions of genes of the cluster. We identified four IL1B promoter region SNPs that were active in transient transfection reporter gene assays. To substantiate allelic differences found in reporter gene assays, we also examined nuclear protein binding to promoter sequence oligonucleotides containing different alleles of the SNPs. The effect of individual SNPs on reporter gene transcription varied according to which alleles of the three other SNPs were present in the promoter construct. The SNP patterns that influenced function reflected common haplotypes that occur in the population, suggesting functionally significant interactions between SNPs according to haplotype context. Of the haplotypes that include the four functional IL1B promoter SNPs (−3737, −1464, −511, −31), the four haplotypes that showed different contextual effects on SNP function accounted for >98% of the estimated haplotypes in Caucasian and African-American populations. This finding underlines the importance of understanding the haplotype structure of populations used for genetic studies and may be especially important in the functional analysis of genetic variation across gene regulatory regions.
INTRODUCTION
The interleukin-1 (IL1) system has an important regulatory role in inflammation and host defense (1–4). IL1 gene transcription is inducible by microbial products and host defense proteins in many cell types. The most studied IL1 proteins, IL1α, IL1β and IL1 receptor antagonist (IL1ra), are products of the three related genes IL1A, IL1B and IL1 RN. IL1α and β are agonists of cell membrane IL1 type 1 receptors, whereas IL1ra is a competitive antagonist. Human IL1 and related genes are located in ∼500 kb region of chromosome 2q.12, and strong linkage disequilibrium (LD) has been demonstrated across the gene cluster in Caucasian populations (5–8).
Clinical studies show that IL1 is a significant mediator of inflammatory diseases in vivo, as exemplified by patient responses to IL1 inhibitors (9–14). Many association studies have also suggested a genetic influence of the IL1 region in a variety of diseases that have an inflammatory component (15–20). As is often the case with association studies, especially in complex trait diseases, contradictory findings have been reported both in different populations and within similar populations (19,21–26).
Potential reasons for diverse findings in such genetic association studies are well described and include small sample size, heterogeneous phenotypes, genetic admixture and multiple testing methodologies (27–29). The ‘single nucleotide polymorphism (SNP) approach’ adopted in many studies is also likely to mislead unless the SNP itself can be a sufficient etiological event or a reliable marker of a disease-related haplotype, for either of which there seems to be limited evidence (30).
An understanding of haplotype structure across segments of chromosomes that contain potential disease genes is likely to increase the value of genetic association studies in any population where haplotypes have been ascertained (29,31,32). This may be especially true when genetic or epistatic interactions within a haplotype block contribute to the development of the phenotype in question.
Variations in the upstream region of the IL1B gene have been associated with several diseases and IL1β protein expression (15,17,19,20,33,34). We focused on the IL1B gene as a model for understanding the potential importance of SNP context at a regulatory level. In reporter gene assays, we tested frequent SNPs of the promoter region for allele-specific differences in activity against a comparator construct where all SNPs were set at the more common allele. To provide a potential explanation for differential transcriptional activity of individual alleles in the reporter assays, we also examined binding of nuclear proteins to the allelic DNA in electromobility shift assays.
We found that the alleles of some SNPs had different effects on transcription of the reporter gene and showed clearly different nuclear protein binding characteristics. Of particular interest, the effect of an individual SNP in the functional transcription assay was highly dependent on which alleles of other functional SNPs were present in the promoter construct. SNP patterns that showed interaction corresponded to common haplotypes found in two different populations. Such interaction between SNPs in strong LD may arise randomly or may be a consequence of haplotype selection by integrated function.
These findings demonstrate the influence of sequence context on the molecular function of a SNP in a gene promoter and indicate that genetic association studies, especially using markers in regulatory regions, may be more informative if functional SNP haplotypes are analyzed, rather than individual functional SNPs.
RESULTS
To identify variants in the IL1B gene that are most likely to be functional, we sequenced the seven exons and adjacent intronic regions, 5 kb upstream of the gene and 2 kb into the 3′ region (comprising 12 kb in all), in a multi-ethnic panel of 25 individuals. We identified 20 SNPs (Table 1). The set of IL1B SNPs included five SNPs at positions −511 (SNP B14), −31 (SNP B15), −1464 (previously reported as −1473) (24) (SNP B10), +3954 (SNP B25) and +3877 (SNP B24) in the IL1B gene, which have been previously associated with clinical conditions (18–20,35–40). Six other SNPs, −3893 (SNP B3), −3737 (SNP B4), +5548 (SNP B30), +6506 (SNP B35), +6911 (SNP B37) and +7214 (SNP B38) were found in the dbSNP (http://www.ncbi.nlm. nih.gov/entrez), but we were unable to find previous reports of clinical associations with any of these SNPs. The nine remaining SNPs were not found in dbSNP, and seven had minor allele frequencies (MAFs) ≤4% (‘Rare’).
It is notable that in seven exons sequenced, only one SNP was identified in a coding region, the well-described synonymous SNP at +3954. Of the remaining 19 SNPs, 12 were in the promoter/enhancer region.
To characterize the functional SNPs, we then focused on the promoter region of the IL1B gene (Table 1). Initial transcriptional survey experiments were performed comparing reporter gene activity in constructs that isolated the SNP of interest, by changing the individual SNP to the rarer allele (data not shown). Four potentially functional high frequency SNPs (B4, B10, B14 and B15) were identified for further study, on the basis of preliminary evidence of allele-specific transcriptional activity and having an MAF >4%. As the primary objective was to determine the influence of haplotype context on activity of specific SNPs in the IL1B promoter, we evaluated three aspects of biological activity. We first examined nuclear protein binding to the single SNP oligonucleotides. We then evaluated allele-specific transcriptional activity of individual SNPs. This was done within synthetic haplotype constructs that isolated the SNP of interest, without consideration as to whether the haplotype was actually observed in the population. Finally, we determined allele-specific influence of a single SNP on the transcriptional activity of naturally occurring haplotypes that are highly prevalent in the population.
Allele-specific nuclear protein binding
Three of the four SNPs of interest exhibited allele-specific differences in nuclear protein binding. For example, B4 (−3737) alleles showed different binding complexes, with allele 1 (C) exhibiting substantially greater nuclear binding at two bands in complex 1 (Fig. 1A), which disappeared upon competition with unlabelled allele 1 (C) but not allele 2 (T) oligonucleotides (Fig. 1B). The bands also exhibited a shift with the addition of antibody to the p50 component to NFκB (Fig. 1C).
Allele-specific binding was also evident with B10 (−1464) (Fig. 2A and B), with allele 2 (C) showing greater binding to a group of high mobility proteins (complex 1) than allele 1 (G).
The EMSA protein profile of B15 (−31) is strikingly different for allele 1 (T) and allele 2 (C) probes (Fig. 3A and B). As shown in Figure 3A, two intense bands formed with the allele 1 probe, whereas three distinct bands formed with allele 2. Cold competition assays to determine the specificity of binding of proteins to these allelic probes were carried out (Fig. 3B) and indicated that the protein binding of complex 1 is highly specific for allele 2 (C), whereas complexes 2 and 3 appear to have higher affinity for allele 1 (T).
No allelic differences in binding were evident at SNP B14 (−511) (data not shown). In view of these data, we proceeded to determine the effect of these alleles in a reporter assay performed in lipopolysaccharide (LPS)-stimulated THP-1 cells.
Allele-specific transcriptional activity
Within a sequence backbone where all SNPs were set to the more common allele in Caucasians, the rarer alleles of individual SNPs were evaluated for transcriptional effects. B4 (−3737) did not show transcription differences by allele (Fig. 4A, curves a and b), and B10 (−1464) showed only slightly lower transcriptional activity with allele 2 at the highest LPS dose (Fig. 4A, curves a and c). B14 (−511) allele 2 showed a modest increase in transcriptional activity when compared with allele 1 (Fig. 4B, curves a and b), and introduction of B15 (−31) allele 2 produced a moderate reduction in promoter activity when compared with the background construct (Fig. 4B, curves a and c). The allele-specific effects of individual SNPs on transcription and nuclear protein binding are summarized in Table 2.
IL1 SNPs are functional in haplotype context
The four functional promoter SNPs had strong influences within a haplotype context. Although allele 2 at SNP B15 reduced promoter activity in the context of SNP B14 set at allele 1, the same allele at B15 strongly enhanced promoter activity in the context of allele 2 at SNP B14 (Fig. 5, curves c and d). In addition, although there was no evidence of allelic differences in nuclear protein binding at B14 (−511), allele 2 at B14 showed a modest increase in transcriptional activity when combined with allele 1 at B15 (−31). However, allele 2 at B14 showed a strong increase in activity when allele 2 was also present at B15 (−31) (Fig. 5, curves b and d). This is of special interest because B14 and B15 are essentially in complete LD in all populations that have been studied (19,24,40).
SNP B10 allele 2, when compared with allele 1, had minimal to no activity on the background of SNPs B14 and B15 set to allele 1 (Fig. 6, curves a and b). However, SNP B10 allele 2 markedly reduced promoter activity when SNPs B14 and B15 were set to allele 2 (Fig. 6, curves c and d).
SNP B4 showed no allelic influence on promoter activity when both B14 and B15 were allele 1 (Fig. 7, curves a and b), in spite of clear allelic differences in nuclear protein binding on EMSA. However, within the context of B14 and B15 set to allele 2, SNP B4 allele 2 decreased the transcriptional activity of the IL1B promoter (Fig. 7, curves c and d). The influence of haplotype context on allele-specific transcriptional activity of the four functional IL1B SNPs is summarized in Table 3.
IL1B functional haplotypes differ by ethnic population
Using the four functional IL1B promoter SNPs, we estimated the distribution of IL1B promoter haplotypes in 900 Caucasians and 227 African-Americans. As shown in Table 4, of the 16 possible haplotypes, four accounted for >98% of the estimated haplotypes in both Caucasian and African-American populations. The haplotype that includes allele 2 at B10, B14 and B15 represents ∼28% of Caucasian haplotypes, whereas the haplotype that comprises allele 1 at B10 and allele 2 at both B14 and B15 represents only 6%. However, in African-Americans, the latter haplotype with allele 1 at B10 represents ∼46% of haplotypes.
The transcriptional activities of the four common haplotypes were compared in a single experimental series (Fig. 8). It is of interest that the least common haplotype in Caucasians, but most common in African-Americans, showed higher activity than the other three haplotypes (Fig. 8, curve c versus a, b and d).
DISCUSSION
Gene variations that alter gene function are more likely to influence phenotypic characteristics, such as the risk for disease (32), but studies of phenotype association with promoter sequence variants may be confusing partially because promoter activity is complex at the molecular level (30). We tested the relevance of sequence context in gene regulation by examining the IL1B gene promoter function of individual SNPs alone and within the haplotypic sequences that predominate in the population. Using the SNPs identified in the upstream regulatory regions of the IL1B gene, we conducted a comprehensive analysis of allele-specific promoter activity and nuclear protein binding. We found that four SNPs in the promoter/enhancer region had functional activity and that the activity changed in different genetic context. We undertook the study because variations in the IL1 cluster of genes on chromosome 2 have been implicated in the clinical expression of several diseases, including cardiovascular disease (17,20,35,41), periodontal disease (18,37,42), Alzheimer's disease (16,43–45), osteoporosis (46,47), gastric cancer (19,23–25,38,39,48) and others (36,40,49–51).
The SNPs B14 (−511) and B15 (−31) have been repeatedly associated with multiple clinical conditions (41,44,49–52), such as cardiovascular disease (20,35) and gastric cancer (19,23–25,38,39), as well as clinically observed differences in levels of IL1B protein in vivo (20,33,34). The relationship with disease in other studies, especially in non-Caucasians, has not been consistent (19,22–26,53).
In a single SNP analysis, B15 (−31) allele 2 decreased promoter activity relative to allele 1, but substantially increased activity in the context of allele 2 at B14 (−511). B14 and B15 are in essentially complete LD in all populations of which we are aware (19,24,40), so either B14 or B15 should effectively represent the biological activity at these two loci in Caucasians and African-Americans. This combination may be an example of two SNPs that evolved together as a result of biological activity based on a cis-interaction (54). Although the combination of discordant alleles at these two sites has not been previously observed, the potential functional significance of both loci suggests that the LD should be confirmed in specific ethnic populations prior to decisions to exclude one of the two loci from the informative set of SNPs.
Our results are in agreement with a previous report (19) of allelic differences in transcription factor binding at IL1B (−31) involving a TATA box sequence. These investigators found no difference in allele-specific binding at IL1B (−511) and concluded that the clinical association with IL1B (−511) variants was actually due to the concordant SNP at IL1B (−31). Previous studies have implicated binding factors such as the TATA binding protein (TBP), NF-IL6 and Spi-1/PU.1 (55,56) with this region of the IL1B promoter. Extensive analyses of TBP binding and function (57) suggest that the B15 (−31) sequence of allele 1 (T) should show better binding and transcriptional activity than the sequence of allele 2 (C). This is consistent with our findings that allele 1 (T) appears to show better binding for proteins in complex 2 and complex 3 and exhibited increased transcriptional activity in the single SNP analysis.
Although IL1B (−511) has been implicated in differential clinical expression of IL1B protein (20,33,34) and is near a binding site for a glucocorticoid response element (58), we are not aware of any prior reports that demonstrate allelic differences in transcription. Our observations that B14 (−511) strongly influenced transcription activity only in the context of B15 (−31) and did not show allele-specific differences in binding suggest that the influence of B14 on transcription may be due to interactions other than direct contact with trans-activating proteins that bind to regulatory elements within this region. Alternatively, the functional effect of SNP 14 in reporter gene analysis could be caused by subtle changes in protein binding to regulatory elements surrounding SNP 14 or binding kinetics that do not lead to detectable band shifts in EMSAs under our particular experimental conditions. Other studies beyond the scope of this manuscript may be valuable to evaluate long-range protein interactions, which may explain some of the functional interactions observed in this study.
SNP-10 (−1464), although described in public databases (rs1143623 in dbSNP), has to our knowledge only recently been studied for biological relevance (24). Our data indicate that IL1B (−1464) influenced transcriptional activity of the IL1B promoter, and we are in agreement with a previous report (24) of allele-specific differences in nuclear protein binding. The sequence of SNP B10 is consistent with three ‘putative' binding sites for the proteins DBP, C/EBP alpha (a homolog of EFII) and Pit-1a (59). Although B10 (−1464) showed minimal allele-specific differences in promoter activity in the individual SNP analysis, it had substantial allele-specific effects when both B14 (−511) and B15 (−31) were allele 2. Allele 2 at B10 reduced the promoter activity of the B14/B15 haplotype 2/2. As B10 allele 2 had increased binding of nuclear proteins, it is possible that this allele preferentially binds a repressor of promoter activity.
The B14/B15 haplotype of 2/2 is present in 33.7% of IL1B promoter haplotypes in Caucasians, whereas B10/B14/B15=2/2/2 represents 27.7% of the promoter haplotypes and B10/B14/B15=1/2/2 represents 6.0% of the haplotypes (Table 4). In African-Americans, however, the B14/B15 haplotype of 2/2 is present in 56.7%, and the B10 allele ratio is dramatically different from Caucasians (Table 5). Of the predominant IL1B promoter haplotypes observed in African-Americans, the haplotype B10/B14/B15=2/2/2 represents 10.6% and the potentially more inflammatory B10/B14/B15=1/2/2 represents 46.1% of the haplotypes when compared with 6.0% in Caucasians.
Given the substantial influence of B10 (−1464) on the promoter activity of the B14/B15 haplotype and the different B10/B14/B15 haplotype distributions among ethnic groups, knowledge of the genotype at IL1B (−1464) may be central to understanding the biological and clinical implications of allele 2 at either IL1B (−31) or IL1B (−511). In studies of genetic variations in the IL1B gene, inclusion of IL1B (−1464) in addition to either IL1B (−31) or IL1B (−511) may be highly informative. This may be especially important in evaluations of IL1 genetic associations across multiple ethnic populations (60,61).
SNP B4 (−3737) is described in public databases (rs 4848306 in dbSNP), but to our knowledge has not been associated with IL1 biological activity or clinical disease. B4 (−3737) had allele-specific differences in NFκB binding with preferential binding to allele 1, but in our experiments, no differences in promoter activity were observed with different alleles of this SNP on a background of the other SNPs set at allele 1.
When B14 (−511) and B15 (−31) were allele 2, however, B4 allele 2 produced much lower activity than B4 allele 1. This repressive activity of SNP B4 allele 2 may be attributable to reduced binding of an up-regulatory factor (perhaps NFκB), which would be compatible with the EMSA data (Fig. 1C). It therefore appears possible that NFκB binding to SNP B4 allele 1 increases transcriptional activity of the IL1B promoter only in a specific haplotype context by interacting with SNPs 14 and 15 allele 2 or factors bound to those alleles. It has been postulated that long-range interactions between transcription factors (C/EBP beta and NFκB) binding to haplotypes within the promoter region of IL8 could influence transcription (62). On the basis of our observed genotypes, no haplotypes in either Caucasians or African-Americans were projected to include allele 2 at both B4 (−3737) and B14 (−511). This suggests that there may have been selection benefits from the activity conferred by NFkβ binding to allele 1 of B4 when the B4/B14/B15 haplotype was 1/2/2 or negative selection when the haplotype was 2/2/2.
Although promoter activity did not differ between B4 alleles when other SNPs were at allele 1, two of the most common promoter haplotypes in both populations studied (Table 4; haplotype 1 and haplotype 3) differed only at SNP B4 (−3737). One potential explanation for this observation is that the functional significance of B4 (−3737) depends on a broader haplotype that extends beyond the promoter/enhancer region of the IL1B gene.
Limitations of this study
This study considered only SNPs that were present in >4% of the population studied, yet uncommon SNPs may have an important role in defining functional differences between individuals. It is reasonable to expect that some SNPs with low frequency in the population may be functional, but the objective of this study was to identify the common SNPs that may contribute substantial phenotypic variation in the population.
The in vitro molecular analysis of SNP function and transcription factor binding was performed with phorbol-12-myristate-13-acetate (PMA) plus LPS as the cell activator. Although the relevance of in vitro promoter assays to in vivo events can always be questioned, our choice of a human monocyte-like cell in which to perform assays, and clinical data showing significant association between similar haplotypes and levels of IL1β protein in clinical samples (20,33,34) suggest that our model system is relevant. We are currently exploring the differential binding of these SNPs to transcription factors that may be activated by other signaling pathways to determine whether the functional relationship of these SNPs changes with different cellular stimuli.
As different cell types may use a different repertoire of receptors, signaling pathways and transcription factors, the same SNPs may show tissue-specific differences in function (30,62). Studies are in progress to evaluate the relevance of these specific haplotypes to IL1B gene regulation in different tissues where cells other than monocytes may be important producers of IL1β. Monocytes, as used in our studies, are thought to be the primary source of IL1β in many inflammatory conditions in vivo (1,2). However, IL1β also plays a role in regulating other functions that may be less dependent on monocytes, for example, the primary source of IL1β in normal bone remodeling is thought to be from ‘marrow cells’, perhaps osteoclast precursors (63).
SUMMARY
This study has defined the major functional SNPs and haplotype combinations that influence the regulation of IL1B promoter activity in response to bacterial endotoxin in a human monocytic cell line and shows that patterns of functional SNPs correspond to the common SNP IL1B haplotypes found in multiple human populations. The influence on transcription of SNP-defined haplotypes of a gene promoter region showed an individual SNP having either an up- or down-regulatory effect depending on haplotype context. One SNP (IL1B −1464) had substantially different activity within the context of a haplotype that had a >7-fold higher frequency in African-Americans when compared with Caucasians. Our results further underline the relevance of population haplotypes in the design of genetic studies, particularly for those involving gene regulatory regions.
MATERIALS AND METHODS
High-density SNP mapping
Twenty-five unrelated, healthy volunteers of different, self-described, ethnicity were selected. Each of these subjects, and those whose DNA was used in subsequent family studies, gave informed written consent, and the protocol was approved by the Sheffield Hospitals Research Ethics Committee (UK). Genomic DNA was prepared from blood samples by standard methods (64). The DNA was sent to Genome Therapeutics Corporation (Waltham, MA, USA) for sequencing and high-density SNP mapping. Publicly available genomic sequences across the IL1 region were used to establish the reference sequence for SNP identification. In addition, a commercially available BAC library (BACPAC Resource Center, Oakland, CA, USA) was screened to identify BAC clones spanning the IL1 region. Positive BAC clones were used to generate a library of plasmids with 3–3.5 kb inserts. Four genes, IL1A (IL1F1), IL1B (IL1F2), ILRN (IL1F3) and IL1F5, were interrogated and SNPs were identified for each gene in the exon regions and 5 kb upstream of the gene. SNP detection was performed automatically using the PolyPhred program on an ABI 3700 instrument, followed by visual inspection of the identified SNPs. This study is focused on the functional significance of SNPs identified in the IL1B gene.
Population haplotypes of IL1B promoter region
A population from a periodontal analysis within the Atherosclerosis Risk in Communities Study (65), which included 900 Caucasians and 227 African-Americans, was used to determine genotype differences between ethnic groups. Haplotypes were estimated using haploscore version 1.0 (66). This software applies a version of the EM algorithm (67) to account for phase ambiguity.
Cell culture and reagents
The human monocytic cell line, THP-1, was obtained from American Type Culture Collection (ATCC, Manassas, VA, USA). THP-1 cells were grown in RPMI 1640 medium (ATCC) supplemented with 10% fetal bovine serum (Hyclone, Logan, UT, USA). Cells were subcultured every other day and maintained at a cell density between 2×10⁵ and 7×10⁵ cells/ml. LPS (from Escherichia coli 055:B5) and PMA were obtained from Sigma (St Louis, MO, USA). Anti-NFκB p50 (H-119) and anti-NFκB p65 (c-20) were purchased from Santa Cruz Biotechnology, Inc. (Santa Cruz, CA, USA). Some constructs were also tested in the same medium without serum supplementation, to assess the potential influence of serum products on the allelic responses in the reporter assay.
Generation of IL1B gene promoter construct
The human IL1B promoter was amplified by PCR from BAC clone RP11-67L14 (IL1B, BACPAC Resource Center, Oakland, CA, USA) using Pfu turbo DNA polymerase (Stratagene, La Jolla, CA, USA). Two primer sets were used to amplify the IL1B promoter containing different 3′ ends.
Primers IL1BF1 5′cccACGCGTGAGTGAAAGGAATCCCGTTAGAAGT and IL1BR2 5′cccACGCGTGCCTGTTGTGCCTTGTGCCTCGAAG were used to generate IL1B promoter fragment IL1BS (+32 to −5326) (S, short; without the first exon).
IL1BR1 5′ cccACGCGTGGCTGCTTCAGACACCTGTGTA was used to generate promoter fragment IL1BL (+471 to −5326) [L, long; containing the first exon and SNP 17 (+45)]. Amplified IL1B promoter fragments were cloned into pCR-Blunt II-TOPO vector using the Zero Blunt TOPO PCR cloning kit (Invitrogen, Carlsbad, CA, USA), and then subcloned into pGL3-basic vector (Promega, Madison, WI, USA) upstream of the luciferase reporter gene to generate parental constructs with differing lengths of the promoter region. The sequencing of our BAC DNA clone revealed that the SNPs at positions 14 and 15 were the minor alleles. These SNPs were sequentially converted to the major allele sequences by site-directed mutagenesis so that the parental serial constructs for both a longer plasmid (containing SNPs 2–15 by utilizing the KpnI site just upstream of SNP 2) and a short plasmid (containing the promoter region out to the BamHI site between SNPs 9 and 10) were uniformly allele 1 at all of the 13 SNPs (12 in 5′ flanking region and one in the first exon). Site-directed mutagenesis of individual SNPs to allele 2 sequences was carried out by QuikChange XL site-directed mutagenesis kit (Stratagene). Successful mutagenesis of the IL1B promoter was confirmed by sequence analysis and then promoters were re-cloned into the original pGL3-basic vector to avoid possible mutations introduced by PCR in the vector. DNA used in cell transfection was prepared by the EndoFree Plasmid Maxi kit (Qiagen, Valencia, CA, USA) to ensure minimal endotoxin contamination.
Cell transfection and reporter gene transcription assay
Prior to transfection, THP-1 cells were counted, washed and re-suspended in plain RPMI medium at 1.5–2×10⁷ cells/ml. For transfection, 200 ng pGL-IL1 promoter constructs and 6.25 ng phRL-TK (Promega) were mixed with 750 µl RPMI, 50 µl 1 m TRIS, pH 7.4, 100 µl DEAE-dextran (2 mg/ml) in phosphate buffered saline and 100 µl THP-1 cells. The mixtures were incubated at 37°C for 30 min. Cells were spun down, washed, re-suspended in 0.5 ml culture medium and transferred into 24-well culture dishes. Cells were stimulated by PMA (20 ng/ml) and LPS for 6 h, following 18–24 h of transfection. Cells were then lysed in 100 µl passive lysis buffer (Promega). Cell lysate (20 µl) was analyzed for both the firefly and Renilla luciferase activities using the dual-luciferase reporter assay system (Promega). Luciferase activity was measured by 1450 MicroBeta luminometer (PerkinElmer, Boston, MA,USA). Promoter activity was normalized to Renilla activity from co-transfected phRL-TK. Each construct was transfected and assayed for promoter activity in triplicates, and transfection for each construct was performed at least three times. Differences in plasmid transcriptional activity were tested for statistical significance by the Student's t-test using two-tailed distribution among samples of equal variance.
Gel mobility shift assay
THP-1 cells were cultured as described earlier and either harvested without treatment or treated with 100 ng/ml of LPS and 20 ng/ml of PMA for various time periods. Nuclear extracts were prepared according to Andrews and Faller (68). Briefly, cells were re-suspended in cold buffer A (10 mm HEPES–KOH, pH 7.9, 1.5 mm MgCl2, 10 mm KCl, 0.5 mm DTT, 2 mm AEBSF) and incubated on ice for 10 min. Nuclear pellets were then re-suspended in cold buffer C (20 mm HEPES–KOH, pH 7.9, 25% glycerol, 420 mm NaCl, 1.5 mm MgCl2, 0.2 mm EDTA, 0.5 mm DTT, 2 mm AEBSF) for 30 min on ice. After centrifugation for 2 min at 4°C, nuclear extracts were stored at −80°C. Oligonucleotides of each SNP were synthesized (MWG Biotech, High Point, NC, USA) and purified by 10% polyacrylamide gel. Complementary single-stranded oligonucleotides were annealed and labeled with [α-32P]dGTP by Klenow (exo-) fill-in. For protein–DNA binding, 7 µg of nuclear extracts were incubated with 5.0×10⁴ c.p.m. of 32P-labeled probes for 20 min at room temperature in a volume of 20 µl binding buffer (12 mm HEPES–KOH, pH 7.9, 1.5 mm MgCl2, 60 mm KCl, 0.2 mm EDTA, 0.5 mm DTT, 0.4 mm AEBSF, 10% glycerol) and 2 µg of poly(dI–dC) (Sigma). Protein–DNA complexes were resolved on 4% polyacrylamide gels and visualized by exposure to X-ray films. For cold oligonucleotide competition assays, nuclear extracts were incubated with cold probe for 10 min at room temperature before the addition of labeled probe. In antibody supershift assays, 1–2 µg of antibody was added after binding of nuclear extracts to labeled probe and was incubated for 15 min at room temperature before gel loading. Sequences of oligonucleotide strands are shown in Table 5.
Construct backgrounds and screening for functional SNPs
As no non-synonymous SNPs were identified in the IL1B exons, the first phase of our analysis was the identification of SNPs that altered transcriptional activity and/or nuclear protein binding. The SNPs were annotated and schematically formatted with respect to their position within the gene as a basis for developing a clear approach to probing allele-specific differences in gene function.
By setting all SNPs to allele 1 except for the individual SNP of focus, we performed an initial screening of promoter activity following transfection of the SNP constructs into THP-1 cells. Transfection analysis with varied-length parental constructs showed that deletion of the distal fragment between SNP 1 and SNP 10 enhanced promoter activity, indicating strong repressors within this region (data not shown). Stronger promoter activity of plasmids containing the region between SNP 17 and the start of the exon also revealed the existence of enhancer(s) in the 5′-UTR (data not shown). A total of 40 promoter–reporter plasmids querying individual SNP loci within the promoter were constructed for this initial screening phase, and a decision was made on the background plasmid for SNP functionality studies. All transcriptional activity results reported here utilized the promoter plasmid background containing sequences from −4018 to +32 of the IL1B gene (including SNP 2 to SNP 15).
ACKNOWLEDGEMENTS
The authors wish to express their gratitude to Ms Barbara Veresh for her assistance in manuscript preparation and Mr Gary Breton for his search of appropriate databases to confirm SNP identification and novelty.
Conflict of Interest statement. GWD holds stock in Interleukin Genetics Inc. and is also currently a consultant to the Company.
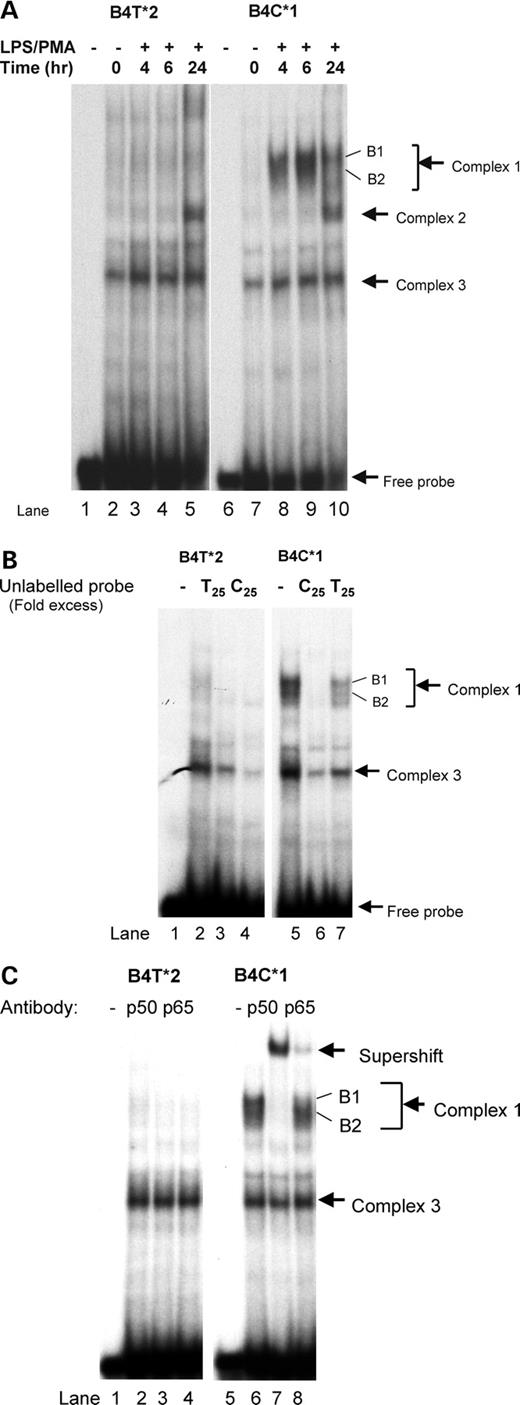
Figure 1. (A) Electromobility shift assay of SNP 4 (−3737). Labeled, double-stranded oligomers, both alleles 1 and 2 sequences of SNP 4, were tested for binding to nuclear protein from THP-1 cells treated for 0, 2, 4, 6 and 24 h with LPS (100 ng/ml) and PMA (20 ng/ml). Location of the free probe and three retarded binding complexes are indicated by arrows. (B) Allele specificity of complex formation for SNP 4. To determine specificity of binding, unlabeled double-stranded oligomers for alleles 1 and 2 were used in the EMSA assay to compete for binding of the labeled probes. Complete blocking of complex 1 binding was seen for the C oligonucleotide, indicating a higher binding affinity to that oligonucleotide. (C) NFκB antibody supershift assays for SNP 4. NFκB antibody for both p50 and p65 subunits was used in the EMSA assay to examine the nature of DNA–protein complexes. Binding patterns show a major supershift with p50 antibody and to a much lesser degree with p65 antibody.
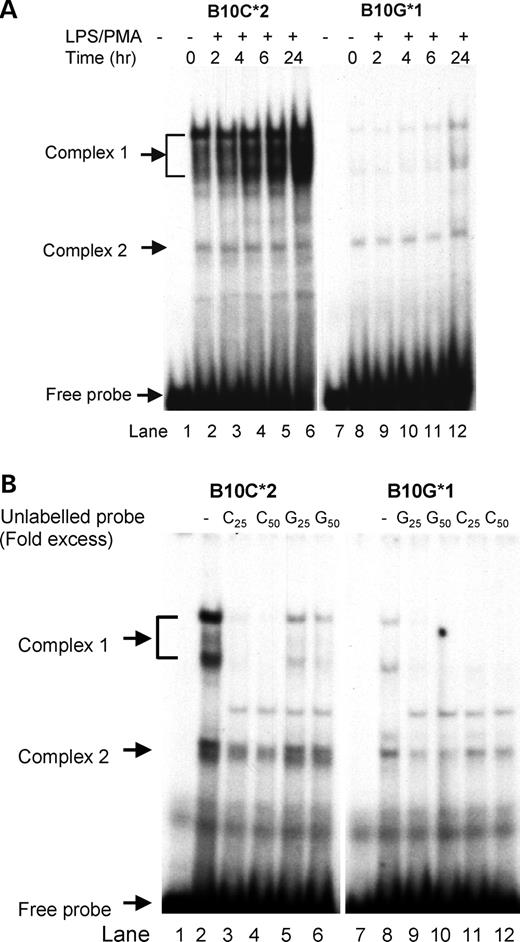
Figure 2. (A) Electromobility shift assay of SNP 10 (−1468). Labeled, double-stranded oligomers, both alleles 1 and 2 sequences of SNP 10, were tested for binding to nuclear protein from THP-1 cells treated for 0. 2, 4, 6 and 24 h with LPS (100 ng/ml) and PMA (20 ng/ml). Location of the free probe and two retarded binding complexes are indicated by arrows. (B) Allele specificity of complex formation for SNP 10. To determine specificity of binding, unlabeled double-stranded oligomers for alleles 1 and 2 were used in the EMSA assay to compete for binding of the labeled probes. Blocking of complex 1 with cold C oligonucleotide indicated a higher affinity of protein binding to allele 2 oligonucleotide.
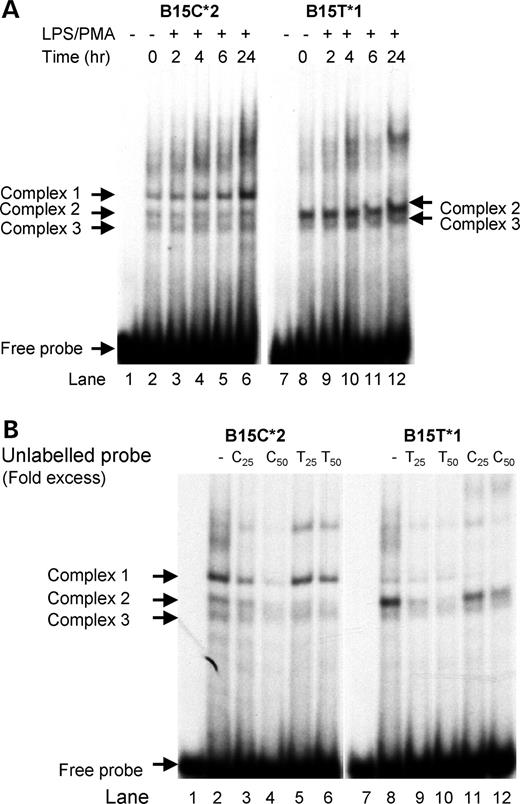
Figure 3. (A) Electromobility shift assay of SNP 15 (−31). Labeled, double-stranded oligomers, both alleles 1 and 2 sequences of SNP 15, were tested for binding to nuclear protein from THP-1 cells treated for 0, 2, 4, 6 and 24 h with LPS (100 ng/ml) and PMA (20 ng/ml). Location of the free probe and three retarded binding complexes for the C allele and two complexes for the T allele are indicated by arrows. (B) Allele specificity of protein binding to SNP 15 oligomers. To determine specificity of binding, unlabeled double-stranded oligomers for alleles 1 and 2 were used in the EMSA assay to compete for binding to the labeled probes. The pattern of binding competition indicated that the protein binding of complex 1 was highly specific for allele 2, whereas complexes 2 and 3 have higher affinity for allele 1.
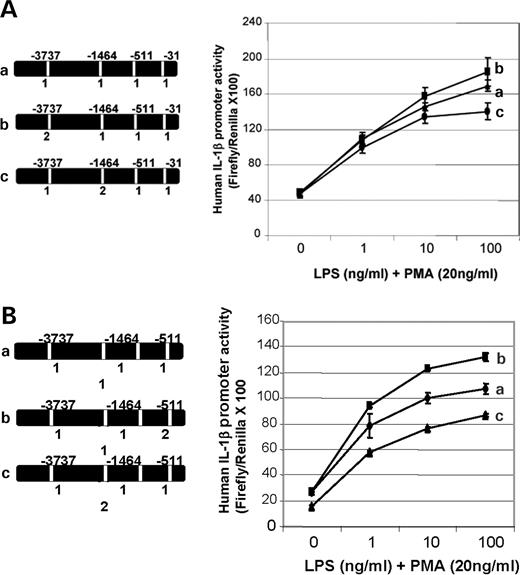
Figure 4. (A) Transcriptional analysis of single SNP allele change effects on IL1B reporter gene expression. Each set of transfections was performed in triplicate and each construct was transfected at least three times. Firefly luciferase activity was normalized to co-transfected Renilla activity to control for transfection efficiency. Results presented here as LPS dose–response in the presence of 20 ng/ml PMA for 6 h are from a single representative set of transfections. (A) Conversion of SNP 4 (−3737) from allele 1 (C) nucleotide to allele 2 (T) had no major effect on transcription (curve a versus b), even at higher stimulation levels. Conversion of SNP 10 (−1468) from allele 1 (G) nucleotide to allele 2 (C) had slightly lower transcription (curve a versus c) at the highest LPS level (P<0.05). (B) Conversion of SNP 14 (−511) from allele 1 (C) nucleotide to allele 2 (T) showed an increase in transcription (curve a versus b) (P<0.01). Conversion of SNP 15 (−31) from allele 1 (T) nucleotide to allele 2 (C) resulted in a marked decrease in transcriptional activity (curve a versus c) at all levels of LPS stimulation when compared with the background construct (P<0.01). The unstimulated (baseline) transcriptional activity of this construct (curve c) was also modestly lower.
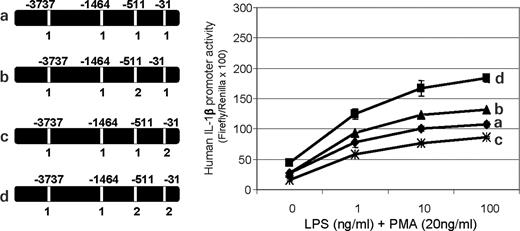
Figure 5. Transcriptional analysis of single versus multiple SNP (haplotype) allele changes for effects on IL1B reporter gene expression. Transfection conditions were as described for Figure 4A and B. Transfection sets comparing these constructs showed a reduction in promoter activity when SNP 15 (−31) was changed from allele 1 (T) to allele 2 (C) if SNP 14 (−511) was allele 1 (C) (curve a versus c) (P<0.01); however, the same allele 2 at SNP 15 markedly increased activity if SNP 14 was also changed to allele 2 (curve c versus d) (P<0.01). Although the conversion of SNP 14 from allele 1 to allele 2 (T) in the presence of SNP 15 allele 1 had only a slight increase in promoter activity in response to the higher LPS levels (curve a versus b) (P<0.01), the presence of allele 2 at both SNPs 14 and 15 resulted in the strongest increase in promoter activity at all levels of LPS, as well as a slightly higher baseline activity (curve b versus d) (P<0.01).
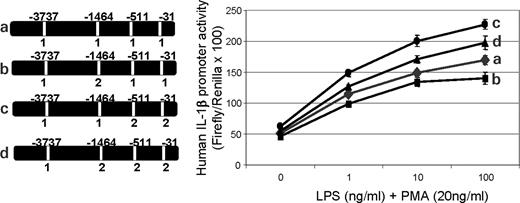
Figure 6. Transcriptional analysis of single versus multiple SNP (haplotype) allele changes for effects on IL1B reporter gene expression. Transfection conditions were as described for Figure 4A and B. Transfection sets comparing these constructs showed a slight reduction in promoter activity when SNP 10 (−1468) was changed from allele 1 (G) to allele 2 (C) if SNPs 14 (−511) and 15 (−31) were allele 1 (C and T, respectively) (curve a versus b) (P<0.05). However, conversion of SNP 10 from alleles 1 to 2 was able to markedly reduce (curve c versus d) (P<0.05) the enhanced promoter activity seen when SNPs 14 and 15 had been changed to allele 2 (curve c versus a) (P<0.01).
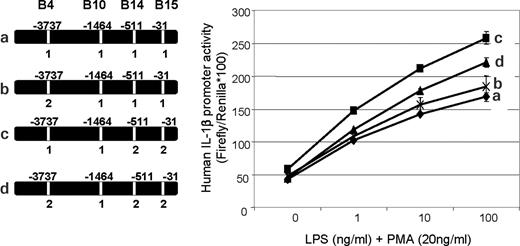
Figure 7. Transcriptional analysis of single versus multiple SNP (haplotype) allele changes for effects on IL1B reporter gene expression. Transfection conditions were as described for Figure 4A and B. Transfection sets comparing these constructs showed no major effect on promoter activity when SNP 4 (−3737) was changed from allele 1 (C) to allele 2 (T) if SNPs 14 (−511) and 15 (−31) were allele 1 (C and T, respectively) (curve a versus b). However, conversion of SNP 4 from alleles 1 to 2 was able to markedly reduce (curve c versus d) (P<0.01) the enhanced promoter activity seen when SNPs 14 and 15 had been changed to allele 2 (curve c versus a) (P<0.01).
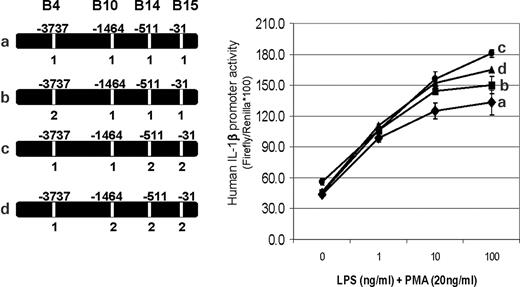
Figure 8. Transcriptional analysis of allelic changes among the most common haplotypes for effects on IL1B reporter gene expression. Transfection conditions were as described for Figure 4A and B. The more common four-SNP haplotype with allele 2 (T) only at SNP 4 (−3737) (curve b) is not statistically different from the haplotype where all SNPs except SNP 4 are changed to allele 2 (curve b versus d). The haplotype containing all four SNPs set to allele 1 (curve a) had activity lower than the haplotype with SNP 4 (−3737) changed to allele 2 (T) only at the highest LPS dose (curve a versus b) (P<0.05). The less common haplotype in Caucasians, but most common in African-Americans (curve c), showed higher activity than the other three haplotypes (curve c versus a, b and d) (P<0.05).
Annotation of SNPs identified in the IL1B gene
| Study SNP number | rs | Relative to +1 | Location | Nucleotide allele 1/2 | SNP sequence |
|---|---|---|---|---|---|
| 1 | Novel | −5164 | Promoter | T/C | GCCTGGGTCC/TAGACTTGACAAA |
| 2 | Novel/rarea | −3959 | Promoter | T/C | AGAAAAGACA/TAGAGTAGGA |
| 3 | 12621220 | −3893 | Promoter | G/A | TCCAAAGGAA/GGACAAGGTC |
| 4 | 4848306 | −3737 | Promoter | C/T | GGGAGGAGAATGGAATGT/CCCTTGGACTCT |
| 5 | Novel/rare | −3686 | Promoter | A/G | GAAGAAGCCC/ATTGGAGATGATG |
| 6 | Novel/rare | −3254 | Promoter | T/C | GATAACTGGC/TGCGAAGCCCATGAT |
| 7 | Novel/rare | −2905 | Promoter | A/G | GGAAGACAGG/ATCTGATACATAC |
| 8 | Novel/rare | −2394 | Promoter | G/A | CCTGTCACTG/GCTTTGATCCTCCTT |
| 9 | Novel/rare | −2378 | Promoter | G/A | ATCCTCCTTC/GTTCAGCTTGTAATC |
| 10 | 1143623 | −1464 | Promoter | G/C | CACTCCCTTG/GATAATGCAGAGCGAG |
| 14b | 16944 | −511 | Promoter | C/T | AGAGAGCTCC/CGAGGCAGAGAAC |
| 15 | 1143627 | −31 | Promoter | T/C | TTTTGAAAGC/TATAAAAACAGCGAGGGAG |
| 17 | Novel | +45 | Exon 1 5′ UTR | T/C | GCTCTGGGAT/TCTCTTCAGCCAATCTTCAT |
| 19 | Novel/rare | +746 | Intron 2 | C/T | ACTACTTTCC/CATTACAAGTCCCTCCAG |
| 24 | 1143633 | +3877 | Intron 4 | G/A | AAATTTTGCC/GCCTCGCCTCACGAG |
| 25 | 1143634 | +3954 | Exon 5 | C/T | CTATCTTCTT/CGACACATGGGATAACG |
| 30 | 1143639 | +5548 | Intron 6 | G/A | CCTTCTCCCC/GCCCCCATCCCTAGG |
| 35 | 10176689 | +6506 | Exon 7 3′ UTR | C/A | ATAGCCTGGA/CTTTCCTGTTGTCT |
| 37 | 1071676 | +6911 | Exon 7 3′ UTR | G/C | CTTTAATTAA/GACTGAAAATATATAAGC |
| 38 | 2853550 | +7214 | 3′ Genomic | C/T | CAGTGCACAT/CTGGAACAGGATC |
a‘Rare’=minor allele found in ≤4% of study population.
bSNPs originally numbered 11–13, 16, 18, 20–23, 26–29, 31–34 and 36 were identified in a preliminary sequence analysis but were not validated as polymorphisms and are not included as validated IL1B SNPs.
Nucleotides in bold type indicate the position of the SNP.
Summary of single SNP allele change effects relative to more common allele
| SNP | Allele | Nuclear protein binding | Transcriptional activity |
|---|---|---|---|
| B4 (−3737) | 2 (T) | Decreased | No effect |
| B10 (−1464) | 2 (C) | Increased | Decreased |
| B14 (−511) | 2 (T) | No effect | Increased |
| B15 (−31) | 2 (C) | Complex 1: increased Complex 2: decreased Complex 3: decreased | Decreased |
Summary of function in haplotype context
| SNP | Transcriptional activity as single SNP (haplotype B4/B10/B14/B15) | Transcriptional activity in haplotype context (haplotype B4/B10/B14/B15) |
|---|---|---|
| B4 (−3737) | No effect (2/1/1/1 versus 1/1/1/1) | Decreased (2/1/2/2 versus 1/1/2/2) |
| B10 (−1464) | Decreased (1/2/1/1 versus 1/1/1/1) | Decreased (1/2/2/2 versus 1/1/2/2) |
| B14 (−511) | Increased (1/1/2/1 versus 1/1/1/1) | Increased (1/1/2/2 versus 1/1/1/2) |
| B15 (−31) | Decreased (1/1/1/2 versus 1/1/1/1) | Increased (1/1/2/2 versus 1/1/2/1) |
Haplotypes of IL1B promoter SNPs found in Caucasian and African–American populations
| Haplotype | −3737 (SNP B4) | −1464 (SNP B10) | −511 (SNP B14) | −31 (SNP B15) | Caucasian | African-American |
|---|---|---|---|---|---|---|
| Frequency (%) | Frequency (%) | |||||
| 1 | 2 | 1 | 1 | 1 | 44.8 | 27.3 |
| 2 | 1 | 2 | 2 | 2 | 27.7 | 10.6 |
| 3 | 1 | 1 | 1 | 1 | 20.0 | 14.7 |
| 4 | 1 | 1 | 2 | 2 | 6.0 | 46.1 |
| Totala | 99.4 | 98.7 |
aTotal of all haplotypes derived from genotypes that included the four SNPs.
Sequences of oligonucleotides used in EMSA analyses
| Oligonucleotide designation | 5′–3′ |
|---|---|
| B4C | cggagaatggaatgtcccttggactctgcatga tcgagcctcttaccttacagggaacctgagacgtactgcgc |
| B4T | cggagaatggaatgttccttggactctgcatga tcgagcctcttaccttacaaggaacctgagacgtactgcgc |
| B10G | ctcactcccttggataatgcagagcgagca tcgagagtgagggaacctattacgtctcgctcgtgcgc |
| B10C | ctcactcccttgcataatgcagagcgagca tcgagagtgagggaacgtattacgtctcgctcgtgcgc |
| B14C | ccaattgacagagagctcccgaggcagagaacagcatcga ggttaactgtctctcgagggctccgtctcttgtcgtgcgc |
| B14T | ccaattgacagagagctcctgaggcagagaacagcatcgag gttaactgtctctcgaggactccgtctcttgtcgtgcgc |
| B15T | ccttctgcttttgaaagctataaaaacagcgagggagatcga ggaagacgaaaactttcgatatttttgtcgctccctctgcgc |
| B15C | ccttctgcttttgaaagccataaaaacagcgagggagatcga ggaagacgaaaactttcggtatttttgtcgctccctctgcgc |
Nucleotides in bold type indicate relative position of the SNP in oglionucleotides.
References
Dinarello, C.A. (
Arend, W.P. and Gabay, C. (
Rosenwasser, L.J. (
Nicklin, M.J., Weith, A. and Duff, G.W. (
Dunn, E., Sims, J.E., Nicklin, M.J. and O'Neill, L.A. (
Nicklin, M.J., Barton, J.L., Nguyen, M., FitzGerald, M.G., Duff, G.W. and Kornman, K. (
Cox, A., Camp, N.J., Nicklin, M.J., di Giovine, F.S. and Duff, G.W. (
Choy, E.H. and Panayi, G.S. (
Mrak, R.E. and Griffin, W.S. (
Pacifici, R. (
Allan, S.M. and Pinteaux, E. (
Camp, N.J., Cox, A., di Giovine, F.S., McCabe, D., Rich, W. and Duff, G.W. (
Duff, G.W. (
Griffin, W.S., Nicoll, J.A., Grimaldi, L.M., Sheng, J.G. and Mrak, R.E. (
Francis, S.E., Camp, N.J., Dewberry, R.M., Gunn, J., Syrris, P., Carter, N.D., Jeffery, S., Kaski, J.C., Cumberland, D.C., Duff, G.W. et al. (
Kornman, K.S., Crane, A., Wang, H.Y., di Giovine, F.S., Newman, M.G., Pirk, F.W., Wilson, T.G., Jr, Higginbottom, F.L. and Duff, G.W. (
El-Omar, E.M., Carrington, M., Chow, W.H., McColl, K.E., Bream, J.H., Young, H.A., Herrera, J., Lissowska, J., Yuan, C.C., Rothman, N. et al. (
Iacoviello, L., Di Castelnuovo, A., Gattone, M., Pezzini, A., Assanelli, D., Lorenzet, R., Del Zotto, E., Colombo, M., Napoleone, E., Amore, C. et al. (
Hodge, P.J., Riggio, M.P. and Kinane, D.F. (
Ma, S.L., Tang, N.L., Lam, L.C. and Chiu, H.F. (
Chang, Y.W., Jang, J.Y., Kim, N.H., Lee, J.W., Lee, H.J., Jung, W.W., Dong, S.H., Kim, H.J., Kim, B.H., Lee, J.I. et al. (
Lee, K.A., Ki, C.S., Kim, H.J., Sohn, K.M., Kim, J.W., Kang, W.K., Rhee, J.C., Song, S.Y. and Sohn, T.S. (
Zeng, Z.R., Hu, P.J., Hu, S., Pang, R.P., Chen, M.H., Ng, M. and Sung, J.J. (
Yang, J., Hu, Z., Xu, Y., Shen, J., Niu, J., Hu, X., Guo, J., Wei, Q., Wang, X. and Shen, H. (
Little, J., Bradley, L., Bray, M.S., Clyne, M., Dorman, J., Ellsworth, D.L., Hanson, J., Khoury, M., Lau, J., O'Brien, T.R. et al. (
Sing, C.F., Stengard, J.H. and Kardia, S.L. (
Horne, B.D. and Camp, N.J. (
Knight, J.C. (
Crawford, D.C. and Nickerson, D.A. (
Tabor, H.K., Risch, N.J. and Myers, R.M. (
Hall, S.K., Perregaux, D.G., Gabel, C.A., Woodworth, T., Durham, L.K., Huizinga, T.W., Breedveld, F.C. and Seymour, A.B. (
Hulkkonen, J., Laippala, P. and Hurme, M. (
Berger, P., McConnell, J.P., Nunn, M., Kornman, K.S., Sorrell, J., Stephenson, K. and Duff, G.W. (
Buchs, N., di Giovine, F.S., Silvestri, T., Vannier, E., Duff, G.W. and Miossec, P. (
Kornman, K.S. and Duff, G.W. (
El-Omar, E.M. (
El-Omar, E.M., Rabkin, C.S., Gammon, M.D., Vaughan, T.L., Risch, H.A., Schoenberg, J.B., Stanford, J.L., Mayne, S.T., Goedert, J., Blot, W.J. et al. (
Muraki, Y., Tsutsumi, A., Takahashi, R., Suzuki, E., Hayashi, T., Chino, Y., Goto, D., Matsumoto, I., Murata, H., Noguchi, E. et al. (
Momiyama, Y., Hirano, R., Taniguchi, H., Nakamura, H. and Ohsuzu, F. (
Meisel, P., Schwahn, C., Gesch, D., Bernhardt, O., John, U. and Kocher, T. (
Aisen, P.S. (
Grimaldi, L.M., Casadei, V.M., Ferri, C., Veglia, F., Licastro, F., Annoni, G., Biunno, I., De Bellis, G., Sorbi, S., Mariani, C. et al. (
Licastro, F., Veglia, F., Chiappelli, M., Grimaldi, L.M. and Masliah, E. (
Keen, R.W., Woodford-Richens, K.L., Lanchbury, J.S. and Spector, T.D. (
Langdahl, B.L., Lokke, E., Carstens, M., Stenkjaer, L.L. and Eriksen, E.F. (
Machado, J.C., Pharoah, P., Sousa, S., Carvalho, R., Oliveira, C., Figueiredo, C., Amorim, A., Seruca, R., Caldas, C., Carneiro, F. et al. (
McGeer, P.L., Yasojima, K. and McGeer, E.G. (
Schulte, T., Schols, L., Muller, T., Woitalla, D., Berger, K. and Kruger, R. (
Camargo, J.F., Correa, P.A., Castiblanco, J. and Anaya, J.M. (
Nemetz, A., Toth, M., Garcia-Gonzalez, M.A., Zagoni, T., Feher, J., Pena, A.S. and Tulassay, Z. (
Hsieh, C.C., Tsai, F.J., Chow, W.C., Wu, C.R. and Kobayashi, H. (
Guasch, J.F., Bertina, R.M. and Reitsma, P.H. (
Kominato, Y., Galson, D., Waterman, W.R., Webb, A.C. and Auron, P.E. (
Listman, J.A., Wara-Aswapati, N., Race, J.E., Blystone, L.W., Walker-Kopp, N., Yang, Z. and Auron, P.E. (
Patikoglou, G.A., Kim, J.L., Sun, L., Yang, S.H., Kodadek, T. and Burley, S.K. (
Zhang, G., Zhang, L. and Duff, G.W. (
Schug, J. and Overton, G.C. (
Mwantembe, O., Gaillard, M.C., Barkhuizen, M., Pillay, V., Berry, S.D., Dewar, J.B. and Song, E. (
Ness, R.B., Haggerty, C.L., Harger, G. and Ferrell, R. (
Hacking, D., Knight, J.C., Rockett, K., Brown, H., Frampton, J., Kwiatkowski, D.P., Hull, J. and Udalova, I.A. (
Raisz, L. (
di Giovine, F.S., Camp, N., Cox, A., Chaudhary, A., Crane, A. and Duff, G. (
Slade, G.D., Ghezzi, E.M., Heiss, G., Beck, J.D., Riche, E. and Offenbacher, S. (
Schaid, D.J., Rowland, C.M., Tines, D.E., Jacobson, R.M. and Poland, G.A. (
Excoffier, L. and Slatkin, M. (
