


Abstract
Background: A 70-gene signature was previously shown to have prognostic value in patients with node-negative breast cancer. Our goal was to validate the signature in an independent group of patients. Methods: Patients (n = 307, with 137 events after a median follow-up of 13.6 years) from five European centers were divided into high- and low-risk groups based on the gene signature classification and on clinical risk classifications. Patients were assigned to the gene signature low-risk group if their 5-year distant metastasis–free survival probability as estimated by the gene signature was greater than 90%. Patients were assigned to the clinicopathologic low-risk group if their 10-year survival probability, as estimated by Adjuvant! software, was greater than 88% (for estrogen receptor [ER]–positive patients) or 92% (for ER-negative patients). Hazard ratios (HRs) were estimated to compare time to distant metastases, disease-free survival, and overall survival in high- versus low-risk groups. Results: The 70-gene signature outperformed the clinicopathologic risk assessment in predicting all endpoints. For time to distant metastases, the gene signature yielded HR = 2.32 (95% confidence interval [CI] = 1.35 to 4.00) without adjustment for clinical risk and hazard ratios ranging from 2.13 to 2.15 after adjustment for various estimates of clinical risk; clinicopathologic risk using Adjuvant! software yielded an unadjusted HR = 1.68 (95% CI = 0.92 to 3.07). For overall survival, the gene signature yielded an unadjusted HR = 2.79 (95% CI = 1.60 to 4.87) and adjusted hazard ratios ranging from 2.63 to 2.89; clinicopathologic risk yielded an unadjusted HR = 1.67 (95% CI = 0.93 to 2.98). For patients in the gene signature high-risk group, 10-year overall survival was 0.69 for patients in both the low– and high–clinical risk groups; for patients in the gene signature low-risk group, the 10-year survival rates were 0.88 and 0.89, respectively. Conclusions: The 70-gene signature adds independent prognostic information to clinicopathologic risk assessment for patients with early breast cancer.
Microarray technology is revolutionizing our understanding of cancer biology through the simultaneous study of the expression of tens of thousands of genes, or even of the entire human genome. Differential gene expression or molecular profiling has the potential to substantially refine cancer prognosis, well beyond what is currently possible with the clinical and pathologic indicators used thus far for this purpose. Several studies have recently used microarrays to classify breast tumors on the basis of their gene expression profiles ( 1 – 7 ) . These studies have consistently revealed considerable molecular diversity in breast cancer that often corresponds to distinct clinical phenotypes. Two major types, basal and luminal, have been identified by gene expression profiling of breast cancer, each with the potential to be subdivided into two or three subtypes. In addition, these molecular portraits seem to be remarkably stable as tumors progress from primary to metastatic disease ( 8 ) .
In one of the microarray studies ( 5 ) , investigators from the Netherlands Cancer Institute in Amsterdam (NKI) studied a narrowly defined subset of breast cancer patients, i.e., those aged 55 years or younger who were diagnosed with tumors smaller than 5 cm (T1/T2), had no nodal involvement (N0) or metastases (M0), and were treated only with local–regional therapies. The expression of 231 genes was found to be statistically significantly associated with disease outcome, as defined by the presence of distant metastasis within 5 years. This group of genes was reduced subsequently to a core set of 70 genes that together constituted a signature of substantial prognostic ability. The investigators also tested whether the 70-gene signature could identify patients who would need adjuvant chemotherapy and compared this prognostication with that of the widely accepted National Institutes of Health and St Gallen guidelines for treatment of node-negative breast cancer ( 9 , 10 ) . The 70-gene signature correctly identified not only the patients who needed adjuvant chemotherapy but also those who did not need adjuvant chemotherapy, leading to a 20%–30% reduction in the number of women who would otherwise receive chemotherapy without compromising long-term clinical outcome. The 70-gene signature was then applied to a larger test set of 295 breast cancer patients from the same institution, and the results confirmed that the signature could clearly distinguish patients according to their 10-year survival outcome ( 6 ) .
Since the publication of these results, a number of authors have highlighted critical issues in the use of microarray data for prognostic classification, including gene selection bias, error estimation, fragility of gene signatures, and overoptimistic performance estimation due to model overfit ( 11 – 13 ) . Moreover, as promising as gene signatures are, it still needs to be proven that they provide additional information to the clinicopathologic risk criteria that are currently used in the clinic. Some authors have expressed doubts that they will add further prognostic value to that provided by the best risk classifications based on factors such as age, tumor size, tumor grade, nodal involvement, and presence of hormonal receptors ( 9 , 10 , 14 – 17 ) .
If the clinical utility of gene signatures can be established—that is, if they prove to reliably identify patients in whom adjuvant chemotherapy is definitely not indicated despite having poor clinical risk factors and patients who need chemotherapy despite having good clinical risk factors—they will have enormous potential for better individualization of treatment options in breast cancer therapy ( 18 ) . This potential—and the use of gene signatures in prognostication—requires that the recently proposed gene signatures be validated independently, preferably by teams external to the original institutions, using prospectively defined criteria. In this paper, we describe the results of a multinational collaborative initiative conducted under the aegis of the TRANSBIG consortium aimed at validating the 70-gene signature in breast cancer.
S UBJECTS AND M ETHODS
Patients
This validation study was carried out with tumor samples and clinical data from patients seen at five European centers: Institut Gustave Roussy, Villejuif, France; Karolinska Institute, Stockholm, Sweden; Centre René Huguenin, Saint-Cloud, France; Guy's Hospital, London, U.K.; and John Radcliffe Hospital, Oxford, U.K. Patients were eligible for inclusion if they were younger than 61 years old at diagnosis, diagnosed before 1999 with node-negative, T1–T2 (≤5 cm) breast cancer, and had not received adjuvant systemic therapy. Patients with previous malignancies (except basal cell carcinoma) or with bilateral synchronous breast tumors were excluded. A total of 326 patients were included in what is hereafter referred to as the “validation” series. Patients in this series had been diagnosed between 1980 and 1998 and had a median follow-up of 13.6 years. Data were also available for the 151 node-negative patients included in the analyses carried out at the NKI to validate the 70-gene signature, hereafter referred to as the “original” series ( 6 ) . The validation protocol was finalized in July 2004. All institutional ethics committees approved the use of the tumor material for the purposes described in this article, and patients provided written informed consent.
Tumor Samples and Data Analysis
Initially, frozen samples from eligible patients (n = 403) were sent from all clinical centers to NKI for RNA extraction and microarray analysis, as previously described ( 5 ) . Useful RNA could be extracted for hybridization and analysis from 81% of these frozen samples, leaving 326 samples available for analysis. Paraffin-embedded tumor samples from all patients in both the original and the validation series were sent to the Department of Pathology at the European Institute of Oncology, Milan, where the same pathologist (GV) determined estrogen receptor (ER) status [using immunohistochemistry ( 19 ) ] and histologic grade [using the Elston and Ellis method ( 20 ) ]. Whenever possible, these central pathology data were used to determine ER status (n = 218) and histologic grade (n = 237); otherwise the local pathology data obtained at the original clinical center were used. Clinical centers were visited by two independent auditors who carried out source data verification of all data in the validation series. Clinical, pathologic, and gene signature data were centralized at the TRANSBIG Secretariat at Institut Jules Bordet. Statistical analyses were carried out by the International Drug Development Institute, Brussels, Belgium.
Gene Signature Risk Classification
Microarray analysis was performed at Agendia Laboratories, a spinoff company of the NKI, using a custom-designed array chip known as Mammaprint. This array chip assesses the mRNA expression of the 70 genes in triplicate and was manufactured by Agilent Technologies using the Agilent oligonucleotide microarray platform. A tumor was defined as having a low-risk gene signature if the Pearson correlation coefficient for the expression of the 70-gene profile in that tumor with the previously established classifier was above 0.4, the cut point used in the original study ( 5 ) . The previously established classifier defined good prognosis as a probability of 5-year distant metastasis–free survival of more than 90% ( 5 ) . The gene signature risk classification was given as a dichotomized value only: high or low risk. Raw microarray data and clinical information are available at the European Bioinformatics Institute ArrayExpress database ( http://www.ebi.ac.uk/arrayexpress/ ), accession number E-TABM-77. Normalized microarray data were archived by the Swiss Institute of Bioinformatics, where a study statistician (MD) reviewed and independently applied Agendia's proprietary analysis program to the normalized microarray raw data to reproduce the risk classification. The risk classification agreement between Swiss Institute of Bioinformatics and Agendia was assessed by independent study statisticians (MB, MA, FP). The concordance between the risk classification produced by Agendia and the external team was 100% as verified by the independent statisticians.
Clinical Risk Classification
The aim of this validation study was to examine whether the 70-gene signature had prognostic value independent of the best clinical risk classifications. The prognostic value of the gene signature was first assessed with respect to the St Gallen criteria ( 9 ) and the Nottingham Prognostic Index (NPI) ( 15 ) . Patients with an NPI score of less than or equal to 3.4, the standard NPI cut point, were classified as low risk. However, the St Gallen criteria classified very few patients as low risk, and the NPI takes neither the patient's age nor the ER status of her tumor into account. The prognostic value of the gene signature was, therefore, also assessed using the recently introduced Adjuvant! software [ http://www.adjuvantonline.com ( 16 ) ], which calculates 10-year survival probability based on the patient's age, tumor size and grade, tumor ER status, and nodal status (which was negative for all patients in this study). In a recent external validation, Adjuvant! software was shown to accurately predict overall survival, breast cancer–specific survival, and event-free survival in 4083 women diagnosed with early breast cancer in British Columbia between 1989 and 1993 ( 21 ) .
Although it is possible to use the outcomes produced by Adjuvant! software as a continuous variable, clinical decision making assumes a dichotomization into a low- and a high-risk group. It was decided by consensus among the TRANSBIG Consortium members (see http://www.breastinternationalgroup.org ) that the low–clinical risk group would be defined as patients with 10-year overall survival probabilities (as calculated by Adjuvant! software, version 7.0) of at least 88% if 10% or more of the tumor cells expressed detectable ER (i.e., ER-positive tumors) and of at least 92% if ER expression was seen in less than 10% of the tumor cells (i.e., ER-negative tumors). These two cutoffs were chosen to reflect the fact that patients with ER-positive tumors routinely receive adjuvant endocrine therapy [with an estimated absolute 10-year survival benefit of approximately 4% overall ( 22 ) ], although none of the patients in the validation series received adjuvant endocrine therapy, regardless of their ER status. However, to rule out the possibility that our results were dependent on the choice of clinical cutoff, we carried out a sensitivity analysis in which we varied the 10-year overall survival probability cutoff that defined low risk, as predicted by Adjuvant! software, from 60% (in which case most patients were classified in the low–clinical risk group) to 95% (in which case most patients were classified in the high–clinical risk group), without distinction between ER-positive and -negative patients.
Endpoints
We analyzed three main endpoints: time from surgery to distant metastases, which was the endpoint used to identify the gene signature ( 5 ) (all other events were ignored for this endpoint); overall survival, which was defined as time from surgery to death from any cause; and disease-free survival, which was defined as time from surgery to any recurrence (local or regional), second breast primary, distant metastasis, or death from any cause. The Kaplan–Meier product-limit estimator was used to display time-to-event curves for these three endpoints.
Validation Strategy
Validation of the gene signature was based on the estimation of hazard ratios, which were used to quantify the relative risk of an event in the high-risk group compared with the low-risk group. A hazard ratio above 1.0 indicates that patients in the high-risk group have a higher probability of an event (distant metastasis, death from any cause, or recurrence or death) than patients in the low-risk group for the outcomes considered (time to distant metastasis, overall survival, and disease-free survival, respectively). Hazard ratios were stratified by clinical center to account for possible heterogeneity in patient selection or other potential confounders among the various centers. Hazard ratios for the risk groups defined by the gene signature were estimated with stratification for clinical risk to reflect the prognostic impact of the gene signature over and above that of clinicopathologic factors (adjusted hazard ratios).
The adjusted hazard ratios (with their 95% confidence intervals [CIs]) for the five institutions that supplied patients for this study were displayed on forest plots and tested for heterogeneity using a chi-square test with four degrees of freedom. The impact of the duration of follow-up on the adjusted hazard ratios was analyzed by censoring all observations at increasing time points.
We estimated that approximately 100 patients with a cancer-related event would be needed for the validation to yield results with both clinical relevance (i.e., doubling of the risk of an event) and statistical significance (i.e., a power of 90% to detect a hazard ratio of 2.0 or greater at a statistical significance level of .05). After a median follow-up of 13.6 years, a total of 137 patients in the validation series had at least one event. These events included 68 recurrences, 31 second primary cancers, 77 distant metastases, and 82 deaths.
Sensitivity and Specificity
Sensitivity and specificity were estimated for both risk assessments (i.e., the gene signature and clinicopathologic assessments) for distant metastases within 5 years (the endpoint used to derive the gene signature) and for death within 10 years (the endpoint used to define the clinical cutoff when using Adjuvant! software). Sensitivity was defined as the probability that a patient who experienced the event of interest was in the high-risk group and specificity as the probability that a patient who did not experience the event of interest was in the low-risk group. Time-dependent receiver operating characteristic (ROC) curves ( 23 ) were computed by using the tumor expression level for the gene signature ( 5 ) and the 10-year survival probability for the Adjuvant! software ( 17 ) .
R ESULTS
Patients Included in the Analyses
Data on tumor size were missing for three of the 326 patients in the validation series, and 16 patients were found to be ineligible in the independent data verification (for 10 patients, only comedocarcinoma or ductal carcinoma in situ was detected at central pathology review; two patients had metastatic disease at the time of diagnosis; one patient had a bilateral breast cancer; one patient had a previous malignancy; one patient was older than 61 years; and one patient had a tumor that was larger than 5 cm). Of the remaining 307 patients, data on ER status were missing for five patients. All analyses were repeated with the inclusion of the ineligible patients, and the results were similar (data not shown).
Patient Characteristics
The 70-gene signature risk classification was assessed for each tumor, and tumors were scored as low or high risk according to the previously established classifier ( 5 ) . Table 1 shows the characteristics of the 302 patients of the validation series for whom clinical risk could be calculated using the Adjuvant! software (i.e., the patients for whom data on ER status were available). The patients were divided into four groups according to their clinical and gene signature risks. Analysis of 10-year survival data ( Table 1 ) showed that, for patients in the gene signature high-risk category, the 10-year overall survival was 0.69 for patients in both low– and high–clinical risk groups, whereas for patients in the gene signature low-risk category, the 10-year survivals were 0.88 and 0.89, respectively. The Kaplan–Meier estimates of time to distant metastases, overall survival, and disease-free survival for the four groups of patients ( Fig. 1 ) suggest that, for groups with discordant risk assessments (i.e., high risk according to one risk classifier and low risk according to the other), the gene signature provided stronger prognostic information than the clinicopathologic criteria.
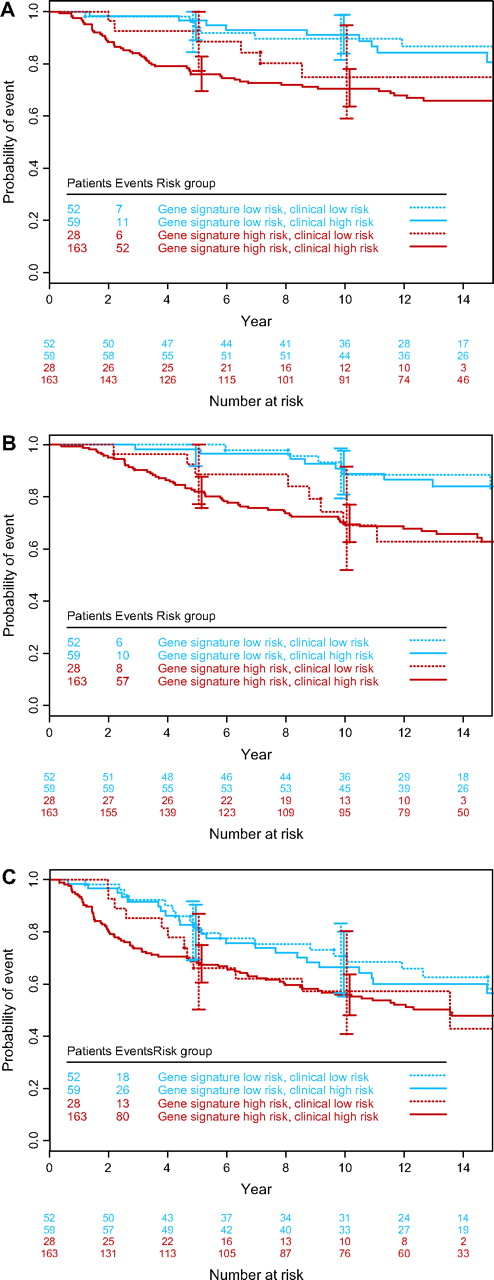
Kaplan–Meier curves by clinical and gene signature risk groups. A ) Time to distant metastases. B ) Overall survival. C ) Disease-free survival. Error bars show 95% confidence intervals.
Characteristics of patients in the validation series according to their clinical and gene signature risks *
| Clinical low risk | Clinical high risk | |||||
|---|---|---|---|---|---|---|
| Characteristic | Gene signature low risk (n = 52) | Gene signature high risk (n = 28) | Gene signature low risk (n = 59) | Gene signature high risk (n = 163) | ||
| Age, y | ||||||
| <41 | 8 | 1 | 9 | 40 | ||
| 41–50 | 36 | 22 | 20 | 67 | ||
| 51–60 | 8 | 5 | 30 | 56 | ||
| Tumor size | ||||||
| T1ab (<1 cm) | 5 | 4 | 0 | 2 | ||
| T1c (1–2 cm) | 30 | 12 | 17 | 40 | ||
| T2 (2–5 cm) | 17 | 12 | 42 | 121 | ||
| Tumor grade | ||||||
| Good differentiation | 22 | 12 | 7 | 6 | ||
| Intermediate differentiation | 29 | 16 | 41 | 39 | ||
| Poor differentiation | 0 | 0 | 11 | 113 | ||
| Unknown | 1 | 0 | 0 | 5 | ||
| Estrogen receptor status | ||||||
| Positive | 52 | 28 | 54 | 78 | ||
| Negative | 0 | 0 | 5 | 85 | ||
| Proportion alive at 10 y (95% confidence intervals) | 0.88 (0.74 to 0.95) | 0.69 (0.45 to 0.84) | 0.89 (0.77 to 0.95) | 0.69 (0.61 to 0.76) | ||
Although the validation series included 307 patients, those whose clinical risk could not be calculated due to missing values for any of the variables were excluded (n = 5).
Unadjusted and Adjusted Hazard Ratios
The unadjusted hazard ratios for the three outcomes in high- versus low-risk patients as defined by traditional individual clinicopathologic factors and by various risk classifications are shown in Table 2 . The prognostic value of the gene signature was stronger than that of the individual traditional risk factors and of the commonly used clinicopathologic risk classifications. The unadjusted gene signature hazard ratio for time to distant metastases was 2.32 (95% CI = 1.35 to 4.00), higher than that for any of the other risk factors or classifications. Adjustment of the gene signature hazard ratio for the St Gallen criteria, for the NPI, and for the clinical risk groups based on 10-year survival probability as calculated by Adjuvant! software resulted in gene signature hazard ratios of 2.15 (95% CI = 1.25 to 3.71), 2.15 (95% CI = 1.19 to 3.92), and 2.13 (95% CI = 1.19 to 3.82), respectively. The gene signature hazard ratio for overall survival was 2.79 (95% CI = 1.60 to 4.87) without adjustment and 2.69 (95% CI = 1.53 to 4.73), 2.89 (95% CI = 1.58 to 5.29), and 2.63 (95% CI = 1.45 to 4.79) with the respective adjustments. The gene signature hazard ratio for disease-free survival was 1.50 (95% CI = 1.04 to 2.16) without adjustment and 1.41 (95% CI = 0.97 to 2.06), 1.45 (95% CI = 0.97 to 2.16), and 1.36 (95% CI = 0.91 to 2.03) with the respective adjustments.
Hazard ratios (with 95% confidence intervals) and P values for individual risk factors and risk classifications
| Risk factor or classification | Time to distant metastases | Overall survival * | Disease-free survival † |
|---|---|---|---|
| Age (≤50y versus >50y) | 0.86 (0.54 to 1.37) | 0.84 (0.54 to 1.32) | 1.17 (0.82 to 1.68) |
| P = .52 | P = .46 | P = .40 | |
| Tumor size (T2 versus T1) | 1.42 (0.90 to 2.23) | 1.36 (0.87 to 2.12) | 1.20 (0.85 to 1.68) |
| P = .14 | P = .18 | P = .31 | |
| Tumor grade (good versus intermediate versus poor differentiation) | 0.76 (0.54 to 1.07) | 0.82 (0.60 to 1.14) | 0.96 (0.75 to 1.22) |
| P = .12 | P = .25 | P = .72 | |
| Estrogen receptor status (negative versus positive) | 2.18 (1.37 to 3.48) | 2.36 (1.50 to 3.72) | 1.49 (1.03 to 2.14) |
| P = .001 | P <.001 | P = .033 | |
| Adjuvant! software (high risk versus low risk) | 1.68 (0.92 to 3.07) | 1.67 (0.93 to 2.98) | 1.30 (0.86 to 1.95) |
| P = .092 | P = .085 | P = .21 | |
| Nottingham Prognostic Index (high risk versus low risk) ‡ | 1.65 (1.02 to 2.66) | 1.49 (0.94 to 2.36) | 1.10 (0.78 to 1.56) |
| P = .043 | P = .092 | P = .58 | |
| St Gallen criteria (high risk versus low risk) § | 2.22 (0.70 to 7.08) | 1.69 (0.62 to 4.66) | 2.18 (0.96 to 4.96) |
| P = .18 | P = .31 | P = .064 | |
| Gene signature (high risk versus low risk) ‖ | 2.32 (1.35 to 4.00) | 2.79 (1.60 to 4.87) | 1.50 (1.04 to 2.16) |
| P = .002 | P <.001 | P = .032 |
The reverse analysis was also performed, i.e., the hazard ratios for the clinical risk classifications were adjusted for the gene signature. For the risk classification according to the Adjuvant! software, the unadjusted hazard ratio for time to distant metastases was 1.68 (95% CI = 0.92 to 3.07) without adjustment and 1.26 (95% CI = 0.66 to 2.40) when adjusted for the gene signature; for overall survival, the hazard ratios were 1.67 (95% CI = 0.93 to 2.98) without adjustment and 1.08 (95% CI = 0.59 to 1.99) with adjustment; and for disease-free survival, the hazard ratios were 1.30 (95% CI = 0.86 to 1.95) without adjustment and 1.03 (95% CI = 0.67 to 1.59) with adjustment.
Heterogeneity Among Centers and Between Patient Series
Forest plots of the gene signature hazard ratios for each center, adjusted for the clinical risk groups as defined by the Adjuvant! software ( Fig. 2, A–C ), indicated that there was no statistically significant heterogeneity among the five centers from which the validation series was drawn for any of the endpoints considered. However, statistically significant heterogeneity was apparent between the validation series and the original series, with the latter series showing much larger hazard ratios for all endpoints considered. By contrast, forest plots of the Adjuvant! software clinical risk hazard ratios, adjusted for the gene signature ( Fig. 2, D–F ), revealed no statistically significant heterogeneity among the different centers of the validation series or between the validation series and the original series for any of the endpoints.
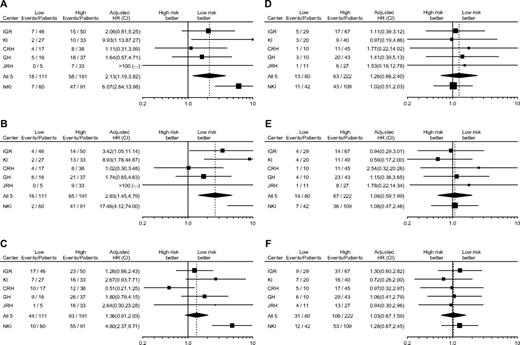
Forest plots of hazard ratios (HRs) and 95% confidence intervals (CIs) for each event in the high-risk versus low-risk groups for the gene signature and clinical risk classifiers. ( A–C ) Hazard ratios for the gene signature classification, adjusted for clinical risk based on the 10-year survival probability as calculated by Adjuvant! software. ( D–F ) Hazard ratios for the Adjuvant! software classification, adjusted for the gene signature risk. ( A and D ) Time to distant metastases. ( B and E ) Overall survival. ( C and F ) Disease-free survival. Numbers of events and patients in each risk group are indicated. IGR = Institut Gustave Roussy; KI = Karolinska Institute; CRH = Centre René Huguenin; GH = Guy's Hospital; JRH = John Radcliffe; NKI = Netherlands Cancer Institute; squares = HRs; lines = 95% CIs; diamond = HR and 95% CI for all five institutions in the validation series (IGR, KI, CRH, GH, and JRH) combined. Size of squares is inversely proportional to the variance of the hazard ratio in each center.
Impact of Clinical Risk Cutoff
In a sensitivity analysis, we varied the cutoffs that defined low risk in the Adjuvant! software and used the resulting clinical risk groups to adjust the gene signature hazard ratios ( Fig. 3 ). The adjusted gene signature hazard ratios were statistically significant ( P values not shown), regardless of the cutoff chosen, for both time to distant metastases and overall survival. However, for disease-free survival most, but not all, cutoffs achieved only borderline statistical significance.
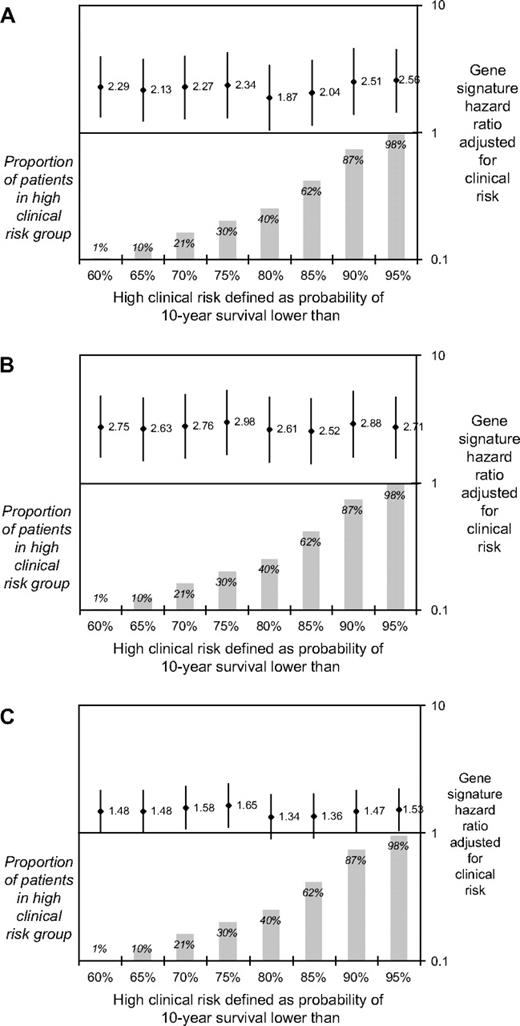
Hazard ratios (and 95% confidence intervals) for gene signature high-risk versus low-risk groups, adjusted for the clinical risk groups based on 10-year survival probability as calculated by Adjuvant! software. The x-axis indicates the cutoff points of the 10-year survival probabilities used to define high clinical risk in the adjustment. A ) Time to distant metastases; B ) overall survival; and C ) disease-free survival. Diamonds , hazard ratios; vertical lines , 95% confidence intervals; shaded bars , proportion of patients in each high–clinical risk group as defined by each cutoff for 10-year survival.
Impact of Follow-up Duration
The analyses reported above were carried out without arbitrary censoring of observations. However, because the median follow-up time in the original series was less than half that of the validation series (6.7 years versus 13.6 years, respectively), we also calculated the gene signature hazard ratios adjusted for clinical risk groups as defined by Adjuvant! software with arbitrary censoring of all observations at increasing time points. As shown in Fig. 4 , the adjusted gene signature had the greatest prognostic value (as shown by the highest hazard ratio) at identifying patients at high risk of an event within 5 years. These analyses suggest that the different duration of follow-up may explain some of the discrepancy in hazard ratios reported between the original series and the current validation series.
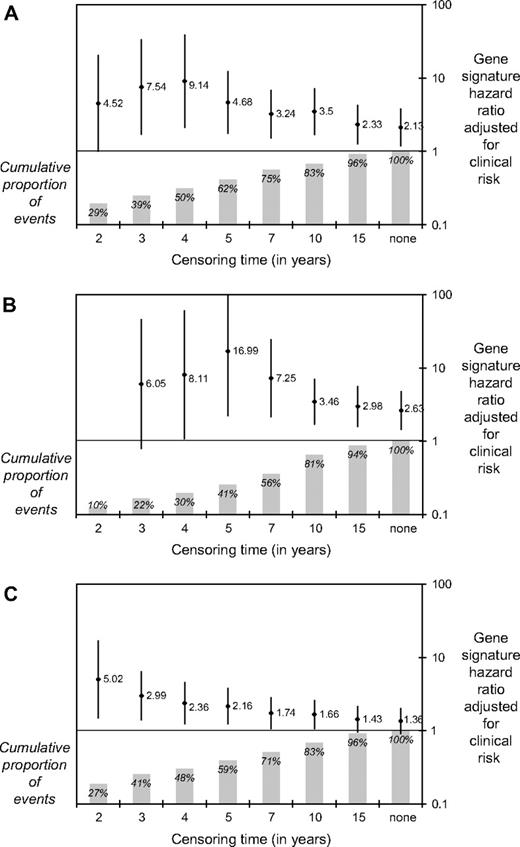
Hazard ratios (and 95% confidence intervals) for gene signature high-risk versus low-risk groups, adjusted for clinical risk groups based on 10-year survival probability as calculated by Adjuvant! software, for increasing arbitrary censoring times. The x-axis indicates the time at which all observations were censored. A ) Time to distant metastases; B ) overall survival; and C ) disease-free survival. Diamonds , hazard ratios; vertical lines , 95% confidence intervals; shaded bars , proportion of patients in each time point. It should be noted that when the data were censored at 2 years, all eight events were in the high-risk group and no hazard ratio could be estimated.
Sensitivity and Specificity
Time-dependent ROC curves ( Fig. 5 ) showed that the predictive accuracy of the gene signature was as least as good as that of Adjuvant! software, with a high sensitivity (i.e., a low probability of falsely classifying a patient as low risk). The sensitivities for distant metastases within 5 years and for death within 10 years were similar for the gene signature and for the various clinicopathologic risk assessments ( Table 3 ). The specificity, however, was higher for the gene signature than for Adjuvant!. Among the 215 patients with a concordant risk classification by the Adjuvant! software and the gene signature, the sensitivity of the Adjuvant! software was slightly higher than that of the gene signature and the specificity was slightly lower. In contrast, among the 87 patients with a discordant gene signature and Adjuvant! risk classification, the sensitivity of the Adjuvant! software was very poor, as was also suggested by the Kaplan–Meier analyses ( Fig. 1 ).
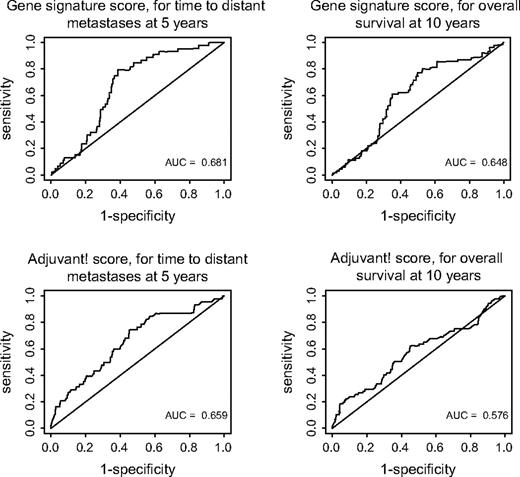
Receiver operating characteristic (ROC) curves of gene signature and of Adjuvant! software. ( top ) ROC curves for metastases within 5 years ( left ) and for death within 10 years ( right ) for gene signature, using the Agendia score (correlation of the gene signature with the previously established classifier). ( bottom ) ROC curves for metastases within 5 years ( left ) and for death within 10 years ( right ) for Adjuvant! software, using the score generated by the Adjuvant! online software. AUC = area under the curve.
Sensitivity and specificity (with 95% confidence intervals) of gene signature and of clinicopathologic risk assessments for metastases within 5 years and for death within 10 years *
| Number of patients in risk groups | Metastases within 5 years | Deaths within 10 years | |||||||
|---|---|---|---|---|---|---|---|---|---|
| Risk classification | High risk | Low risk | Sensitivity | Specificity | Sensitivity | Specificity | |||
| Gene signature | 194 | 113 | 0.90 (0.78 to 0.95) | 0.42 (0.36 to 0.48) | 0.84 (0.73 to 0.92) | 0.42 (0.36 to 0.48) | |||
| Adjuvant! software | 222 | 80 | 0.87 (0.75 to 0.94) | 0.29 (0.24 to 0.35) | 0.82 (0.71 to 0.90) | 0.29 (0.23 to 0.35) | |||
| Nottingham Prognostic Index | 169 | 130 | 0.79 (0.65 to 0.88) | 0.48 (0.42 to 0.54) | 0.70 (0.57 to 0.80) | 0.47 (0.41 to 0.53) | |||
| St Gallen criteria | 274 | 27 | 0.96 (0.86 to 0.99) | 0.10 (0.07 to 0.14) | 0.95 (0.86 to 0.98) | 0.10 (0.07 to 0.14) | |||
| Adjuvant! software concordant with gene signature | 163 | 52 | 0.93 (0.81 to 0.98) | 0.28 (0.22 to 0.35) | 0.90 (0.78 to 0.95) | 0.28 (0.22 to 0.35) | |||
| Adjuvant! software discordant with gene signature | 59 † | 28 ‡ | 0.40 (0.12 to 0.77) | 0.30 (0.22 to 0.41) | 0.44 (0.19 to 0.73) | 0.29 (0.21 to 0.40) | |||
Number of patients who could not be classified because of missing clinical data was as follows: five for the Adjuvant! software, eight for the Nottingham Prognostic Index, and six for the St Gallen criteria.
Clinical high risk, gene signature low risk.
Clinical low risk, gene signature high risk.
D ISCUSSION
Our analyses confirm that the 70-gene signature ( 5 ) is a strong prognostic factor for time to distant metastases and overall survival in untreated patients with node-negative breast cancer, with unadjusted hazard ratios of 2.32 (95% CI = 1.35 to 4.00) and 2.79 (95% CI = 1.60 to 4.87), respectively. The signature remained a statistically significant prognostic factor for time to distant metastases and survival even after adjustment for various risk classifications that take into account all clinicopathologic factors known to have prognostic value in this disease. In particular, when adjusted for the clinical risk groups based on 10-year survival probability as calculated by the Adjuvant! software, the gene signature hazard ratios were 2.13 (95% CI = 1.19 to 3.82) for time to distant metastases, 2.63 (95% CI = 1.45 to 4.79) for overall survival, and 1.36 (95% CI = 0.91 to 2.03) for disease-free survival ( Fig. 2 ). (The lack of statistical significance for disease-free survival is not surprising because the signature was developed using only time to distant metastases as an endpoint.) These results indicate that the gene signature adds independent prognostic information to that provided by a risk assessment based solely on clinicopathologic factors.
Interestingly, when the reverse analysis was performed, i.e., when clinical risk hazard ratios were adjusted for the gene signature, none of the clinical risk classifications retained statistical significance ( Fig. 2 ). This finding suggests that most of the information provided by risk groups based on clinicopathologic factors is subsumed by the gene signature. The Kaplan–Meier curves ( Fig. 1 ) provide additional evidence for this conclusion in that within each gene signature risk group the curves for low– versus high–clinical risk groups were close to each other. For patients in the gene signature high-risk group, the point estimate of 10-year survival was 0.69 in both the low– and high–clinical risk groups, and for patients in the gene signature low-risk group, the point estimates of 10-year survival were 0.88 and 0.89, respectively ( Table 1 ), thus demonstrating the higher discriminatory prognostic ability of the gene signature.
We also found that the prognostic value of the gene signature was almost completely independent of the definition of clinical risk. That is, a series of adjustments for clinical risk using varying cutoff points in the Adjuvant! software produced only minor changes in the gene signature hazard ratios ( Fig. 3 ). The approach used in our analyses—i.e., estimating adjusted hazard ratios through stratification—is preferable to a multivariable analysis because it does not require any assumption of proportional hazards for either the gene signature or the clinicopathologic factors. Moreover, it is less sensitive to random fluctuations in the data and multicolinearity between the variables, which may lead to model instability in multivariable analysis ( 24 ) .
There was no evidence of heterogeneity among the various centers participating in the validation study for any of the endpoints ( Fig. 2 ). In contrast, there was striking evidence of heterogeneity between the validation and the original series ( 6 ) : the hazard ratios in the original series were much higher than those in the validation series for risk classifications based on either the clinicopathologic factors or the gene signature. The gene signature hazard ratio also remained much higher after adjustment in the original series ( 6 ) than in the current validation series. It has previously been noted ( 12 ) that the inclusion in the original series of patients whose data were used in the development of the 70-gene signature may have inflated the discriminatory power of the signature in that study, even though analytic measures had been taken to limit this effect ( 12 ) . It should also be noted that the only clinical factor that reached statistical significance in the validation series was ER status, which suggests that the selection of patients who had not received systemic adjuvant treatment in the validation series may have yielded a sample of node-negative breast cancer patients with a relatively better outcome than what would be expected in a population-based series. All clinical data were carefully reviewed by independent site audits, so it is unlikely that the quality of these data could have affected our results to an extent sufficient to explain the differences between the results of the validation and original series. Likewise, it seems unlikely that a problem with the quality of the pathologic data in the validation series could explain the differences with the original series. When the analysis was restricted to patients for whom both centrally and locally reviewed pathology data were available, the results were almost identical regardless of whether the central or local pathology data were used (data not shown). A plausible explanation for the observed discrepancy between the validation series and the original series is the difference in follow-up time [13.6 years for the validation series and 6.7 years for the original series ( 6 ) ]. As Fig. 4 shows, the behavior of the adjusted hazard ratio of the gene signature shows substantial variation over time, suggesting that the ability of the gene signature to identify those who will develop distant relapse is greatest within 5 years of diagnosis.
The differences in the results from the original and validation series, whatever their cause, underline the need to validate gene signatures on independent datasets from patients with sufficiently long follow-up before they can be used routinely in the clinic for prognostic or predictive purposes. The very long follow-up of patients in our validation series enabled us to demonstrate that the risk classification by gene signature provides additional independent prognostic information from that of clinicopathologic features ( Fig. 3 ) but is highly dependent on censoring time ( Fig. 4 ). We also achieved our main objectives of the validation study, i.e., to determine whether the 70-gene signature had reproducible prognostic value across different patient populations, different laboratories, and different biostatistical facilities.
Although our results demonstrated that adjusted hazard ratios are a clinically useful measure to quantify the impact of the gene signature over and above that of clinicopathologic factors, predictive accuracy is the more relevant measure to use when comparing the prognostic performances of different risk classifications ( 24 , 25 ) . In the validation series, the areas under the ROC curves were slightly higher for the gene signature classification than for the Adjuvant! software classification ( Fig. 5 ). All risk classifications for patients with early breast cancer attempt to identify reliably patients at low risk of metastasis or death, i.e., to achieve high sensitivity, even if this comes at the cost of very low specificity. In this respect, the gene signature performed better than any of the classifications based on clinicopathologic factors ( Table 3 ). The sensitivity of the Adjuvant! software classification was somewhat improved when the gene signature was used to identify patients with concordant risks (low or high) by both classification systems. By contrast, the sensitivity of Adjuvant! software was very poor for patients with discordant risks by both classification systems.
Many clinicians and scientists have expressed concerns about the lack of overlap among the genes included in different prognostic gene signatures ( 13 , 26 ) . The reason for the selection of different genes to predict the same outcome has been attributed to differences among microarray platforms, to differences among genes used in the array, to differences among experimental conditions, and to chance. Another prognostic signature for node-negative breast cancer has recently been developed using Affymetrix technology ( 7 ) and validated using independent data from four European centers ( 27 ) . Although the Agilent-based and Affymetrix-based gene expression signatures have only three genes in common, it is possible that other genes included in these prognostic signatures may be involved in the same underlying biologic processes, and both gene signatures may be equally useful as prognostic tools ( 28 ) . The TRANSBIG consortium is currently evaluating the performance of the Affymetrix-based gene expression signature using the same methodology and patient series as described here.
The present validation study used retrospective data from patients who had not received systemic adjuvant therapy, who may not be completely representative of today's node-negative early-stage breast cancer population. Nevertheless, we believe that the results justify proceeding to a prospective study. The goal of our study was to verify the independent prognostic value of the previously reported 70-gene signature in a population in which the results could not be confounded by treatment effects. Although most breast cancer patients currently receive endocrine treatment—e.g., women with ER-positive tumors currently receive tamoxifen—in the future they might receive another endocrine therapy (an aromatase inhibitor, for example), and the gene signature would still be applicable in identifying women with a poor clinical outcome. The large collaborative MINDACT (Microarray In Node-negative Disease may Avoid Chemotherapy Trial) conducted by the Breast International Group and coordinated by the European Organisation for the Research and Treatment of Cancer Breast Cancer Group will recruit 6000 women with node-negative early-stage breast cancer to investigate the benefit-to-risk ratio of chemotherapy when the risk assessment based on clinicopathologic factors differs from that provided by the gene signature ( Fig. 6 ) ( 29 ) . In particular, the focus will be on the groups of women who are discordant by the risk classifications to compare the clinical value of the gene signature with that of the Adjuvant! software. This discordant group will be randomly assigned to have their treatment (i.e., adjuvant chemotherapy) decision making dependent on either the gene signature or Adjuvant! software. We hypothesize that the low-risk group (as defined by the gene signature) will have an excellent distant metastases–free survival at 5 years without adjuvant chemotherapy, thus sparing a substantial proportion of women who previously would have received adjuvant chemotherapy (because they were deemed at high risk for relapse by Adjuvant! software) unnecessary toxicity. The trial will provide level-1 evidence about the clinical relevance of the 70-gene signature. Moreover, because biologic material (including frozen tumor samples) will be collected from all patients, this trial will have great potential for the identification and validation of additional gene signatures with better prognostic and predictive value in early breast cancer.
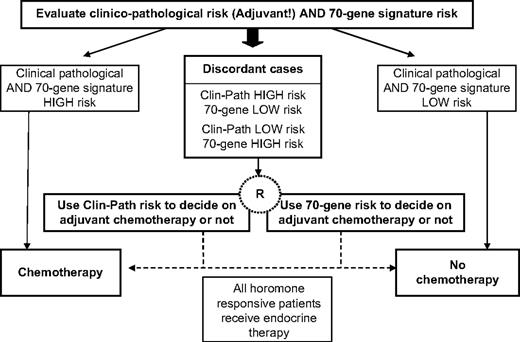
Design of MINDACT, which aims to spare 10%–15% of women with node-negative early-stage breast cancer adjuvant chemotherapy without compromising long-term disease outcome. Randomization will be between gene signature and Adjuvant! for adjuvant chemotherapy prescription for those cases discordant for risk classification by the two methods.
This work was partially supported by the European Commission Framework Programme VI (FP6-LSHC-CT-2004-503426), the Breast Cancer Research Foundation, the “Association le Cancer du Sein-Parlons-en,” and the J. Seroussi Foundation. The work of M. Delorenzi was also supported by the National Center of Competence in Research Molecular Oncology, a research program of the Swiss National Science Foundation.
All authors contributed to the manuscript. They are grateful to the many individuals who have made this work possible: N. Decker and C. Straehle (BIG/TRANSBIG Secretariat, Institut Jules Bordet, Brussels, Belgium) for project coordination; T. Bruinsma, R. Van Laar (Agendia B.V. Amsterdam, The Netherlands), V. Lazar (Institut Gustave Roussy, Villejuif, France), J. Smeds (Karolinska Institute, Stockholm, Sweden), A. Tutt, C. Gillet, K. Ryder (Guy's Hospital, London, U.K.), and M. Taylor (John Radcliffe Hospital, Oxford, U.K.) for data collection and tumor sample management; G. Decoster and J. Schlusselberg (IT & GCP Consulting) for clinical site audits; and P. Ravdin (University of Texas Health Science Center, San Antonio, TX) for helpful advice and use of the Adjuvant! software.
M. Buyse and S. Loi are co-first authors; M. J. Piccart and F. Cardoso are co-last authors.
L. van't Veer is a named inventor on a patent application for the 70-gene signature used in this study. L. van't Veer, A. M. Glas, and A. Floore are shareholders in and are employed by Agendia, the commercial entity that markets the 70-gene signature as Mammaprint. There are no other conflicts of interest. The first authors had full access to all the data in the study and take final responsibility for the decision to submit the study for publication. Apart from providing the Mammaprint chips, Agendia had no role in the design, conduct, analysis, or writing of the study.
Funding to pay the Open Access publication charges for this article was provided by the European Commission Framework Programme VI (FP6-LSHC-CT-2004-503426).
References
West M, Blanchette C, Dressman H, Huang E, Ishida S, Spang R, et al. Predicting the clinical status of human breast cancer by using gene expression profiles.
Sotiriou C, Neo SY, McShane LM, Korn EL, Long PM, Jazaeri A, et al. Breast cancer classification and prognosis based on gene expression profiles from a population-based study.
Sorlie T, Perou CM, Tibshirani R, Aas T, Geisler S, Johnsen H, et al. Gene expression patterns of breast carcinomas distinguish tumour subclasses with clinical implications.
Huang E, Cheng SH, Dressman H, Pittman J, Tsou MH, Horng CF, et al. Gene expression predictors of breast cancer outcomes.
van't Veer LJ, Dai H, van de Vijver MJ, He YD, Hart AA, Mao M, et al. Gene expression profiling predicts clinical outcome of breast cancer.
van de Vijver MJ, He YD, van't Veer LJ, Dai H, Hart AA, Voskuil DW, et al. A gene-expression signature as a predictor of survival in breast cancer.
Wang Y, Klijn J, Zhang Y, Sieuwerts A, Look MP, Atkins D, et al. Gene-expression profiles to predict distant metastasis of lymph-node-negative primary breast cancer.
Weigelt B, Glas AM, Wessels LF, Witteveen AT, Peterse JL, van't Veer LJ. Gene expression profiles of primary breast tumors maintained in distant metastases.
Goldhirsch A, Wood WC, Gelber RD, Coates AS, Thurlimann B, Senn HJ. Meeting highlights: updated international expert consensus on the primary therapy of early breast cancer.
Eifel P, Axelson JA, Costa J, Crowley J, Curran WJ Jr, Deshler A, et al. National Institutes of Health Consensus Development Conference Statement: adjuvant therapy for breast cancer, November 1–3, 2000.
Simon R, Radmacher MD, Dobbin K, McShane LM. Pitfalls in the use of DNA microarray data for diagnostic and prognostic classification.
Ransohoff DF. Rules of evidence for cancer molecular-marker discovery and validation.
Michiels S, Koscielny S, Hill C. Prediction of cancer outcome with microarrays: a multiple random validation strategy.
Eden P, Ritz C, Rose C, Ferno M, Peterson C. “Good Old” clinical markers have similar power in breast cancer prognosis as microarray gene expression profilers.
Todd JH, Dowle C, Williams MR, Elston CW, Ellis IO, Hinton CP, et al. Confirmation of a prognostic index in primary breast cancer.
Ravdin PM, Siminoff LA, Davis GJ, Mercer MB, Hewlett J, Gerson N, et al. Computer program to assist in making decisions about adjuvant therapy for women with early breast cancer.
Singletary SE, Allred C, Ashley P, Bassett LW, Berry D, Bland KI, et al. Revision of the American Joint Committee on Cancer staging system for breast cancer.
Cardoso F. Microarray technology and its effect on breast cancer (re)classification and prediction of outcome.
Harvey JM, Clark GM, Osborne CK, Allred DC. Estrogen receptor status by immunohistochemistry is superior to the ligand-binding assay for predicting response to adjuvant endocrine therapy in breast cancer.
Elston CW, Ellis IO. Pathological prognostic factors in breast cancer. I. The value of histological grade in breast cancer: experience from a large study with long-term follow-up.
Olivotto IA, Bajdik CD, Ravdin PM, Speers CH, Coldman AJ, Norris BD, et al. Population-based validation of the prognostic model ADJUVANT! for early breast cancer.
Effects of chemotherapy and hormonal therapy for early breast cancer on recurrence and 15-year survival: an overview of the randomised trials.
Heagerty PJ, Lumley T, Pepe MS. Time-dependent ROC curves for censored survival data and a diagnostic marker.
Kattan MW. Judging new markers by their ability to improve predictive accuracy.
Simon R. Roadmap for developing and validating therapeutically relevant genomic classifiers.
Foekens JA, Atkins D, Zhang Y, Sweep FC, Harbeck N, Paradiso A, et al. Multicenter validation of a gene expression-based prognostic signature in lymph node-negative primary breast cancer.
Ein-Dor L, Kela I, Getz G, Givol D, Domany E. Outcome signature genes in breast cancer: is there a unique set?

