


Abstract
This article builds on a mathematical explanation of one the most prominent stylometric measures, Burrows’s Delta (and its variants), to understand and explain its working. Starting with the conceptual separation between feature selection, feature scaling, and distance measures, we have designed a series of controlled experiments in which we used the kind of feature scaling (various types of standardization and normalization) and the type of distance measures (notably Manhattan, Euclidean, and Cosine) as independent variables and the correct authorship attributions as the dependent variable indicative of the performance of each of the methods proposed. In this way, we are able to describe in some detail how each of these two variables interact with each other and how they influence the results. Thus we can show that feature vector normalization, that is, the transformation of the feature vectors to a uniform length of 1 (implicit in the cosine measure), is the decisive factor for the improvement of Delta proposed recently. We are also able to show that the information particularly relevant to the identification of the author of a text lies in the profile of deviation across the most frequent words rather than in the extent of the deviation or in the deviation of specific words only.
1 Introduction
Readers of this journal are familiar with the research area in quantitative text analysis called stylometry, concerned with authorship attribution, that is, with attributing texts of unknown or disputed authorship to their actual author based on quantitatively measured linguistic evidence (see Juola, 2006; Koppel et al., 2009; Oakes, 1998; Stamatatos, 2009 for introductions). Authorship attribution has applications in many fields, including literary studies, philosophy, history, forensic linguistics, and corpus stylistics. The fundamental assumption in authorship attribution is that individuals have idiosyncratic and largely unconscious habits of language use, leading to stylistic similarities between texts written by the same person. In the history of authorship attribution, many of these habits have been assessed using a wide range of stylometric features, for example, the relative frequencies of function words or parts of speech, the degrees of vocabulary richness or syntactic complexity, and many others. The resulting feature vectors form the basis for quantifying the overall similarity of texts using a variety of methods. This information is then used for attributing a text of unknown or disputed authorship to the most similar of a set of candidate authors.
The aim of this article is to present findings from a series of investigations into stylometric authorship attribution methods relying on the relative frequencies of the most frequent words and using distance measures to quantify stylistic similarity. These investigations have centered around the following questions: How and why exactly does this type of authorship attribution method work? Why do different feature scaling strategies and distance calculation methods perform differently? And finally, how can knowledge about these questions be used to improve authorship attribution methods?
This article has the following structure: First, we contextualize our own work by describing the fundamental idea of authorship attribution using distance measures and by summarizing earlier methodological work on this issue. Second, we summarize the most relevant mathematical foundations of distance-based authorship attribution. Third, we report insights gained by separating the transformation of the feature values from the distance calculation in authorship attribution, and present a series of investigations pertaining to the effects of several normalization methods and distance measures in three different languages. Fourth, we describe experiments designed to clarify why distance measures work well for authorship attribution by isolating different characteristics of the word frequency distributions. We conclude with a summary of our results.
2 Starting Point: Authorship Attribution with Delta
John Burrows received the Roberto Busa Prize in the year 2001 for his work in stylometry. In his acceptance speech, he proposed a new measure called Delta for an established field which relied mainly on multivariate statistics to compare very small groups of candidates. The state of the art at that point was to compare two likely candidates (Bailey, 1979; Binongo and Smith, 1999), and for Burrows the main task of this new procedure was ‘to shake off these constraints’ (Burrows, 2002, p. 268). In this situation there seemed to be mainly one problem to solve: How to reduce a large set of potential candidates to a much smaller set, which would then allow the use of more time-consuming and computationally intensive multivariate statistics. Burrows’s seminal paper from 2002 described this situation as an ‘open game’: ‘where we are faced with an anonymous text but have little or no outside evidence to identify the most likely candidates’ (Burrows, 2002, p. 267f.). In this situation the ‘current methods must be employed in an exhaustive and possibly fruitless series of iterations’ (ibid.).
The statistical analysis was applied to different features that depended on the specific circumstances, but the first 50–100 most common words had proven to be good candidates because they seemed to distinguish reliably between authors. Burrows explicitly states it as an insight of the whole field that it is much more reliable to support your conclusions with many ‘weak discriminators’ (Burrows, 2002, p. 268) instead of a few strong discriminators. And another aspect needs to be mentioned in this context: Delta, as defined by Burrows, is a distance measure. It describes the distance between one text and a group of texts. This group is taken as a representation of the style of a period, a text genre at some time. Burrows thinks about style here in a way known from stylistics: style is the deviation from a norm (Rosengren, 1972).
In the years following this ground-breaking publication several things happened: First, different scholars showed that Delta could be applied to genres of text other than the rather exotic epic poems Burrows used in his article with similarly good results (Hoover, 2004a) and that it could also be used in languages other than English (Eder and Rybicki, 2013). Second, there has been a change of tools in mainstream stylometry. Maciej Eder and Jan Rybicki, later also supported by Mike Kestemont, used the statistical programming language R to implement Delta and some variations of it and added a user-friendly graphical user interface to allow its easy use (Eder et al., 2016; see also: https://sites.google.com/site/computationalstylistics/). Third, the implementation of Delta’s simple algorithm in a scripting language allowed them and others to test Delta systematically and empirically over different text genres, periods, and languages (Rybicki and Eder, 2011). Fourth, the impressive results of Delta and the ease of implementation challenged researchers to look for improvements to Burrows’s Delta (Argamon, 2008; Hoover, 2004b; Smith and Aldridge, 2011).
3 Mathematical Foundations
Thus, Burrows’s Delta became a widely used and accepted method, though the researchers following Burrows’s example usually used it to calculate the distance between two texts, rather than the distance between a text and the average of a reference corpus. Despite its popularity and the eagerness of researchers to develop improvements to it, it was not until Argamon (2008) that the method itself was thoroughly analyzed. Argamon provided a substantial mathematical insight: He showed that Delta can be seen as a distance measure between representations of the documents as vectors in a high-dimensional space in which each word (or other feature) taken into account corresponds to one of the dimensions of that space.
The starting point for the document representation is a ‘bag of words’ model of the text, i.e. we count how often each word form occurs in each document. The word counts are then transformed to relative frequencies to compensate for different text lengths. For further processing, the most frequent different words over the whole corpus (hereafter, ) are chosen. In the vector space model, each different word corresponds to a different dimension. The word frequencies of all documents can now be arranged in a documents × words matrix.
Burrows (2002) then ‘standardizes’ the word frequencies, i.e. he normalizes the frequencies such that, over the whole corpus, the mean for each word is and the standard deviation is (the result is also known as the ‘z-score’ for document and word ). This reduces the influence of the top-scoring words: Since word frequencies follow the distribution described by Zipf’s law (Zipf 1935), the distance would otherwise barely be influenced by anything but a few top-scoring words (Fig. 1).
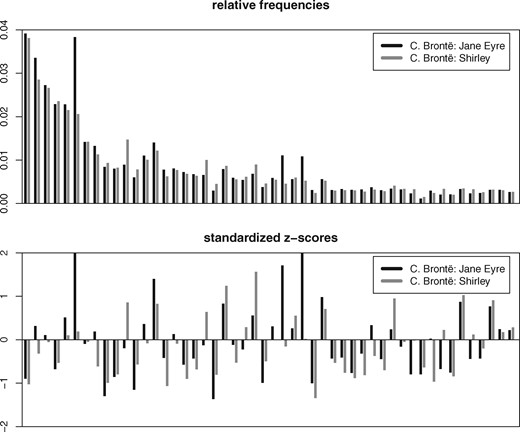
Illustration of feature vectors used by Delta measure. x-axis: 50 most frequent words, sorted by frequency in the complete corpus; y-axis: relative frequencies (top) and corresponding standardized z-scores (bottom)
Given the normalized document vectors, there are, as Argamon points out, different standard ways to calculate the distance between two documents represented by the vectors u and v respectively. Figure 2 illustrates this in the two-dimensional space: The ‘Manhattan distance’ (the norm of the difference vector) sums up the absolute distances between each word's normalized frequencies in the two documents (), the ‘Euclidean distance’ (the norm of the difference vector) calculates the ‘straight line’ distance between the vectors ( ), and the ‘cosine distance’ () corresponds to the angle between the vectors (which is, in fact, equivalent to normalizing the vectors by length and taking the Euclidean distance). Burrows’s Delta, , corresponds to the Manhattan distance of the word frequencies' z-scores.
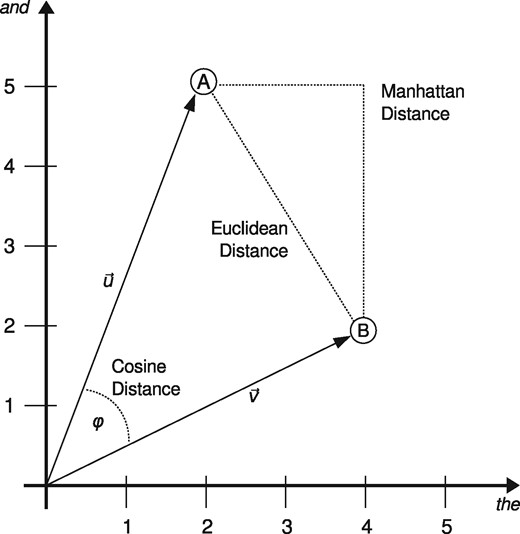
Different vector distances between two example documents A and B illustrated in two-dimensional space
Argamon links these geometric measures with a probabilistic interpretation of Burrows’s Delta (hereafter, ) by showing that ranking by the Euclidean distance is actually equivalent to ranking by the highest probability in a multivariate Gaussian distribution, while ranking by the Manhattan distance corresponds to a Laplace distribution. He then points out a methodological mismatch in Burrows’s Delta: It is based on the Manhattan distance, but normalizes by mean and standard deviation, which only makes sense with a Gaussian distribution.
He suggests two ways out: ‘Linear delta’ (hereafter, ) uses the Manhattan distance like Burrows, but normalizes the relative frequencies using the parameters of the Laplace distribution, ‘median’ and ‘spread’. ‘Quadratic delta’ (hereafter, ), on the other hand, keeps the z-score standardization from , but uses the Euclidean distance. (An analysis of the word frequency distribution in our English test set shows indeed that the normal distribution represents the data much better than the Laplace distribution. The same is true for German.)
Furthermore, all those methods assume statistical independence between the frequencies of the individual words, which is doubtful from a philological and linguistic point of view. Argamon therefore suggests a third Delta variant, a non-axis parallel quadratic delta or ‘rotated Delta’ (hereafter, ), that takes this into account: In a process also known as ‘whitening’ in statistics, the raw frequency matrix is rotated by a ‘covariance matrix’ determined from the whole corpus or from a reference corpus, thus eliminating the dependencies between word frequencies before calculating the Euclidean distances.
Aside from Argamon’s, there have been various other suggestions to improve Burrows’s Delta. Hoover (2004b), for example, suggests methods that treat positive and negative distances differently, Eder’s Delta (Eder, 2015) makes use of a ranking factor that reduces the weight of less-frequent words' z-scores, and Smith and Aldridge (2011) use the cosine distance (which is popular in information retrieval and text mining) instead of the Manhattan or the Euclidean distance (hereafter, ).
All the different Delta variations are inherently distance measures, and thus they yield a matrix of pairwise differences between all documents in the corpus. To create a more easily interpretable view of these data, the documents are often ‘clustered’ based on the distance matrix. A popular choice is an agglomerative hierarchical clustering: For this, the two documents with the lowest distance are joined to form a cluster node. The distance of this new node to the other nodes in the set is estimated using a ‘linkage method’. The process is iteratively repeated until all documents and intermediate clusters have been joined. A ‘dendrogram’ as in Fig. 3 is the typical visualization for this kind of clustering, where the lengths of the horizontal lines are proportional to the distances between the joined nodes.
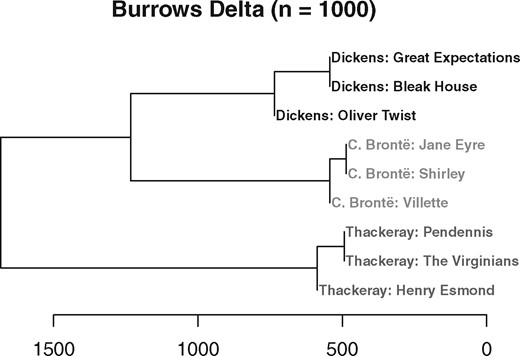
Example of a hierarchical clustering of nine English novels from three different authors (Burrows’s Delta with nMFW = 1,000, Ward clustering)
In Jannidis et al. (2015), we reported on a series of experiments to systematically test various Delta methods and a set of other popular distance measures against our set of novels in three languages. This set, also used in the investigations presented here, is composed of three corpora of German, English, and French texts, all built following the same criteria. Each corpus contains seventy-five novels from twenty-five different authors, each author contributing three texts, respectively. (For more details on the corpora, see the appendix below.) To provide useful performance indicators for these measures for authorship attribution, we concentrated on the question of how well the distance measures distinguish between a situation where the two texts under comparison have been written by the same author and a situation where the two texts have been written by different authors. For each of the three corpora, we compared a range of Delta variants and other distance measures varying the number of most frequent words considered and calculating a distance matrix for each combination. The distance matrices have been the basis for a hierarchical (Ward) clustering and a non-hierarchical (PAM) clustering which has afterward been flattened to at most twenty-five (the number of authors in each corpus) flat clusters.
Besides relying on the Adjusted Rand Index (ARI) between the perfect and actual clustering (a well-known but rather abstract measure for clustering quality; Everitt et al., 2011, p. 264f.), we also established a simple algorithm to count clustering errors representing the researcher's intuition of correct clustering. To compare ingroup and outgroup distances, we settled on the simple difference of z-transformed means because this particular method yielded the best correlation with the number of clustering errors.
Our empirical tests did not substantiate Argamon’s theoretical arguments. Most interestingly, we could not only confirm the findings of Smith and Aldridge, but also show that outperforms all other measures on our three collections (Fig. 4). Equally important, it proves to be more robust with increasing : While and Eder’s Delta usually show a peak around 1,000–1,500 and then behave a bit erratically on longer word vectors, reaches a plateau at 2,000 and stays there (Fig. 5). Smith and Aldridge, based on their very different data, similarly observe such a plateau, although starting at 500 —this number might be a function of the corpus size.
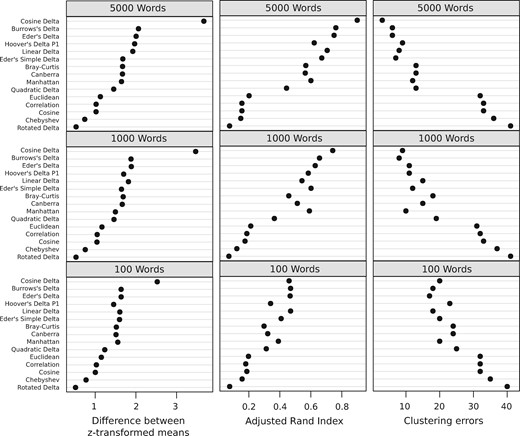
Performance of distance measures on English texts. Indicated in terms of the difference between z-transformed means of ingroup (same author) and outgroup distances (different authors), as Adjusted Rand Index (higher values indicate better differentiation), and in terms of clustering errors (lower values indicate better differentiation). Distance measures are sorted according to their maximum performance in all test conditions. The non-Delta measures are popular basic distance measures on raw relative frequencies. Similar results for French and German
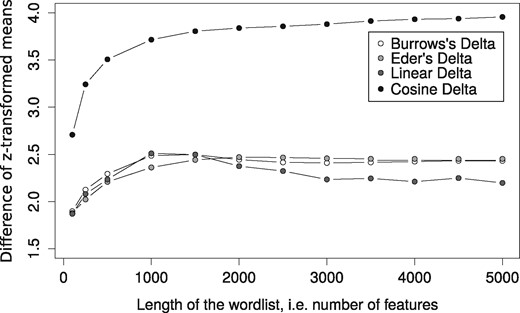
Difference between z-transformed means of ingroup and outgroup distances as a function of nMFW. Indicated for selected delta measures on the German text collection
Regarding Argamon’s suggested improvements, both and perform much worse than should be expected on theoretical grounds, and , although among the top five distance measures, seems to be an improvement over only under special circumstances. Argamon’s modifications to the original Delta were based on assumptions about the distributions of the features used by Delta. Even though we found the assumptions about the normal distribution to be correct, the corresponding measures did not perform better, something which points to the operation of factors not yet understood. The fact that those algorithms consistently performed differently in different languages and that these differences cannot, or at least only partially, be explained by the degree of inflection (Eder and Rybicki, 2013), adds to this enigma. There is almost no other algorithm in stylometry that has been used as much as Delta and still there is no theoretical framework to explain its success.
4 The Effects of Vector Normalization
To facilitate the understanding of how the different variations of Burrows’s Delta work in authorship attribution tasks, it seems necessary to follow Argamon’s example in analyzing the individual variants by breaking them down into a sequence of modular mathematical operations (Fig. 6). Argamon was the one to point out that the method Burrows originally presented to measure the distance between two texts based on word (type/feature) frequencies was basically a combination of z-transformation, i.e. standardization, and Manhattan distance.
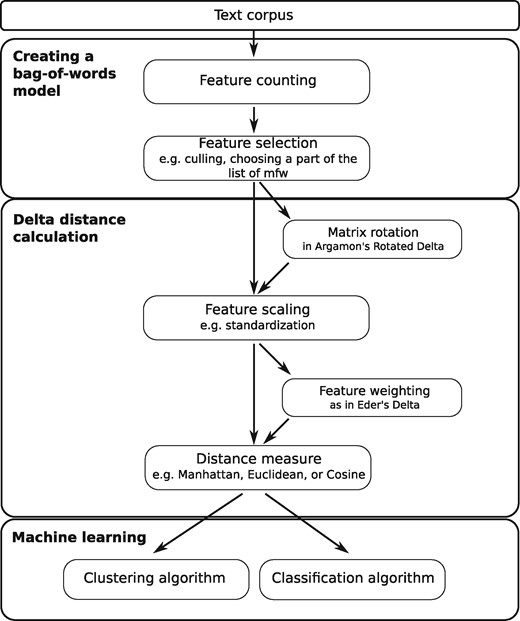
Delta-based authorship analysis as a modular pipeline or workflow
In the case of , the traditional standardization method (z-scores) is combined with the use of the cosine distance measure, as described above. One interesting aspect of this method that becomes obvious when we look at Fig. 2 is that vector length, i.e. the distance between the points and the origin, does not influence the value of cosine Delta at all. Accordingly, it can be seen that a very large value in a single dimension, representing a word whose frequency deviates to an extreme degree from the average in one of the texts, is not very likely to have a strong impact on the angle between the two vectors. It would, on the other hand, have a much more profound effect on the Manhattan and, in particular, on the Euclidean distance between the two texts (see, again, Fig. 2).
If the word vectors are normalized with respect to the Euclidean norm, i.e. , the Euclidean distance is a monotonic function of the angle : . As a result, and are equivalent for normalized feature vectors, i.e. if we normalize the word vectors to Euclidean length 1, the two curves for and overlap almost perfectly (Fig. 7).1 It follows that Cosine Delta and Quadratic Delta are not based on genuinely different distance metrics—the crucial difference is a matter of vector normalization.
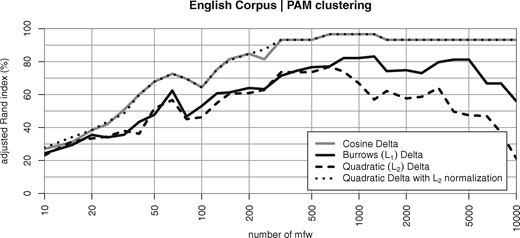
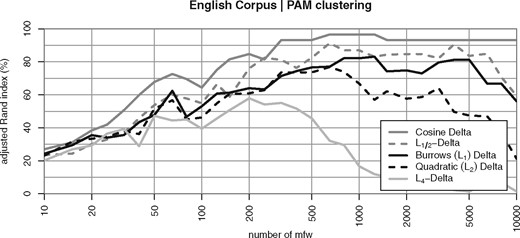
Evaluation of clustering quality in the English Corpus, depending on the number of most frequent words (nMFW) and the version of Delta used. Note that the curve for Quadratic Delta () in combination with Euclidean normalization is virtually identical to Cosine Delta ()
This observation suggests that other Delta measures such as might also benefit from vector normalization. We tested this hypothesis with the evaluation shown in Figs 10 and 11. The quality curves for with Euclidean normalization are in fact identical to the curves for and are not shown separately here. is also improved substantially by vector normalization, resulting in clustering quality equal to , although might be slightly less robust for 5,000. Interestingly, it seems to make little difference whether an appropriate normalization is used (L1 for and L2 for ) or not (vice versa)—even a normalization that is inappropriate from a purely mathematical perspective helps.2 Vector normalization is not only the key factor behind the success of Cosine Delta but also makes the other Delta variants more robust with respect to the choice of .
5 Working on an Explanation: Outliers or Key Profiles
5.1 Hypotheses
Clustering quality of different Delta measures based on the Minkowski family of metrics as a function of the nMFW considered (English Corpus). Results on the German and French corpus are very similar (not shown)
Normalizing the feature vectors to Euclidean length 1 substantially improves the quality of all Delta measures (Fig. 9). As discussed in the previous section, Argamon’s is identical to in this case: the two lines coincide with each other. The other Delta measures ( and ) now reach about the same quality as . Only still falls short considerably.
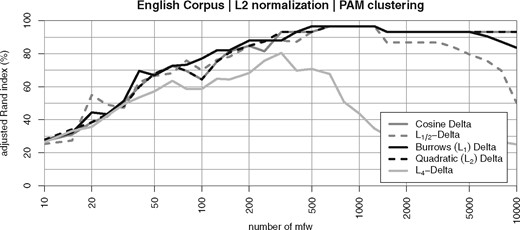
Clustering quality of different Delta measures with length-normalized vectors (according to the Euclidean norm) in the English Corpus
These observations led us to formulate two empirically testable hypotheses about why vector normalization is so essential:
H1, ‘outlier hypothesis’: Performance differences between Delta variants are caused by single extreme values, which we refer to as outliers. These are particularly large positive or negative z-scores specific to single texts rather than all texts of a single author. For the general Minkowski distance, it is true that the higher the value for p, the larger the influence of such outliers on . This hypothesis would explain the poor performance of compared to and the even worse performance of , which is especially prone to outliers. According to this hypothesis, the positive effect of vector normalization originates from the reduction of outlier amplitudes.
H2, ‘key profile hypothesis’: The ‘stylistic profile’ of an author manifests itself more in the qualitative combination of word preferences, i.e. in the pattern of over- and under-utilization of vocabulary, rather than in the actual amplitude of the z-scores. A text distance measure is particularly successful in authorship attribution if it is sensitive to structural patterns in the author style profiles without being too much influenced by their amplitudes. This hypothesis explains directly why vector normalization is so successful: it standardizes the amplitudes of author profiles in different texts. Since, for , the Minkowski distance approaches the Hamming distance (which only looks at the presence or absence of a feature), it would also explain why performs better for smaller .
5.2 Experiments
We performed two experiments to test these hypotheses directly. In the first experiment, we limited the influence of outliers by clamping extreme z-scores. This means that any z-score above a given value (e.g. 1) is set to that value and any z-score below a given value (e.g. −1) is set to that value. This procedure only affects words with above-average frequencies (Fig. 10).
Visualization of feature vectors for two novels by Charlotte Brontë, showing the 50 MFW with clamping of outliers with | z | > 1
As Fig. 11 shows, this manipulation improves the performance of all variants considerably. However, if we look at and , its positive effect is noticeably smaller than that of vector normalization.
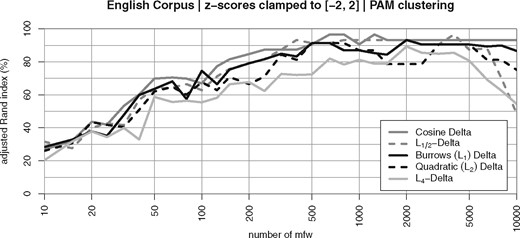
Cluster quality after clamping outliers, i.e. feature values with | z | > 2 have been replaced with the fixed values −2 or +2, depending on z-score’s sign
These results indicate that the performance gain achieved by vector normalization cannot be sufficiently explained by the reduction of outlier amplitudes alone and that H1 cannot be upheld.
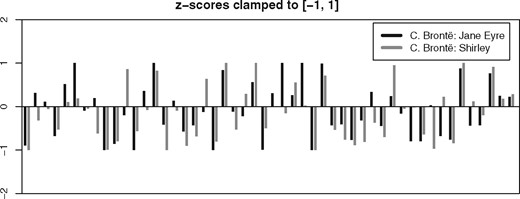
H2, the ‘key profile hypothesis’, is supported by the good results of vector length normalization. However, on its own, it cannot explain why clamping outliers leads to a considerable improvement as well. To examine this hypothesis further, we created pure ‘key profile’ vectors that only discriminate between word frequencies that are above average (+1), unremarkable (0), and below average (−1; cf. Fig. 12). The thresholds for this ternary quantization, (–1), (0) and (+1), have been selected such that in an ideal normal distribution, a third of all feature values would fall into each of the classes −1, 0, and +1.
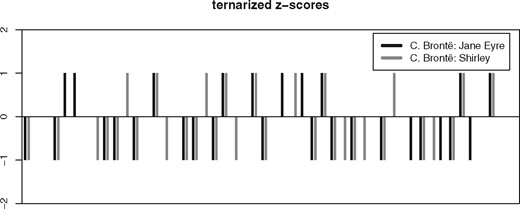
Visualization of feature vectors for two novels by Charlotte Brontë, showing the 50 MFW with a ternary quantization to the values −1, 0, and +1.
Figure 13 shows that these key profile vectors perform remarkably well, almost on par with vector normalization. Even the especially outlier-prone reaches a quite robust clustering quality of more than 90%. We interpret this observation as giving considerable support to hypothesis H2.
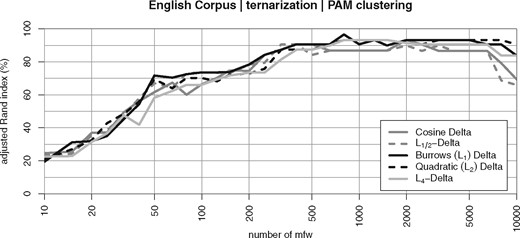
Cluster quality with ternary quantization of the vectors in frequencies that are above average (+1, z > 0.43), unremarkable (0, −0.43 ≤ z ≤ 0.43), and below average (z < −0.43)
Another perspective is revealed by systematically varying the exponent of the Minkowski norm from to . Figure 14 shows the corresponding clustering quality for MFW (selected as an intermediate value for which very good results can still be achieved in all three corpora with the right parameter settings). Note that the x-axis shows Minkowski rather than the in this case. Looking at the corresponding lines, it is obvious that is not robust for large values of , which make the metric highly sensitive to the magnitude of differences and in particular to outliers. On the other hand, setting further improves results over the original (with ). Euclidean normalization of vector lengths dramatically changes this picture, not only improving clustering quality on the whole, but also making the measures robust across a wide range of values (up to around ). Figure 14 also shows that ternarization (without length normalization) has the same effect, with even better robustness up to , providing additional support for the key profile hypothesis H2. Merely clamping outlier values also improves robustness with respect to , but does not quite achieve the clustering quality of normalization and ternarization, especially for .
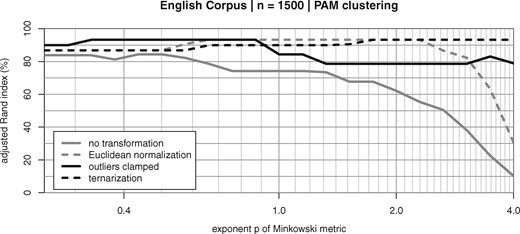
Cluster quality depending on the exponent p of the Minkowski metric (English Corpus, nMFW = 1,500)
H1, the outlier hypothesis, has been disproven since vector normalization hardly reduces the number of extreme values and the quality of all measures is still considerably improved. On the other hand, H2, the key profile hypothesis, has been confirmed. The ternary quantification of the vectors clearly shows that it is not the amplitude of deviations from the mean, but the profile of positive and negative deviation across the which is an important characteristic of author style. Remarkably, the measures behave differently if more than 2,000 are used. Almost all variants show a decline for a very large number of features, but they differ in when this decline starts. We suppose that the vocabulary in those parts is less specific for any one author but rather for the topics and contents of a text, but it will require further studies to investigate this phenomenon.
6 Conclusion
With this article, we hope to have made several contributions to the state of the art in stylometric authorship attribution using feature vectors and distance measures. We have attempted to build on the explication of the mathematical foundations of Burrows’s Delta as well as on the insight of the conceptual separation between feature selection, feature scaling, and distance measures. Consequently, we have designed a series of controlled experiments in which we used the kind of feature scaling (various types of standardization and normalization) and the type of distance measures (notably Manhattan, Euclidean and cosine) as independent variables and the correct authorship attributions as the dependent variable indicative of the success of each of the methods proposed. In this way, we were able to describe in detail how each of these two variables interact with each other and how they influence the results.
In a first series of empirical tests, we were able to show that the mathematical assumptions made by Argamon regarding the required ‘fit’ between feature scaling and distance measure do not in fact lead to better results in authorship attribution tasks, at least not for the three corpora we have used. This led us, however, to a closer investigation of the effects of feature vector normalization.
To do this, we conducted a second series of experiments in which we were able to show the decisive role of feature vector normalization, that is the transformation of the feature vectors to a uniform length of 1. This step, implicit in the cosine distance, leads to dramatic improvements in performance and robustness when using the Manhattan or the Euclidean distances. These experiments suggest that the difference in direction rather than in length of the vectors is decisive for authorship attribution.
To scrutinize this hypothesis systematically, we conducted a final series of experiments in which we investigated the effect of other types of feature vector scaling, among them clamping and ternarization. With these experiments, we were able to show that some information particularly relevant to the identification of the author of a text lies in the profile of deviation across the rather than in the extent of the deviation, which appears to introduce more noise than useful information for the task at hand. All in all this shows that Burrows’s insight was correct: ‘In this sort of work on language, so our researches teach us, a wealth of variables, many of which may be weak discriminators, almost always offer more tenable results than a small number of strong ones.’ (Burrows 2002, p. 268). In the case of the frequencies of most frequent words this means that the profile as a whole contains the interesting information and not some specific words.
Although we believe these findings have brought us some way to a better understanding of distance-based methods of authorship attribution, several challenges remain to be addressed in future work. Among these challenges, it seems of particular interest to us to systematically investigate the relation between different languages and distance-based methods of authorship attribution. How do the individual characteristics of different languages, for instance, their mechanism and prevalence of inflection, derivation, and compounding, interact with feature scaling and choice of distance measure in stylometric authorship attribution? Solving this question will not only help improve authorship attribution methods for a wide range of languages but may also add further insight into how exactly the authors’ idiosyncratic habits of language use end up shaping empirically measurable distinctive profiles in their texts that allow us to attribute texts to their authors with increasing degrees of confidence.
One important limitation is that our current findings are based on a relatively small collection of seventy-five novels, and it is not entirely clear whether the observed differences are always statistically significant. Unfortunately, significance testing of differences in clustering quality (with respect to a gold standard) is far from straightforward. For example, bootstrapping approaches (Efron 1979) cannot easily be applied because the clustering quality is not based on individual measurements for the texts in the sample but rather on the sample as a whole; permutation tests (Hunter & McCoy 2004) can only be used to show that a clustering is significantly better than chance, which is entirely obvious given the excellent ARI in our experiments; and calculating p-values for clusters-value clustering (Suzuki & Shimodaira 2006) assumes that features are independent and identically distributed, which is clearly not the case for language data due to Zipf’s law. Developing appropriate significance testing methods for clustering experiments is an important goal for future research. At this time, we take the fact that our results can be replicated on the French and German texts (not shown for reasons of space) as clear support for their validity.
| German corpus | English corpus | French corpus | |
|---|---|---|---|
| Source of the texts | TextGrid Digital Library3 | Project Gutenberg4 | Ebooks libres et gratuits5 |
| Range of original publication dates | 1774–1926 | 1838–1921 | 1827–1934 |
| Total number of tokens | 10,354,989 | 11,771,901 | 7,401,126 |
| Length of shortest novel, in tokens | 19,820 | 40,720 | 33,501 |
| Length of longest novel, in tokens | 761,821 | 456,637 | 209,992 |
| Mean length of novels, in tokens | 138,067 | 156,958 | 98,681 |
| Standard deviation of novel length | 134,857 | 85,890 | 42,194 |
Acknowledgements
This research was funded by the German Federal Ministry of Education and Research (BMBF), fund numbers 01UG1415A-B and 01UG1508.
Appendix: Data and Code
The investigations presented here were made using three corpora of German, English, and French texts, all built following to the same criteria. Each corpus contains seventy-five novels from twenty-five different authors, each author contributing three texts, respectively. The following table shows some key indicators for the three corpora.
A Python implementation of most of our methods is available at https://github.com/cophi-wue/pydelta.
Footnotes
1 While the distance metrics are equivalent, i.e. they lead to the same ranking, our clustering algorithms are to some extent sensitive to the actual distance values, which explains the small differences between the graphs.
2 Argamon (2008) assumes that the individual steps or ‘parameters’ of a Delta measure ought to fit together mathematically. This assumption leads to the formulation of Linear and Quadratic Delta. In line of this reasoning, we would expect an appropriate normalization to be clearly superior to an inappropriate normalization. However, the empirical evidence suggests that mathematically inconsistent steps do not necessarily have a negative impact on the actual performance.
