


Abstract
Small non-coding RNAs, in particular microRNAs(miRNAs), regulate fine-tuning of gene expression and can act as oncogenes or tumor suppressor genes. Differential miRNA expression has been reported to be of functional relevance for tumor biology. Using next-generation sequencing, the unbiased and absolute quantification of the small RNA transcriptome is now feasible. Neuroblastoma(NB) is an embryonal tumor with highly variable clinical course. We analyzed the small RNA transcriptomes of five favorable and five unfavorable NBs using SOLiD next-generation sequencing, generating a total of >188 000 000 reads. MiRNA expression profiles obtained by deep sequencing correlated well with real-time PCR data. Cluster analysis differentiated between favorable and unfavorable NBs, and the miRNA transcriptomes of these two groups were significantly different. Oncogenic miRNAs of the miR17-92 cluster and the miR-181 family were overexpressed in unfavorable NBs. In contrast, the putative tumor suppressive microRNAs, miR-542-5p and miR-628, were expressed in favorable NBs and virtually absent in unfavorable NBs. In-depth sequence analysis revealed extensive post-transcriptional miRNA editing. Of 13 identified novel miRNAs, three were further analyzed, and expression could be confirmed in a cohort of 70 NBs.
INTRODUCTION
Small non-coding RNAs, in particular microRNAs (miRNAs), have been identified to regulate global gene expression patterns. MiRNAs are transcribed as long precursors and then cleaved to pre-miRNAs of characteristic hairpin structure. Pre-miRNAs are further processed to generate mature miRNAs. For several pre-miRNAs, both strands are processed and give rise to a functional miRNA. If either one is known to be expressed at <15% of the other form, it is designated as miRNA* (star form). If the expression ratio is not known, a mature miRNA is designated with suffix ‘-3p’ or ‘-5p’, depending on the originating strand.
Functional miRNAs regulate the translation and cleavage of mRNAs by sequence-specific interaction with the 3′-UTR [reviewed in (1)]. MiRNAs are involved in the regulation of most physiological processes, including differentiation, development and apoptosis (2). In cancer, miRNAs may exert oncogenic function by inhibiting tumor suppressor genes or may act as tumor suppressors by inhibiting oncogenes (3,4).
Neuroblastoma (NB) is the most common extracranial, solid tumor of childhood, comprising 15% of childhood cancer deaths [reviewed in (5–7)]. NB is characterized by a broad clinical and biological heterogeneity. Patients with favorable NB have a very good prognosis as tumor regression or differentiation is often observed even in the absence of specific treatment. In contrast, most patients with highly aggressive NB, often characterized by amplification of the MYCN oncogene, die despite intensive therapy. Most recently, attempts were made to analyze the contribution of miRNAs to NB tumor biology (8–21), reviewed in (22,23).
Several groups analyzed miRNA expression in primary NBs using miRNA microarrays or high-throughput RT-qPCR. They reported broad deregulation of miRNA patterns correlated with MYCN amplification, 11q deletion and prognosis (9,15,16,19). Further functional analysis identified miRNAs of the MYCN-regulated miR-17-92 cluster to be important for proliferation and migration as well as invasive growth of NB cells (12, 17). Furthermore, miR-34a, located in a region of frequent chromosomal loss, appears to directly downregulate expression of the MYCN oncogene (10,18,19). The only attempt to clone NB-specific miRNAs from primary tumors was compromised by the low coverage of the generated libraries (8).
With the availability of high-throughput next-generation sequencing (NGS) (24–28), the technical drawbacks of probe-based methodologies, especially restriction to detection of only previously known sequences, can be overcome. As miRNAs are sequenced directly, information about SNPs as well as post-transcriptional RNA editing, 3′-terminal addition of single nucleotides and variation in miRNA length becomes available for further analysis (13,26,29). It has become evident that post-transcriptional modifications of miRNAs produce multiple mature variants, which are referred to as isomiRs (26). NGS of the small RNA transcriptome also provides data on the expression of other small RNAs, such as piRNAs, snoRNAs and other less well characterized short, regulatory RNAs that do not meet the criteria of miRNAs (30).
We compared the small RNA transcriptomes of five favorable and five unfavorable, MYCN-amplified NBs by means of ultra-deep NGS using the SOLiD system (Applied Biosystems). NGS results were compared with miRNA expression patterns generated for the same samples by high-throughput RT-qPCR to correlate results from both systems and validate miRNA expression patterns (14). Favorable and unfavorable NBs were distinguishable by hierarchical clustering of miRNA patterns. Expression of single miRNAs also differed significantly between the two groups. We subsequently analyzed RNA editing as well as occurrence and frequency of isomiR expression, and identified 13 candidates for novel miRNAs of which three were further validated in 70 primary NBs using RT-qPCR. To our knowledge, this is the first comprehensive presentation of the composition of the small RNA transcriptome of a primary tumor, using NB as a model system. By comparing tumors of divergent biology and clinical outcome, we also provide insights into the heterogeneity of the small RNA transcriptomes in cancer.
MATERIALS AND METHODS
Sample preparation and RNA isolation
Written informed consent was obtained from all patients' representatives, and the study was approved by the institutional review board. Serial cryosections were obtained from all tumors. The first and last cryosections of each series were used to verify tumor cell content. Samples were only included in this study if the tumor cell content was >70 %. No systematic difference in tumor cell content was observed between samples from unfavorable and favorable NBs included in this study. Cryosections not used for histological analysis were transferred to TRIzol (Qiagen, Hilden, Germany), and total RNA was extracted using the miRNEASY kit (Qiagen) according to the manufacturer's recommendations.
Small RNA library generation and sequencing
Libraries for deep sequencing were prepared from total RNA according to the manufacturer's protocol [SREK (small RNA expression Kit), Applied Biosystems, Foster City, CA, USA]. Library integrity was controlled using a DNA 1000 Lab Chip on a Bioanalyzer (Agilent, Santa Clara, CA, USA). Template bead preparation, emulsion PCR and deposition was performed according to the standard protocol, and slides were analyzed on a SOLiD system V3 (Applied Biosystems).
Sequence processing and mapping
Mapping of SOLiD reads was performed using MAQ 0.7.1-10 (Subversion revision 687). We allowed two mismatches for read lengths between 12 and 14 and three mismatches for longer reads. Raw expression values (read counts) were obtained by summing the number of reads that mapped uniquely to one of the reference databases, Human Genome RefSeq Hg18, miRBase release 13.0, fRNAdb v3.1, RepBase 14.06, human UniGene sequences (July 2009) and Escherichia coli (NCBI Nucleotides accession no. NC_000913). The confidence in a correct assignment of reads to mature miRNAs was substantially increased by discarding reads not uniquely mappable and by the error-correcting properties of SOLiD sequencing. See Supplementary Figure S1 for more details.
Normalization of read counts
To quantify and compare miRNA expression across datasets, raw read counts were normalized using linear transformations of each dataset. One dataset was chosen arbitrarily as a reference, and quantile–quantile (qq) plots of the distribution of absolute count values >5 against all remaining datasets were compared in logarithmic space. The median of differences of corresponding quantile values of a dataset and the reference were computed. This corresponds to a pure scaling normalization, and determines the scaling factor in a robust manner from the qq-plot (S1,S4).
MiRNA RT-qPCR
Total RNA (20 ng) was reverse transcribed using the Megaplex RT stem–loop primer pool (Applied Biosystems), enabling miRNA-specific cDNA synthesis for 430 different human miRNAs and 18 small RNA controls. Subsequently, Megaplex RT products were amplified using a two-step strategy described previously (14). All reactions were performed on the 7900 HT (Applied Biosystems) using the gene maximization strategy (14). MiRNA RT-qPCR data were normalized as previously described (15). In contrast to the known miRNAs, PCR reactions for Seq 2, 6 and 12 were performed in a singleplex format. All RT-qPCR assays were performed according to the MIQE guidelines (31), and respective information is provided in the supporting material (Supplementary Figure S12). In singleplex and multiplex assays, miRNAs with Ct (cycle threshold) values >40 or >35, respectively, were considered absent. Normalized expression values are reported in Supplementary Figure S13 (‘NaN’ if the miRNA was absent).
Statistical testing and cluster analysis
R 2.9.1 (http://www.r-project.org) was used for statistical and clustering analysis. The rawp2adjp (raw P-value to adjusted P-value) function of the R library multtest was used for Benjamini–Hochberg multiple testing correction (32,33). To assess the amount of 3′-editing in mature miRNAs, the nucleotide distribution (categories: A, C, G, T, missing) at each position in each miRNA in every dataset was obtained. To test for differential 3′-editing, the nucleotide distributions were computed for each position in each miRNA in each class, and the numbers were aggregated over the five patients in each class. To compare nucleotide distributions in the Death of disease(DoD) and event-free survival(EFS) patient groups (for fixed miRNA and fixed position), a chi square statistic was computed as a difference measure for miRNAs displaying >50 counts in each of both groups. Class labels were permuted in all 252 possible combinations, and the rank of the test statistic of the true class labels was converted into an empirical P-value. Hierarchical clustering was performed based on Canberra distances, which allows to compare sequencing data of different orders of magnitude without log-transformation.
RESULTS
Sequencing of the non-coding RNA transcriptomes of 10 NBs
Small RNA transcriptomes from five NBs with favorable biology and five MYCN-amplified NBs with unfavorable biology [(patients had maximum divergent clinical courses: EFS or DoD, Table 1) were analyzed by NGS using the SOLiD sequencer (Applied Biosystems)]. A total of 188 821 076 sequencing reads were obtained. Of all reads analyzed, 57% contained no adapter sequence, indicating that a fragment of at least 35 nt was sequenced. Read length distribution after adapter removal revealed four peaks at 12, 17, 21–23 and 35 nt (Figure 1A and Supplementary Figure S2). This peak distribution was consistent with results from other ncRNA deep sequencing runs with the same system. The peak at 21–23 nt indicates that mature miRNAs were enriched in the sequenced samples.
Clinical and molecular data for NB patients included in this study
| Pat. no. | Stage | Age at Dx | MNA | DoD | EFS | OS |
|---|---|---|---|---|---|---|
| 552 | 1 | 405 | 0 | 0 | 3109 | 3109 |
| 553 | 1 | 481 | 0 | 0 | 3745 | 3745 |
| 554 | 1 | 961 | 0 | 0 | 3605 | 3605 |
| 555 | 1 | 459 | 0 | 0 | 2861 | 2861 |
| 556 | 1 | 103 | 0 | 0 | 2856 | 2856 |
| 557 | 4 | 1478 | 1 | 1 | 946 | 1375 |
| 558 | 4 | 496 | 1 | 1 | 351 | 539 |
| 559 | 4 | 1045 | 1 | 1 | 839 | 1115 |
| 560 | 4 | 978 | 1 | 1 | 184 | 212 |
| 561 | 4 | 4827 | 1 | 1 | 201 | 207 |
Stage, INSS Stage; age at Dx, Age at diagnosis (days); MNA, MYCN amplification status (0: MYCN not amplified, 1: MYCN amplified); DoD: Death of Disease (0: alive, 1: dead); EFS, Event-free survival (days); OS, Overall survival (days).
NGS of the small RNA transcriptome. (A) Read length distribution (nt) after adapter removal. The y-axis depicts the percentage of read lengths relative to the total number of reads in each dataset, averaged over all datasets. The peak at length 35 is off scale, its actual height is 57%. Read lengths too short for mapping are shown in gray. (B) Proportion of non-coding (green) versus coding (yellow) RNA for each sample. The proportion of ncRNA is >80% in all but two samples analyzed. (C) Distribution of ncRNA species in the samples analyzed. (D) Histogram of Pearson’s correlation coefficients between logarithmic normalized miRNA expression values derived from sequencing versus negative normalized RT-qCt values (15) (displayed for 204 miRNAs available for comparison).
Library composition and mapping results
Library composition was determined by mapping all reads longer than 12 nt to the human genome. Annotation was based on annotation tracks included in the UCSC genome browser, the functional RNA database, fRNAdb (34) and miRBase (35). MiRNAs were identified and quantified by simultaneously mapping reads against the human genome, pre-miRNAs in miRBase and mature miRNAs in miRBase. About 40 % of the sequences were mappable using this approach. Unmappable sequences were neither repetitive, nor represented unknown transcripts, nor were due to contamination, as they rarely mapped against RepBase (36), UniGene transcript clusters (37) or the E. coli genome. The vast majority of these unmapped reads of unknown origin were 35 nt long, which was the maximum detectable length in this experimental setting. Absence of the adapter sequence indicated that the original sequence probably exceeded 35 bp.
The average ratio of mRNA/ncRNA was about 1:5 among mappable reads (Figure 1B). The proportion of miRNAs among the non-coding RNA ranged from 30 to >80%, with tRNA being the other major ncRNA species (Figure 1C). On average, 5% of all sequences (range 2.6–12.1%) were identified as mature miRNAs and 6.1% as pre-miRNAs. The absolute number of reads and the fraction mapped to mature miRNAs varied across the datasets (Supplementary Figure S3). A trend toward a higher proportion of mature miRNAs in tumors from EFS patients was detected (65% versus 55%), but was not significant due to the low number of cases analyzed. In summary, most of the mappable sequences were non-coding RNAs, with miRNAs being the major constituent.
Among those reads successfully mapped to mature miRNAs, 6.3% of all positions in SOLiD color space did not match the reference sequence. After conversion of data from color to nucleotide space, 2.6% mismatches remained. This fraction includes sequencing errors as well as SNPs and post-transcriptional editing events. Technical sequencing errors were equally distributed over all positions analyzed and were well below the rate of mismatches caused by SNPs and post-transcriptional editing events (Figure 3D and Supplementary Figure S1).
Correlation of miRNA sequencing counts to RT-qPCR results
Sequencing counts were normalized (Supplementary Figure S1 and S4) between datasets to account for raw counts of different magnitudes. To independently validate miRNA deep sequencing data, we examined the correlation between normalized sequencing counts and expression determined by RT-qPCR. The Pearson’s correlation coefficient between sequencing and RT-qPCR data was calculated for 204 miRNAs across the 10 patients. Expression of most miRNAs was highly correlated between the technical platforms (Figure 1D). This was also confirmed on the level of individual datasets (Supplementary Figure S5), with Pearson’s correlation coefficients ranging from 0.57 to 0.67 for each tumor. We conclude that normalized expression values obtained from miRNA deep sequencing are valid and comparable to RT-qPCR data.
Analysis of known NB-related miRNAs
We first analyzed miRNAs previously reported to be differentially expressed in NB, comprising all miRNAs of the miR-17-92 cluster (9,15–17), miRNAs of the miR-181 family (9), miR-542-5p [(20) and Schulte et al. submitted for publication] and miR-628-5p (21). Differential expression of these miRNAs between favorable and unfavorable NBs were consistent with published results (Figure 2A). Absolute quantification using NGS revealed that the oncogenic miRNAs of the miR17-92 cluster and the miR-181 family, which were previously shown to be upregulated in unfavorable NB (9), were also readily detectable in favorable NBs. The putative tumor-suppressive miR-542-5p and miR-628-5p were moderately expressed in favorable NBs, and nearly absent in unfavorable NBs. MiR-34a, which has been described to have tumor-suppressive functions, was not differentially expressed in favorable versus unfavorable NBs in this study. Taken together, all miRNAs previously linked to NB biology were also identified in this study.
Differential miRNA expression between favorable and unfavorable NB is presented as strip chart of normalized read counts. (A,B) Values for absent miRNAs were set to 0.5 to be visible on the logarithmic axis. MiRNA designations as well as raw P-values of t-tests on class means for each miRNA using the logarithmic normalized counts are shown. Additionally, FDR-adjusted P-values are shown. Those were calculated to correct for the number of hypothesis tested, i.e. 10 miRNAs in A and all 465 expressed miRNAs in B. Blue crosses depict EFS datasets and red circles refer to DoD datasets. (A) Expression data (normalized counts) for known NB-associated miRNAs. (B) Expression data (normalized counts) for the 40 best class-separating miRNAs. Rows are sorted according to raw p-values. These data indicate that previously NB-associated miRNAs (e.g. miR-17 and miR542-5p) as well as newly identified miRNAs are differentially expressed between favorable and unfavorable NB. (C) Heat map and cluster dendrogram of the most significant 76 miRNAs (uncorrected P-value <0.05). The EFS (552–556) and DoD (557–561) classes are clearly separated. Clustering was based on Canberra distance and single-linkage clustering. Blue: low expression, yellow: high expression. (D) Histogram of uncorrected p-values after testing equality of expression count means between EFS versus DoD classes for each miRNA. When testing data with equal means, the distribution of P-values is expected to be uniformly distributed across the unit interval (blue line). Here, P-values <0.05 (red line) are enriched.
Unbiased analysis of mature miRNAs discriminating favorable from unfavorable NB
We aimed to identify other miRNAs differentially expressed in favorable versus unfavorable NB using an unbiased approach. Only mature miRNAs represented by more than five raw counts in at least five datasets were considered. These criteria were met by 465 miRNAs, including 105 miRNA* and 45 miRNA-3p sequences. A total of 76 miRNAs were differentially expressed based on a t-test (uncorrected P < 0.05). See Figure 2B for the top 40 miRNAs. In an unsupervised cluster analysis, these 76 miRNAs separated the EFS and DoD classes (Figure 2C). Classes were still separated when all 465 expressed miRNAs were used (Supplementary Figure S6).
Due to the small sample size, only miR-181a-2* remained statistically significant when Bonferroni correction for multiple testing was applied. However, the frequency of low P-values for differential expression was higher than expected assuming a random distribution (Figure 2D). This P-value distribution indicates differential miRNA expression patterns in favorable versus unfavorable NBs.
Expression of miRNAs from the 5′ and 3′ arms of pre-miRNAs
We analyzed the ratios of expressions of miRNAs from 5′ and 3′ arms of pre-miRNAs. First, we examined miRNAs previously linked to NB biology (Figure 3A) and observed that all miR*/miR pairs (3–9 in Figure 3A) were found, as expected, at ratios below 15%. We furthermore noted a linear correlation of logarithmic expressions (r = 0.75). For the two miR-5p/miR-3p pairs, no clear bias toward one form was observed (1–2 in Figure 3A). When analyzing all miR*/miR pairs, 60.6% of all pairs show a ratio of <15%. (Figure 3B). For miRNAs with high abundance ( 100 counts for at least one sibling), this is true for 79%.
Analysis of expressions of miR/miR* pairs, miR-5p/miR-3p pairs and isomiRs. (A, B, C) Scatter plots are shown, in which each data point (cross, circle, digit) represents expression of a miRNA pair (x-axis: standard or -5p form; y-axis: star or -3p form) in a patient class (blue: EFS, red: DoD). Values for each miRNA pair are presented as log 10 of the geometric average of the five individual patient expression values. The black line indicates the main diagonal x = y. Dotted lines indicate ratios 1:0.15 and 0.15:1. (A) Expression correlation between miRNA-5p and miRNA-3p forms (labeled as 3–9) and standard and star forms (labeled as 1 and 2) for miRNAs known to be involved in NB. (B) Expression correlation between standard and star forms of all expressed miRNAs. (C) Expression correlation between miRNA-5p and miRNA-3p forms of all expressed miRNAs. (D) Global 3′-editing in mature miRNAs. The x-axis indicates the position in each miRNA ( corresponds to the most 3′ position). The data are aggregated over all tumors and all miRNAs analyzed and provide a global picture of 3′-editing. Position
  has the highest overall chance of being different from its reference. The blue curve shows the estimated position-specific sequencing error probability (Supplementary Figure S1). Each blue cross represents one position in SOLiD color space. The sequencing error probability in nucleotide space is considerably lower, as many errors are corrected during conversion from color to nucleotide space.
Expression values of all mir-5p/miR-3p pairs are shown in Figure 3C. Here, for 37.3% of all pairs, the expression ratio is either <0.15/1 or >1/0.15 suggesting that those could rather represent miR/miR* pairs. Further studies are warranted to investigate whether these results are commonly found or if they are specific for cancer or even for NB. In some instances, the -3p form was predominant; e.g. hsa-miR-324-3p had on average >200-fold higher expression counts than hsa-miR-324-5p.
In Figure 3, no global difference between DoD and EFS classes with respect to use of the different miRNA forms is obvious. To identify possible differences on the level of individual pairs, we performed t-tests for all 117 pairs (comprising 38 miR-5p/miR-3p and 79 miR/miR* pairs). After correction for multiple testing using the Benjamini–Hochberg method, no significant results remained (Supplementary Figure S10).
Analysis of editing of mature miRNAs
Editing of miRNAs has been reported to occur frequently (27). In our dataset, mismatches with regard to the reference sequence were highly biased toward the 3′-end of sequenced miRNAs, in line with previous reports of miRNA editing (13). Additionally, missing nucleotides at the 3′-end of mature miRNAs were also observed, as well as terminal additions of nucleotides (Figure 3D, Supplementary Figure S11C).
The technical sequencing error rate is well below the rate of mismatches and remains approximately constant across miRNA positions (Supplementary Figure S1). We also ruled out that mismatches can be explained by spurious editing sites due to homology to other miRNAs or tRNAs (38), . Most of the sequencing errors are corrected during conversion from SOLiD color space to nucleotide space and our mapping algorithm excludes ambigous reads instead of allocating them randomly.
We also observed a substantial number of ‘A to I’ editing events (0.7%). However, further substantial amounts of editing events were observed for G A (1.5% of all uniquely mapped reads), U
 C (1.2%) and U
 A (1.1%). Among the miRNAs undergoing A to I editing were miR-376a and miR-376c, miRNAs with previously described editing sites (Supplementary Figure S11B) (38,39). Individual miRNAs were differentially 3′-edited in favorable and unfavorable NBs, including hsa-miR-337-3p (P = 0.008 at position
  , P = 0.004 at position
  ), hsa-miR-17*, and hsa-miR-301a (P = 0.008 at positions
  and
and  for both miRNAs). However, no significant global difference in miRNA editing was detected between the two groups as histograms of empirical P-values for each nucleotide position resembled a uniform distribution (Supplementary Figure S7).
Terminal additions were found in 29.1% of all uniquely mapped miRNAs and the majority of these additions (63.1%) were non-template additions. Of those, single nucleotide terminal additions were predominant (67.2%). Addition of two or three bases was observed in 27.3% and 5.5%, respectively. In summary, most of these additions were single-nucleotide non-template adenosine or uracil additions (Supplementary Figure S11C), in accordance with published datasets (13,24,40,41).
In addition to the first description of miRNA terminal additions in NB, our study confirmed that editing of miRNAs was mainly restricted to the 3′ end, and that differential editing between favorable and unfavorable NBs was detectable for single miRNAs, but not as a global phenomenon.
Prediction of putative new miRNAs
To discover hitherto unknown miRNAs, a customized, efficiency-improved version of the miRDeep software package (42) was developed to analyze all reads mapped to the human genome. Since miRDeep utilizes no information on known miRNAs, de novo discovery of miRNAs is performed. MiRDeep provides a score integrating different measures of prediction quality, with a score of >1.0 being a good indicator for a true pre-miRNA (Supplementary Figure S8). In total, 64% of predicted miRNAs exactly matched an entry in miRBase. Of non-perfect matches, 24 sequences contained no known miRNA motifs, and were represented in at least three different datasets. A BLAST search revealed little or no homology to described miRNA sequences (E-value > 0.1) for 13 of these 24 sequences, which represent strong candidates for new miRNAs (Supplementary Figure S9, Figure 4A). Of these potential novel miRNAs, three miRNAs were selected for validation based on differential expression levels (Seq 6 and Seq 12) or high expression levels (Seq 2). Prediction of RNA secondary structures revealed a stem–loop configuration for all three sequences (Figure 4B). RT-qPCR confirmed detectable expression of Seq 2 in 69 out of 70 primary NBs (Supplementary Figure S13). Furthermore, expression of Seq 6 or high expression of Seq 12 were associated with adverse outcome in Kaplan–Meier analysis (Figure 4C). These findings underscore the power of sequencing approaches in discovering novel transcriptional units.
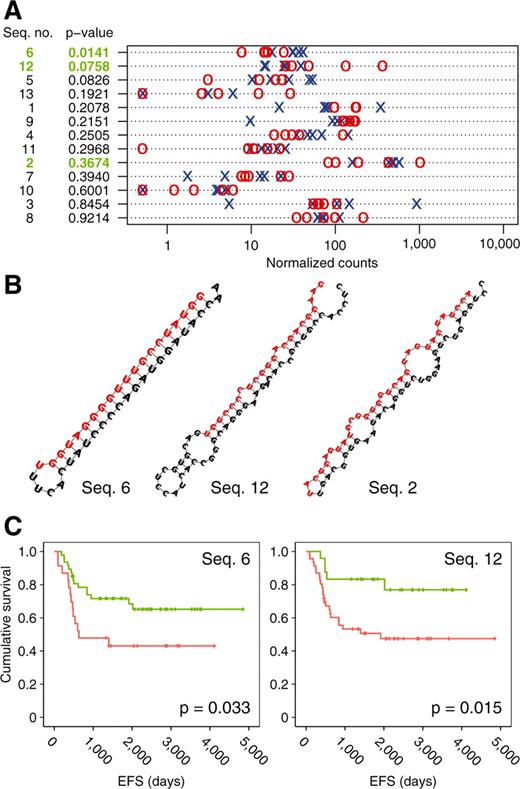
(A) Expression levels of putative new miRNA in favorable (blue) and unfavorable (red) NB, as measured by sequencing. (B) RNA secondary structure of RT-qPCR-validated novel miRNAs as predicted by RNAfold. (C) Kaplan–Meier survival curves for patients with (green) and without (red) Seq 6 expression and low (green) and high (red) Seq 12 expression. For the latter analysis, the 40th percentile was choosen as a cutoff.
DISCUSSION AND CONCLUSION
NGS is an ideal method to identify transcripts in an unbiased and unselected fashion. It does not require a priori knowledge of the sequence of the RNA species to be detected, but provides exact sequence information. In addition, NGS allows for absolute and exact quantification. Reports on deep sequencing of the RNAome and some of the technical difficulties encountered have been published (24–28). It was recently shown that miRNA sequencing using the SREK protocol differs from sequencing of libraries that rely on ligation of ‘modban’ adapters (25,43). In contrast to library generation, sequencing alone appears to introduce only a minor bias into the process of NGS. Therefore, different strategies of RNA species pre-selection and adapter ligation should be evaluated using independent validation methods, e.g. RT-qPCR.
To the best of our knowledge, this is the first study to compare the small RNA transcriptomes in biological groups on a statistical basis. For this purpose, we used 10 primary NBs with very heterogeneous clinical courses and compared patients cured of their disease to patients who died from the tumor. We detected significant and specific differential miRNA expression in these two groups. Cluster analyses were able to separate the groups exactly. This finding supports the notion that tumor aggressiveness is reflected in the miRNA transcriptome.
We further focused on the analysis of miRNAs that were previously proposed to be differentially expressed between favorable and unfavorable NBs. The miRNAs of the miR-17-92 cluster are expressed as a long primary, polycistronic transcript, and are prototypic of oncogenic miRNAs [reviewed in (16)]. The miR-17-92 cluster is sufficient to transform hematopoetic cells (44), and is regulated by transcription factors of the MYC family (15,45). In NB, miR-17-92 expression correlates with MYCN amplification and adverse outcome (9,16), which was also confirmed in the data presented here. Our study is also the first to report absolute expression data of the miR-17-92 cluster in malignant tumors. Interestingly, the tumor-suppressive miRNAs, miR-542-5p and miR-628, are moderately expressed in favorable NBs and nearly absent in unfavorable NBs. The role of known players of the small RNAome in NB was confirmed in this study, and these miRNAs were absolutely quantified for the first time.
We also used an unbiased approach to analyze other miRNAs differentially expressed between the two divergent clinical groups in our study. Comparing the distribution of raw P-values to the uniform distribution expected for random data revealed an enrichment of small P-values (Figure 2D), indicating a principle difference between the small miRNA transcriptomes of favorable and unfavorable NB. This observation was further supported by the fact that clustering based on all miRNAs resulted in a robust separation of both groups (Supplementary Figure S6). However, identification of single differentially expressed miRNAs were complicated by the small number of cases analyzed. After correction for multiple testing, only one miRNA, miR-181a-2*, remained significant. We therefore report the 40 most differentially expressed miRNAs ranked according to their raw P-values (Figure 2B). A substantial number of miRNAs among the 40 most differentially expressed miRNAs show expression patterns in accordance with published results. These miRNAs include miR-25 (20), miR-181a (9), miR-542-5p (20), miR-324-5p (9), miR-628-3p (21), miR-323-5p (9,20), miR-654 (20), miR-190 (20) and miR-149 (20). In contrast to Loven et al. (46), we here report miR-199 to be upregulated in unfavorable NB. However, while Loven et al. solely refer to an in vitro system, we previously reported miR-199 to be upregulated in an independent cohort of MYCN-amplified unfavorable primary tumors (16), supporting our current results. Most surprisingly, several miR* forms were identified among these miRNAs, including miR-181a-2*, which was also expressed at very high absolute levels. The high number and abundance of miR* forms is consistent with recent reports (24,26,47), and motivated us to further analyze the expression of miR-5p/-3p pairs in our dataset.
Interestingly, there was a high correlation of the expression ratios of miR and respective miR* forms in miRNAs previously reported to be differentially expressed in NB (Figure 2A). Expression of these miRNA pairs reflected the expected expression ratio of miR*/miR pairs below 0.15. When all miRNAs were considered (Figure 3B), we found that some star forms are expressed at higher levels than their non-star counterparts, but we note that this is mainly restricted to miRNAs with overall low expression. Therefore, the observed results are in agreement with the naming convention. One could have hypothesized that this might be different in tumors, but our data provide no evidence for this in NB. Finally, we focus on miR-3p versus miR-5p expression (Figure 3C), as in NB neither the expression of most miR-3p forms nor the ratio between miR-5p and -3p has been analyzed before. In general, we observe higher expression of miR-3p than miR* as compared to their respective siblings, which is again consistent with the naming convention. Although the presence and in very few instances high abundance of miR-3p has been described before, we here confirm this finding in NB and report some miRNAs with remarkably high miR-3p/-5p ratios in NB (e.g. miR-324). On the other hand, some miR-3p/-5p ratios are very low, and our findings might hint at the fact that these miRNAs have to be reclassified. Most interestingly, no systematic differences were found in miR-5p/-3p ratios observed between the clinically defined EFS and DoD groups analyzed here. Nevertheless, differences for single miRNAs with regard to the corresponding sibling were identified between these two groups, but did not remain significant after multiple testing correction (Supplementary Figure S10). We conclude that the relative stability of both miRNA forms is either not regulated differentially in NB of divergent clinical course or that differences are subtle and can only be detected in a larger cohort.
Sequencing-based approaches can also give insight into fine tuning of miRNA expression by editing. We confirm previous findings that editing of miRNAs is most prominent at the 3′-end (27). Although a substantial proportion of editing events detected in this study can be explained by the previously described A to I editing, other editing events (e.g. G to A) detected here have not yet been described, and the mechanisms involved remain elusive. The most frequently edited positions are  and
and  (positions with regard to the 3′-end found in miRBase). Surprisingly, base changes at position
  were consistently observed more often than base changes at position
  . It remains to be elucidated whether this is a biological phenomenon or reflects an inherent breakpoint. The latter hypothesis is supported by the observation that a major miRNA-like fraction of size 17 bp was detected (Figure 1A). Regarding inconsistencies with reference miRNA sequences, we also detected missing bases at positions
  and
and  as well as terminal additions, mainly of the nucleotides A and U (Supplementary Figure S11 for details). The latter phenomenon is consistent with previous reports (13,24,40,41) and might be involved in stabilization of the respective miRNAs. Of note, no difference was observed between favorable and unfavorable NB. It has to be emphasized that the conservative mapping approach used in this study also prevented the detection of spurious editing sites due to homology of miRNAs and tRNAs (detailed description of editing events are included as Supplementary Figure S11).
In addition to the analysis of known miRNAs, we also sought to identify new miRNAs. For this purpose, we used the miRDeep algorithm to identify miRNAs without prior information (42). Application of miRDeep to our sequenced RNA data produced a significant proportion of predicted miRNAs (>60%) that were known and validated. Clustering and additional filtering methods resulted in the identification of 13 putative novel miRNAs in this study, three of which were the subject of further confirmatory analysis. Indeed, expression of these miRNAs was confirmed in a larger NB-cohort (n = 70) using RT-qPCR, with two of the three miRNAs being associated with clinical course. However, the functional implication of these novel putative miRNAs in NB tumor biology remains to be explored.
We detected expression differences of miRNAs between favorable and unfavorable NB, including differential expression of previously known oncogenic and tumor-suppressive miRNAs. Based on our results, it can be expected that miRNA profiling will also be of general value for assessment of aggressiveness in other tumor entities. Our data provide absolute miRNA expression counts and novel insights into the correlation of miR/miR* expression as well as addressing the phenomenon of miRNA editing in a variety of isomiRs. The functional implication of miRNA editing in tumor biology warrants further analysis. We conclude that NGS is a valid tool to explore the quantitative and qualitative differences in the small RNA transcriptomes of primary tumors.
ACCESSION NUMBER
Sequencing data is available at the NCBI Sequence Read Archive (SRA) (http://www.ncbi.nlm.nih.gov/Traces/sra/, accession no. SRA009986).
FUNDING
National Genome Research Network (NGFNplus grant no. PKN-01GS0894-5b to J.H.S., A.E. and A.S.) German Ministry for Education and Research (BMBF); European Union (Framework 6, EET-Pipeline, contract 15 no. 037260 to J.H.S., A.E. and A.S.). Funding for open access charge: Institution (University Children's Hospital); German Clusters of Excellence “Inflammation at Interfaces” and “The Future Ocean” as well as the NGFNplus Network “Environmental Disorders” (to P.R. and S.S.).
Conflict of interest statement. None declared.
ACKNOWLEDGEMENTS
We thank Frank Berthold and Barbara Hero from the German Neuroblastoma Study Trial Office for providing clinical data and tumor material. The authors would like to acknowledge the valuable technical help and expertise of Markus Schilhabel and Lena Bossen.

Comments