


Abstract
Promoting the recovery of motor function and optimizing rehabilitation strategies for stroke patients is closely associated with the challenge of individual prediction. To date, stroke research has identified critical pathophysiological neural underpinnings at the cellular level as well as with regard to network reorganization. However, in order to generate reliable readouts at the level of individual patients and thereby realize translation from bench to bedside, we are still in a need for innovative methods. The combined use of transcranial magnetic stimulation (TMS) and EEG has proven powerful to record both local and network responses at an individual’s level. To elucidate the potential of TMS-EEG to assess motor recovery after stroke, we used neuronavigated TMS-EEG over ipsilesional primary motor cortex (M1) in 28 stroke patients in the first days after stroke. Twenty-five of these patients were reassessed after >3 months post-stroke. In the early post-stroke phase (6.7 ± 2.5 days), the TMS-evoked EEG responses featured two markedly different response morphologies upon TMS to ipsilesional M1. In the first group of patients, TMS elicited a differentiated and sustained EEG response with a series of deflections sequentially involving both hemispheres. This response type resembled the patterns of bilateral activation as observed in the healthy comparison group. By contrast, in a subgroup of severely affected patients, TMS evoked a slow and simplified local response. Quantifying the TMS-EEG responses in the time and time-frequency domain revealed that stroke patients exhibited slower and simple responses with higher amplitudes compared to healthy controls. Importantly, these patterns of activity changes after stroke were not only linked to the initial motor deficit, but also to motor recovery after >3 months post-stroke. Thus, the data revealed a substantial impairment of local effects as well as causal interactions within the motor network early after stroke. Additionally, for severely affected patients with absent motor evoked potentials and identical clinical phenotype, TMS-EEG provided differential response patterns indicative of the individual potential for recovery of function. Thereby, TMS-EEG extends the methodological repertoire in stroke research by allowing the assessment of individual response profiles.
See Fowler and Kalaria in Brain Communications (doi: ) for a joint scientific commentary on this article and ‘Structural brain networks and functional motor outcome after stroke—a prospective cohort study’ by Schlemm et al. ().
Introduction
Recovery post-stroke is enabled at different scales ranging from single cells to whole-brain networks (Cramer, 2008). Within minutes and hours after a stroke, a cascade of cellular and biochemical processes is triggered, resulting not only in necrosis and inflammation but also in the formation of new synapses, and the sprouting of axons, contributing to the restoration of function (Carmichael, 2006; Cramer, 2008). These fundamental principles post-stroke govern neuroplasticity and hence lay the foundation for recovery. Consequently, neurorehabilitative approaches aim at reducing detrimental while supporting beneficial processes (Langhorne et al., 2011). However, the wealth of data about the pathophysiological neural underpinnings post-stroke is contrasted by the dearth of data concerning how to effectively promote the potential for recovery in individual patients (Stinear, 2010).
To date, the degree of motor impairment in the first days post-stroke is the simplest prognostic factor for motor outcome (Kwakkel and Kollen, 2008; Veerbeek et al., 2011; Stinear et al., 2012). Its specific prognostic value is, however, limited by considerable interindividual variability (Stinear et al., 2012). Here, neurophysiological as well as neuroimaging methods have not only provided insights into the mechanisms underlying recovery at the systems level (Talelli et al., 2006; Seitz, 2010) but also add valuable information to the prediction of motor recovery (Kim and Winstein, 2016; Stinear, 2017). Accordingly, as a measure of the functional integrity of descending corticomotor pathways, the presence of motor evoked potentials (MEP) early after stroke is a robust marker of good motor outcome (Stinear, 2017). However, the absence of an MEP does not necessarily exclude a favourable outcome (Pizzi et al., 2009; Stinear, 2017). One reason may be that MEPs bear the constraint of being limited to the function and output of the primary motor cortex (M1) and the corticospinal tract (Stinear, 2017). By contrast, motor performance rather relies on the processing within a broader network of brain regions. This restriction can be overcome by neuroimaging enabling the assessment of the entire sensorimotor system. In this context, functional MRI studies have revealed that the reorganization of cortical motor network activity and connectivity is related to the recovery of motor function post-stroke at the group level (Ward et al., 2003; Grefkes et al., 2010; Grefkes and Fink, 2014). Furthermore, lesion-induced disruption of white matter integrity as measured by diffusion MRI has also been shown to be associated with motor outcome (Boyd et al., 2016; Stinear, 2017). Notwithstanding, by predominately identifying network reorganization at the population level, individual clinical measures, neurophysiological, or neuroimaging markers alone have rarely crossed the border to biomarkers that are widely used in the clinical routine. Here, the predict recovery potential (PREP) algorithm (Stinear et al., 2012), sequentially combining clinical as well as transcranial magnetic stimulation (TMS) and neuroimaging parameters, constitutes an exception that, with its further development to PREP2 (Stinear et al., 2017b), has proven useful in a clinical setting (Stinear et al., 2017a). Nevertheless, there is still a great need for novel methods that allow us to accurately predict the potential of functional recovery in individual patients (Sato et al., 2015).
In this regard, an innovative approach assessing motor system integrity is to combine TMS and EEG (Ilmoniemi and Kičić, 2009). The combination enables one not only to study the immediate TMS-induced neural response at the site of stimulation but also to characterize network effects due to the propagation of induced activity to distant brain regions functionally connected to the stimulation site (Bortoletto et al., 2015). Thus, TMS-evoked EEG potentials (TEPs), i.e. the cortical response to TMS, provide a read-out of neuronal properties in lesioned motor regions while simultaneously assessing the integrity of the entire functional system. TMS-EEG additionally holds a range of advantages compared to the conventional methods of TMS or functional MRI: by transcranially exciting a cortical region and directly recording its response, TMS-EEG neither relies on the integrity of peripheral pathways nor on the ability to perform a behavioural response. These properties render TMS-EEG particularly useful in stroke patients, especially in severely affected/plegic patients (Sato et al., 2015).
Therefore, to elucidate the potential of TMS-EEG in recovery of motor function after stroke, we used neuronavigated TMS in combination with high-density EEG to measure the brain responses of ipsilesional M1 in 28 first-ever ischaemic stroke patients with unilateral mild-to-severe motor deficits in the early subacute stage (<2 weeks post-stroke). Furthermore, we reassessed 25 patients between more than 3 and 6 months post-stroke. Importantly, concerning translation, patients presented with a broad spectrum of different lesion locations ranging from the brainstem to cortex. However, none of the patients featured direct lesions of the stimulated motor cortex. We hypothesized that TMS-evoked EEG responses upon ipsilesional M1 stimulation differentiate between healthy subjects and stroke patients in the time and time-frequency domain. We furthermore assumed a close link of these alterations with the motor deficit and clinical state as well as with the amount of motor recovery after >3 months post-stroke.
Materials and methods
Subjects
Twenty-eight hospitalized stroke patients [three females, 25 right-handed, according to the Edinburgh Handedness Inventory (EHI), mean age 65.7 ± 10.1 years (mean ± standard deviation, SD); range 49–85] with mild to severe motor deficits [Action Research Arm Test (ARAT): 21.6 ± 23.7; 0–55; National Institutes of Health Stroke Scale (NIHSS): 8.3 ± 7.1; 1–36] due to a first-ever ischaemic stroke were recruited from the Department of Neurology, University Hospital of Cologne. Patients were included based on the following inclusion criteria: (i) age between 40 and 90 years; (ii) ischaemic stroke as verified by diffusion-weighted MRI (DWI); (iii) within the early subacute stage, ≤14 days elapsed from symptom onset (6.7 ± 2.5 days post-stroke; 2–12); and (iv) unilateral hand motor deficit. The age cut-offs were defined in order to recruit a representative sample of stroke patients. Exclusion criteria were: (i) any contraindication to TMS (e.g. epilepsy, pacemaker) (Rossi et al., 2009); (ii) bi-hemispheric infarcts; (iii) cerebral haemorrhage; and (iv) cognitive impairments or aphasia that impeded informed written consent. The patient cohort represented a broad spectrum of upper limb impairments with a high proportion of severely affected or plegic patients. Twelve patients presented with no residual motor function of the upper limb. Sixteen patients featured no detectable MEP upon TMS with maximal stimulator output (MSO). Table 1 provides further details on the patient group. Twenty-five patients were available to be reassessed at least 3 months post-stroke (132.4 ± 23.5 days post-stroke; 99–183).
Patient characteristics
| Patient | Age: Gender | Handedness | Lesion side/location | Lesion volume, mm3 | Days post- stroke | MEP, mV Session I/II | NIHSS Admission/ Session I/II | Rel. grip strength, % Session I/II | ARAT Session I/II | Motricity Index Session I/II | |
|---|---|---|---|---|---|---|---|---|---|---|---|
| Subgroup | ID | ||||||||||
| I | 1 | 71: M | R | R/striatocapsular | 6840.3 | 5 | 0.00/– | 7/9/7 | 0.0/0.0 | 0/0 | 19.5/25.5 |
| I | 2 | 63: M | R | R/partial MCA | 15 370.4 | 5 | 0.00/0.00 | 10/7/1 | 0.0/14.1 | 4/50 | 58.0/86.0 |
| I | 3 | 68: M | R | R/lenticulostriate, parietooccipital | 7659.5 | 6 | 0.00/0.00 | 9/10/9 | 0.0/0.0 | 0/0 | 13.5/13.5 |
| I | 4 | 54: M | R | R/lenticulostriate | 4625.1 | 7 | 0.00/0.063 | 11/8/2 | 19.3/47.6 | 3/57 | 49.0/79.5 |
| I | 5 | 53: M | R | L/pons | 5528.8 | 5 | 0.00/– | 15/12 | 0.0 | 0/– | 0.0/– |
| I | 7 | 78: M | L | L/basal ganglia | 5283.0 | 11 | 0.00/0.00 | 7/7/3 | 2.3/13.9 | 3/7 | 16.5/67.5 |
| I | 9 | 61: M | R | L/partial MCA | 68064.7 | 9 | 0.00/0.12 | 3/12/6 | 0.0/0.0 | 0/0 | 0.0/31.0 |
| I | 17 | 75: F | R | L/pons | 5411.2 | 6 | 0.00/0.00 | 8/12/7 | 0.0/0.0 | 0/0 | 0.0/45.5 |
| I | 18 | 79: F | R | L/corona radiata | 3302.6 | 7 | 0.00/0.11 | 3/10/2 | 0.0/63.5 | 0/20 | 18.5/81.5 |
| I | 19 | 80: M | R | R/corona radiata | 4173.2 | 2 | 0.00/0.00 | 3/10/6 | 0.0/0.0 | 0/3 | 16.0/52.0 |
| I | 22 | 59: M | L | R/basal ganglia | 102 622.3 | 7 | 0.00/– | 14/11/10 | 0.0/0.0 | 0/0 | 41.0/29.0 |
| I | 23 | 51: M | R | L/partial MCA | 204 168.2 | 12 | 0.00/0.00 | 18/14/9 | 0.0/17.3 | 0/4 | 14.0/48.0 |
| I | 26 | 59: M | R | L/internal capsule | 2152.7 | 7 | 0.00/0.04 | 11/7/5 | 29.3/26.9 | 3/38 | 45.5/67.5 |
| I | 27 | 73: M | R | R/medulla oblongata | 573.1 | 7 | 0.11/– | 7/7/– | 0.0/– | 3/– | 21.5/– |
| I | 28 | 68: M | R | L/lenticulostriate | 20 774.3 | 11 | 0.00/0.00 | 36/11/9 | 0.0/0.0 | 0/0 | 13.5/16.0 |
| II | 6 | 49: F | R | R/partial MCA | 8695.4 | 6 | 0.00/0.12 | 4/5/3 | 48.3/59.9 | 27/51 | 47.0/69.5 |
| II | 8 | 59: M | L | L/ internal capsule | 1688.5 | 5 | 0.19/0.47 | 2/1/1 | 58.3/38.8 | 54/53 | 86.5/87.5 |
| II | 14 | 58: M | L | L/centrum semiovale | 2850.7 | 6 | 0.16/– | 1/1/– | 70.4/– | 53/– | 92.0/– |
| II | 15 | 63: M | R | R/partial MCA | 27 702.7 | 9 | 0.28/0.17 | 5/4/0 | 48.7/92.1 | 48/57 | 88.5/99.0 |
| II | 16 | 74: M | L | L/basal ganglia | 1822.1 | 5 | 0.00/0.16 | 7/5/2 | 23.8/77.9 | 47/55 | 83.0/83.5 |
| II | 24 | 74: M | R | R/partial MCA | 23 907.9 | 6 | 0.37/1.04 | 8/4/2 | 67.2/74.8 | 52/57 | 77.0/99.0 |
| II | 25 | 52: M | R | L/partial MCA | 18 499.6 | 4 | 0.44/0.96 | 14/8/2 | 65.8/93.8 | 22/56 | 61.5/99.0 |
| III | 10 | 71: M | R | R/lenticulostriate | 23 867.4 | 5 | 3.61/0.56 | 1/1/0 | 88.8/70.3 | 54/57 | 87.5/87.5 |
| III | 11 | 53: M | R | R/MCA | 66 859.7 | 7 | 0.55/0.14 | 11/2/0 | 85.9/100.0 | 55/57 | 91.5/99.0 |
| III | 12 | 85: M | R | R/pons | 1311.5 | 9 | 0.61/1.83 | 6/4/0 | 94.7/91.3 | 48/57 | 80/95.0 |
| III | 13 | 69: M | R | R/partial MCA | 17 269.6 | 2 | 2.47/1.53 | 7/4/0 | 79.5/86.1 | 45/51 | 84.5/85.5 |
| III | 20 | 76: M | R | R/partial MCA | 108 988.8 | 10 | 0.91/0.78 | 4/2/2 | 80.0/96.0 | 53/54 | 90.0/95.5 |
| III | 21 | 64: M | R | L/internal capsule | 1851.5 | 7 | 0.24/0.11 | 1/5/1 | 83.3/58.3 | 31/54 | 76.5/81.5 |
| Mean | 65.3 | 6.7 | 0.35/0.37 | 8.3/6.9/3.6 | 24.5/44.9 | 21.6/33.5 | 49.0/69.0 | ||||
| SD | 10.3 | 2.5 | 0.81/0.53 | 7.1/3.8/3.3 | 26.5/38.0 | 23.7/25.7 | 33.7/28.1 | ||||
ARAT = Action Research Arm Test; F = female; L = left; M = male; R = right; Subgroup I = severe, II = moderate, III = mild.
Fifteen age-matched healthy participants without any history of neurological or psychiatric disease (two females, 14 right-handed according to the EHI, mean age 62.2 ± 13.0 years; 51–76) served as a comparison group. All participants gave informed written consent before entering the study, which had been approved by the local ethics committee at the University of Cologne, and which was carried out under the Declaration of Helsinki.
Motor tests
We assessed four motor and clinical parameters at each session: (i) NIHSS rating the global neurological impairment (http://www.ninds.nih.gov/doctors/NIH_Stroke_Scale.pdf); (ii) Motricity Index classifying muscular strength in the proximal, middle and distal joints of arms and legs (Demeurisse et al., 1980); (iii) Action Research Arm Test (ARAT) evaluating gross and fine upper limb function (Lyle, 1981); and (iv) maximum grip force assessed separately for each hand in three consecutive trials using a vigorimeter (KLS Martin Group). For further analysis, we computed a grip strength index representing the relative grip strength of the stroke-affected relative to the unaffected hand [mean grip force (affected hand)/mean grip force (unaffected hand) × 100].
TMS-EEG recordings
TMS was performed using a Magstim Super Rapid2 stimulator (The Magstim Co. Ltd.) equipped with a Magstim 70 mm figure-of-eight Alpha Film Coil. The position of the coil was tracked and recorded using a frameless computerized stereotaxic neuronavigation system (BrainSight V.2.0.7; Rogue Research Ltd.).
TMS-evoked EEG potentials were recorded using a TMS-compatible 64-channel EEG system (BrainAmp DC, BrainProducts). The amplifier prevents saturation and allows continuous data recording during the application of TMS pulses. The EEG signals were sampled at a frequency of 5 kHz with a resolution of 0.1 µV per bit, and filtered with high-pass 0.1 Hz and low-pass 1 kHz. Scalp EEG was recorded by 62 TMS-compatible Ag/AgCl sintered ring electrodes mounted on an elastic electrode cap (EasyCap-Fast’n Easy 64Ch) following the standard layout and the international 10-20 system. The two remaining electrodes of the 64-channel system were used to record horizontal and vertical eye movements as well as blinks by positioning one electrode next to the outer canthus of the left eye and the other below the right eye.
To optimize TMS compatibility, the impedance of all electrodes was kept below 5 kΩ throughout the whole experiment. Moreover, to prevent EEG auditory evoked potentials as well as eye blinks or eye muscle reactions induced by the TMS click, participants wore inserted earplugs (Ilmoniemi and Kičić, 2009; Braack ter et al., 2015). Bone conduction produced by TMS was minimized, placing a thin layer of plastic film between the TMS coil and the EEG cap (Massimini et al., 2005, 2007).
Although masking the TMS click with white noise should always be aspired to, this proved to be stressful in our setting with acute stroke patients, given the need for intensities up to 90 dB for reliable masking (Braack ter et al., 2015). However, the confounds of peripheral coactivation to the cortical nature of TMS-EEG responses (Belardinelli et al., 2019; Conde et al., 2019) are a matter of recent debate (Belardinelli et al., 2019; Conde et al., 2019). Our results below will render a major confounding of peripheral coactivation unlikely (Belardinelli et al., 2019; Conde et al., 2019), given a significant group difference in the TMS-evoked EEG responses between patients and healthy subjects, but also the variability within the patient group. Furthermore, the observed link between TMS-EEG properties and clinical parameters provides further evidence that the signal captures a biologically relevant neural signal.
Experimental procedure
Before each TMS-EEG session, the ‘motor hotspot’ of the ipsilesional M1, the MEP status, and, subsequently, the resting motor threshold (RMT) were assessed (see Supplementary material for further details on TMS parameters and RMT). Importantly, the MEP status of the patients and the RMT were always determined before placing the EEG cap. However, as the EEG cap might increase the intensity needed to evoke an MEP because of the augmented coil-cortex distance, RMTs were always confirmed or adjusted after capping. The MEP status was categorized by gradually increasing stimulation intensity until MEPs of any amplitude at a consistent latency could be elicited at rest in at least 5 of 10 trials. If no response was obtained that met these criteria, even with 100% MSO, the patient was categorized as MEP negative (Stinear et al., 2012, 2017b). In the case of detectable MEPs, the cortical excitability of ipsilesional M1 was assessed by MEP amplitudes (Table 1). For this purpose, 10 MEPs were evoked with 110% of individual RMT at a frequency of ∼0.2 Hz. In case we could not evoke MEPs over the ipsilesional hemisphere even with MSO (n = 16), we used the contralesional RMT as a reference for the individual threshold. The rationale behind this procedure was to avoid spuriously high stimulation intensities resulting from remote, i.e. lesioned-induced disconnection effects rather than reduction of neuronal excitability of M1. Furthermore, previous studies have shown that although the corticomotor excitability of the ipsilesional hemisphere changes dependent on time post-stroke and the degree of motor impairment, contralesional excitability remains relatively stable over time (Byblow et al., 2015; Stinear et al., 2015) and does not differ from healthy subjects (McDonnell and Stinear, 2017). In case of undetectable MEPs over the ipsilesional hemisphere we used anatomical landmarks, i.e. the hand knob, to define the ipsilesional motor hotspot.
During the EEG recordings at least 100 trials of single TMS pulses were applied to the motor hotspot of the ipsilesional M1 with a randomly jittered inter-trial interval of 6.5–8.0 s with 80% RMT. This intensity is above the threshold for a significant EEG response (Komssi et al., 2004; Rosanova et al., 2009; Casali et al., 2010). Furthermore, a subthreshold stimulation intensity limits reafferent somatosensory feedback, which is known to impact on the EEG response (Paus et al., 2001; Fecchio et al., 2017). During the TMS-EEG recordings, subjects were seated in a comfortable chair and were asked to stay awake with eyes open. Severely affected patients, who were unable to sit in a chair because of trunk weakness (n = 12), were assessed in bed with a 45° incline of the head section, awake, and with their eyes open.
Data analysis
Data preprocessing and analyses were performed using MATLAB R2017b (The MathWorks, Massachusetts, USA) and in-house scripts based on functions of the open-source toolbox EEGLAB (https://sccn.ucsd.edu/eeglab/) (Delorme and Makeig, 2004). EEG responses to TMS were visually inspected to reject artefact-contaminated single trials and channels. At least 90 artefact-free trials per subject were used for further analyses (number of artefact-free single trials: patients: 96.8 ± 10.4 SD, healthy controls: 97.5 ± 25.0 SD; number of interpolated channels: patients: 5.0 ± 1.4 SD, healthy controls: 3.9 ± 2.0 SD). The TMS artefact between −2 ms and 10 ms relative to TMS pulse onset was removed. Missing data were replaced with baseline (Rogasch et al., 2017). Subsequently, data were detrended, band-pass and band-stop filtered (1–60 Hz; 49–51 Hz; Butterworth third order), downsampled at 625 Hz, and segmented in time windows of −1000 ms to +1000 ms around the TMS pulses (Casarotto et al., 2016). Bad channels were spherically interpolated (Fecchio et al., 2017). EEG signals were average re-referenced and baseline corrected (Casarotto et al., 2016). By using the EEGLAB function runica, independent component analysis was applied to remove residual TMS-related artefacts as well as ocular or muscle artefacts (Rogasch et al., 2014).
To compare the local TMS-evoked EEG activity of ipsilesional M1 between patients and controls, we first calculated the local mean field power (LMFP), which quantifies the evoked electric field as a function of time (Casarotto et al., 2012). Based on the TMS-EEG response morphology of the simple, biphasic slow wave with a large positive wave lasting ∼100 ms in seven stroke patients (Figs 1 and 2), we analysed two distinct time intervals, an early time window between +10 ms to +100 ms and a later interval from +100 ms to +200 ms.
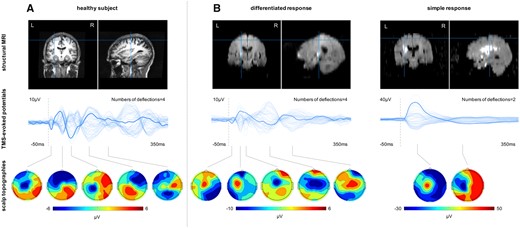
TMS-EEG responses to M1 stimulation in representative subjects. (A) Healthy subject. (B) Stroke patients. Top row: Lesion location. Middle row: Butterfly plot representing all 62 EEG electrodes (bold line: stimulation electrode/C3). Bottom row: Topographic plots of the TMS-evoked responses.
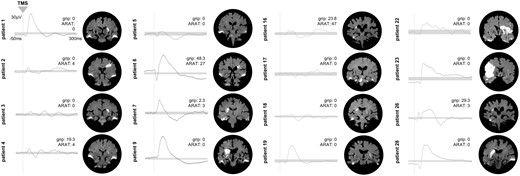
Differential TMS-EEG responses in the subgroup of patients with no evocable MEP. Individual TMS-EEG responses of the stimulated ipsilesional motor cortex for all patients (n = 16) without an MEP in the early subacute phase post-stroke. Grey bars indicate the 99% confidence interval derived by bootstrap statistics. Next to the TEP plots, the corresponding motor scores of the individual patients are shown. In addition, coronal slices of the individual diffusion-weighted MRIs are depicted, showing the acute ischaemic lesion. Please also note that bilateral hyperintensities at the temporal lobes results from susceptibility artefacts.
Furthermore, to quantify the different response patterns with fast-frequency recurrent waves in healthy subjects and low-frequency waves in patients, respectively, we considered the number of significant deflections as a reference. Therefore, we determined the significance threshold for the averaged TMS-EEG response under the site of stimulation at an individual subject level using a bootstrap procedure on the pre-stimulus activity.
Spectral features in the time-frequency domain were evaluated by computing the event-related spectral perturbation (ERSP) based on Morlet wavelet transform. In young healthy controls, the main frequency of TMS-evoked oscillatory brain activity is specific to the site of stimulation. However, even if not directly stimulated, each cortical area also oscillates close to its natural frequency with a gradient from fast to slow, from rostral to posterior brain regions (Rosanova et al., 2009). Moreover, motor impairment due to stroke is typically associated with altered neural activation not only in the M1, but also in prefrontal and parietal cortex, which may be observed already within the first 10 days after stroke (Rehme et al., 2011, 2012). Therefore, we extracted the natural frequency, i.e. the frequency with maximum power, of the brain response upon ipsilesional M1 stimulation from three different cortical sites: ipsilesional motor cortex, ipsilesional prefrontal cortex, and ipsilesional parietal cortex. See the Supplementary material for further details on the technical details of the TMS-EEG parameters presented above.
Statistical analysis
Statistical analyses were performed using the software SPSS (Statistical Package for the Social Science, version 23, IBM). Using one-sample Kolmogorov-Smirnov-tests, we first verified that our variables followed a normal distribution to decide on parametric or non-parametric statistics.
Accordingly, significant differences were evaluated using repeated measures ANOVA and post hoc t-test or non-parametric Mann-Whitney U-test (P < 0.05). Additionally, to account for an interaction effect in non-parametric statistics, we computed a repeated measures ANOVA of the aligned and rank-transformed data (Kowalchuk et al., 2010; Wobbrock et al., 2011).
To elucidate whether significant between-group differences depended on the initial motor symptom severity, we used a 2D k-means clustering to group motor impairment, as assessed by ARAT and relative grip strength at the early subacute stage, into three clusters of mild (n = 6), moderate (n = 7), and severe (n = 15) impairment (see Supplementary material for further details on group clustering). Based on this group classification, we subsequently used a univariate ANOVA, and Kruskal-Wallis tests to reveal between-group differences. Again, t-tests or Mann-Whitney U-tests were used post hoc.
Finally, we tested whether the observed alterations of TMS-evoked EEG activity were related to the initial clinical impairment or motor recovery 3 months post-stroke. Therefore, we computed a motor composite score for the first days after stroke from the individual (i) ARAT scores of the affected hand; (ii) the relative grip force; and (iii) the motricity index scores of the affected arm using a principal component analysis (PCA) (Rehme et al., 2011). The NIHSS scores were not included but used to test for correlations with the global neurological impairment.
To generate the composite recovery score, we first calculated the relative differences [d(x, y) = (x − y) / 1 + y, where d = difference score; x = score at time point 1; y = score at follow-up] between the first session and the follow-up session for each parameter of interest, i.e. ARAT, grip strength, and motricity index. Subsequently, the z-standardized difference scores were again entered into a PCA, in which the first component represented the motor recovery of the upper limb (Rehme et al., 2011).
We also tested for associations between the MEP status and the initial impairment as well as recovery in order to elucidate whether TMS-EEG responses add to the prognostic value of MEPs (Stinear, 2017), especially for MEP-negative patients. In addition, linear regression analyses with the composite recovery score as dependent variable and initial motor composite score and MEP amplitudes or TMS-EEG parameters as independent variables were computed.
Because the initial deficit is known to have an impact on the amount of recovery, correlation analyses were computed as partial correlations accounting for the initial impairment. Post hoc tests and correlations were false discovery rate (FDR)-corrected for multiple comparisons.
Voxel lesion symptom mapping
To assess whether stimulation effects were associated with lesion locations, we conducted voxel lesion symptom mapping (VLSM) based on the DWI lesion extents using the non-parametric mapping (NPM) software (Rorden et al., 2007). See the Supplementary material for further details.
Data availability
The data that support the findings of this study and all custom-written MATLAB codes are available from the corresponding author upon reasonable request.
Results
Cortical excitability
Compared to healthy subjects (55.0 ± 11.2% MSO), the RMT of the patients was significantly higher in the lesioned hemisphere both in the early subacute phase [81.0 ± 23.4% MSO; P < 0.001, t(40.7) = 4.92, two-sided two-tailed t-test, Bonferroni-corrected; patients with no evocable MEP at maximal MSO were counted as 100% RMT] and >3 months later [70.6 ± 20.3% MSO; P = 0.003, t(35) = 3.24]. RMT significantly decreased in patients from the first weeks post-stroke to >3 months [P = 0.03, t(23) = 2.21].
However, in case of absent MEPs even upon maximal MSO, the contralesional M1 served as a reference for the individual threshold used for TMS-EEG. Importantly, because of this procedure, the actual average stimulation intensity did not significantly differ between patients and healthy controls, neither in the first weeks (58.2 ± 12.3% MSO, P = 0.4) nor after >3 months after stroke onset (59.4 ± 9.9% MSO, P = 0.23). The same applies when considering the RMT of patients with evocable MEPs only (55.8 ± 11.3% MSO). Hence, differences between groups cannot be explained by differences in stimulation intensities.
Characterization of TMS-evoked cortical activity after stroke
Evaluating the TMS-evoked EEG responses in stroke patients within the first 2 weeks post-stroke revealed mainly two starkly different natures of response morphologies triggered by TMS (Fig. 1). In the majority of patients, i.e. 21, TMS elicited a differentiated and sustained EEG response with a sequence of positive and negative deflections in both hemispheres, which persisted up to 300 ms post-stimulus and was associated with rapidly changing patterns of bi-hemispheric activation, comparable to the response observed in the healthy comparison group. By contrast, in a subgroup of seven severely affected patients, TMS over the affected M1 evoked a slow, strongly simplified and biphasic response with high amplitudes. This large wave lasted ∼100 ms, and further TMS-locked activity was almost absent. In addition, evoked activity remained local under the site of stimulation over ipsilesional M1. In this case, the complete elimination of the characteristic TEP components of healthy subjects hindered the classification of specific components. Hereafter, we therefore do not refer to TEP components, but to an early response lasting for 100 ms, and a later response phase.
These different patterns of TMS-EEG responses, i.e. simple biphasic and more differentiated pattern, could also be identified in the subgroup of patients with no evocable MEPs (Fig. 2). Hence, TMS-EEG is capable of disclosing differential motor cortex properties in patients with no residual motor function and severely disrupted corticospinal integrity as indicated by absent MEPs. Thereby, the data suggest that TMS-EEG provides a more elaborated discrimination of an otherwise homogeneous group of severely affected patients.
Stroke is associated with a large and simple early TMS-EEG response
To quantify the differences between healthy participants and patients as well as within the patients’ subgroups (mild, moderate, severe), we first compared the LMFP of the TMS-EEG response for the stimulated ipsilesional motor region addressing the characteristics of high amplitudes. We found a statistically significant difference with larger EEG responses in stroke patients compared to healthy controls [main effect Group: F(1,38) = 6.64, P = 0.014]. Moreover, repeated measures ANOVA revealed a significant interaction effect involving the factor Time period (two levels: 10–100 ms, 100–200 ms) × Group (two levels: patients, controls) [F(1,76) = 7.01, P = 0.002]. Post hoc t-tests disclosed a between-group difference with higher TMS-evoked responses in stroke patients in the early period lasting until 100 ms (P = 0.002), but not for the later period post-stimulus (P = 0.57) (Fig. 3). This finding was also evident when patients were clustered according to their initial motor impairment into severely, moderately and mildly affected groups [F(3,42) = 3.79, P = 0.018]. Especially severely and moderately affected stroke patients featured increased TMS-evoked activity in the early phase post-stimulus compared to healthy controls (severely affected: P = 0.015, moderately affected: P = 0.006, mildly affected: P = 0.26).
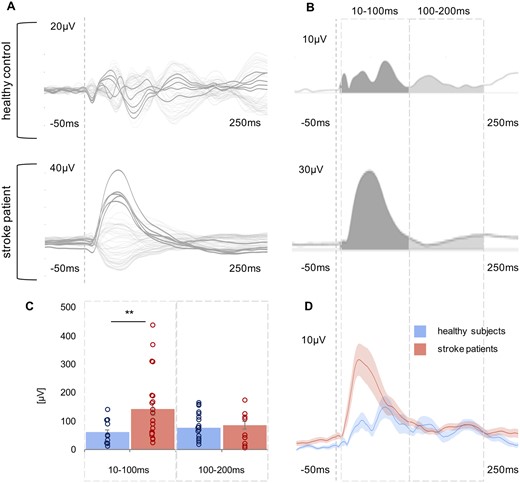
Comparison of TMS-evoked EEG potentials of the ipsilesional motor region using LMFP. (A) TMS-evoked EEG responses for one representative stroke patient and one healthy control subject are shown as butterfly plots of all channels (bold channels represent the region of interest), and (B) the corresponding LMFP with the two respective time intervals (10–100 ms; 100–200 ms). (C) For each time interval analysed, the LMFP values are shown in the bar chart for the entire group of healthy subjects and stroke patients (**P < 0.001; error bars indicate the standard error). (D) Grand-average LMFP for all stroke patients and healthy subjects. Thick traces represent the grand-average across subjects and shaded regions the standard error. Note that the dashed line indicates the timing of the TMS pulse.
To characterize the pattern of the EEG response to TMS, we determined the significant numbers of deflections induced by TMS in the first 200 ms post-stimulus at the sensor level. This analysis verified that patients showed more simple TMS responses compared to healthy controls (P < 0.001, Z = −3.67, Mann-Whitney U-test). We also detected a between-group difference when grouping the patients according to their deficits [P < 0.001, χ2(3) = 16.46, Kruskal-Wallis test]. Post hoc tests revealed that, in particular, severely affected patients featured more simple cortical response to TMS compared to healthy controls (severely affected: P = 0.02; moderately affected: P = 0.08; mildly affected: P = 0.92).
The main frequency of TMS-evoked oscillations changed early after stroke
To capture the slow characteristics of TMS-evoked EEG responses in stroke patients, we extracted the main frequency of TMS-evoked oscillatory brain activity from three cortical sites upon TMS targeted to M1: ipsilesional prefrontal, motor, and parietal cortex. A repeated measures ANOVA of the aligned rank-transformed data revealed a significant interaction effect involving the factor Site (three levels: prefrontal, motor, parietal) × Group (two levels: patients, controls) [F(2,76) = 4.49, P = 0.014] indicating a group difference in the induced natural frequency dependent on anatomical region. Post hoc tests revealed a significant group difference between healthy subjects and stroke patients for the prefrontal and motor region, but not for the parietal region (prefrontal: P = 0.036; motor: P = 0.015; parietal: P = 0.80). While, in line with previous findings (Rosanova et al., 2009), healthy controls showed an anterior-posterior gradient with higher frequencies in more rostral and low-frequency oscillations in more occipital regions, ERSP analysis confirmed that slow spectral features were also found for the motor and prefrontal region of stroke patients (Fig. 4). In addition, these between-group differences were also evident for the patient subgroups [prefrontal: P = 0.03, χ2(3) = 8.44; motor: P = 0.02, χ2(3) = 11.07; parietal: P = 0.82]. Again, primarily severely affected patients featured the slow cortical response related to TMS in prefrontal and motor regions (severely affected: prefrontal: P = 0.03, motor: P = 0.003; moderately affected: prefrontal: P = 0.11, motor: P = 0.12; mildly affected: prefrontal: P = 0.20, motor: P = 0.62).
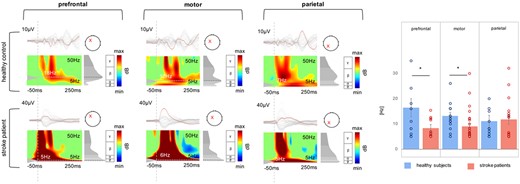
Comparison of natural frequencies using ERSP. TMS-evoked EEG responses for a representative stroke patient and one healthy control subject as butterfly plots. Red channels in the butterfly plots highlight the region of interest, i.e. prefrontal, motor, and parietal. The corresponding ERSP patterns (between 5 and 50 Hz) are shown below. Note that the red crosses indicate the region of interest for ERSP analysis and not the stimulation site, which was always the ipsilesional motor cortex. The greyscale graph plotted to the right of each ERSP reveals the power spectrum profile during 20–200 ms after TMS onset. The dotted lines indicate the frequency with maximum power, i.e. the natural frequency. The dashed line indicates the timing of the TMS pulse. The rightpanel shows a bar graph of averaged natural frequencies for each region analysed (*P < 0.05; error bars indicate the standard error).
Motor evoked potentials, initial impairment, and recovery
Overall, patients experienced substantial recovery as indexed by a decrease of the NIHSS and an increase of all behavioural scores [NIHSS: P < 0.001, t(24) = 7.93; motor composite score: P < 0.001, t(24) = −5.50]. Of note, MEP negative and severely affected patients, i.e. all MEP negative patients in the cluster of severe impairment (n = 14), also showed recovery [NIHSS: P < 0.001, t(12) = 6.75; motor composite score: P = 0.016, t(12) = 2.91]. Nine of these 14 patients (64.3%) (Table 1) exhibited some degree of recovery as defined by minimal detectable change of the motor scores (Fayazi et al., 2012; Simpson and Eng, 2013) after >3 months post-stroke.
The initial motor composite score was negatively correlated with the RMT (Pearson r = −0.82, P < 0.001, FDR-corrected; patients with no evocable MEP at maximal MSO were counted as 100% MSO) and positively correlated with the MEP amplitude (r = 0.41, P = 0.01). Thus, more severe motor deficits were related to higher RMTs and lower MEP amplitudes. However, both parameters were neither related to motor recovery (RMT: r = 0.30, P = 0.6; MEP: r = −0.25, P = 0.80), nor to recovery in general as indexed by the NIHSS (RMT: r = −0.45, P = 0.11; MEP: r = 0.28, P = 0.70) in our patient cohort with more than half of the patients being MEP negative (16 of 28). Importantly, when using MEP status, i.e. presence or absence of MEP, instead of MEP amplitudes, correlations yielded similar results. Likewise, the linear regression analysis showed that only for the subset of MEP positive patients, MEP amplitudes combined with the initial motor composite scores explained 81.8% of the variance observed for the composite motor recovery score [adjusted R2 = 0.765, F(2,9) = 15.69, P = 0.003]. By contrast, the same model failed to predict recovery when considering all stroke patients [R2 = 0.08, adjusted R2 = 0.0, F(2,24) = 0.99, P = 0.39]. Hence, especially the recovery of patients with severe deficits and absent MEPs could not be predicted. Accordingly, when testing a model for MEP negative patients with the initial motor composite score as the sole predictor variable, the model also failed [R2 = 0.001, adjusted R2 = −0.076, F(1,14) = 0.007, P = 0.94].
Relationship between TMS-EEG and initial impairment, and recovery
Therefore, we finally tested whether the observed alterations of TMS-evoked EEG activity were related to the initial impairment or motor recovery 3 months post-stroke.
In the early phase post-stroke, the significant TMS-EEG alterations of low-frequency oscillations of ipsilesional M1 and the numbers of deflections were linked to the initial motor impairment (Fig. 5A). Accordingly, less differentiated and low-frequency EEG responses were associated with stronger motor impairment as represented by the motor composite score (numbers of deflections: Spearman: r = 0.67, P < 0.001; natural frequency M1: r = 0.40, P = 0.02). Moreover, both correlations were also found for the NIHSS score at the time of the first examination (numbers of deflections: r = −0.66, P < 0.001; natural frequency M1: r = −0.34, P = 0.04).
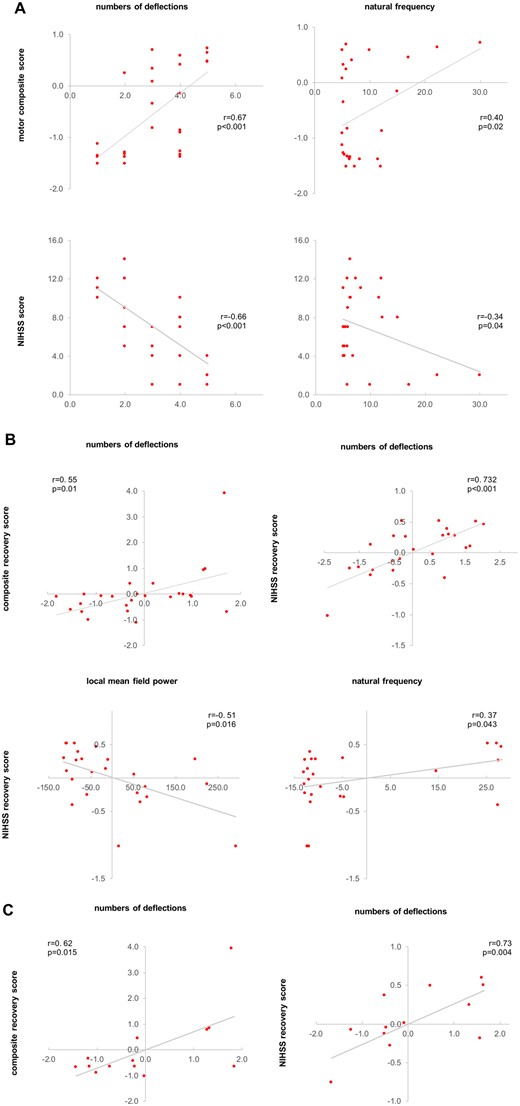
Correlation analyses. (A) Correlation analyses between initial deficit and TMS-EEG parameters. (B) Correlation analyses between recovery after >3 months post-stroke and TMS-EEG parameters. (C) Correlation analyses between recovery after >3 months post-stroke and TMS-EEG parameters only for the subset of severely affected patients (group cluster no. 1) with no detectable MEP in the first few days post-stroke. TMS-EEG parameters, as well as the recovery scores in B and C, are controlled for the initial deficit using Pearson partial correlations. Note that due to partial correlations, accounting for the initial deficit, axes show residuals of parameters.
We subsequently tested for the relationship between the TMS-evoked EEG activity and recovery. Here, we found a positive correlation between the numbers of deflections of the EEG response assessed in the first few days after stroke and better motor recovery as reflected by the composite recovery score (r = 0.50, P = 0.01). The more general neurological recovery as assessed by changes of the NIHSS score over time was significantly linked to all properties of the TMS-evoked response of ipsilesional M1 (LMFP: r = −0.51, P = 0.016; numbers of deflections: r = 0.60, P = 0.001; natural frequency M1: r = 0.37, P = 0.043). Thus, patients featuring simple and slow TMS-evoked responses with high amplitudes in the first days after stroke showed a less favourable neurological outcome.
Importantly, this association between TMS-EEG properties and recovery was verified in the clinically and electrophysiologically homogenous subgroup of MEP negative and severely affected patients, i.e. all MEP negative patients in the cluster of severe impairment (n = 14) (composite recovery score: numbers of deflections: r = 0.73, P = 0.004; NIHSS: numbers of deflections: r = 0.62, P = 0.015), further underlining the usefulness of TMS-EEG in stroke patients.
We next tested whether TMS-EEG responses add to known predictors of motor recovery after stroke and explain additional variance in motor recovery over and above the effect of initial impairment. For all stroke patients, linear regression analysis with the composite recovery score as the outcome variable and the initial motor composite score as the sole predictor revealed that the initial deficit could only explain 11.1% of the variance [adjusted R2 = 0.069, F(1,22) = 2.62, P = 0.12]. By contrast, adding the TMS-EEG parameters, i.e. LMFP, numbers of deflections and natural frequency of ipsilesional M1, to the initial deficit, as independent variables to the model, the analysis revealed that 51.7% of the variance could be explained [adjusted R2 = 0.56, F(4,22) = 3.21, P = 0.03]. Notably, as stated earlier, the equivalent model using the initial motor composite score and MEP amplitude did not yield a significant prediction of the composite motor recovery score in our cohort of stroke patients.
Relationship with stroke lesions
The highest overlaps of individual lesion maps were located at the level of the basal ganglia, i.e. in the posterior limb of the internal capsule, putamen, and parts of the thalamus (Fig. 6).
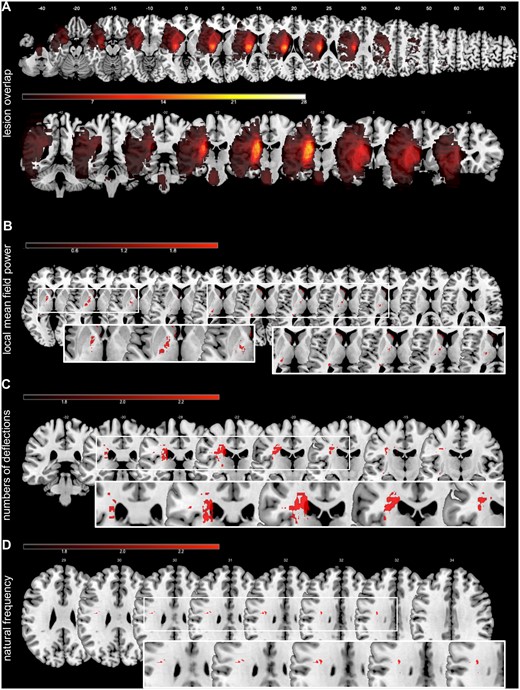
Lesion overlap and VLSM. (A) Stroke patients showed the maximum overlap at the level of basal ganglia, including the crus posterius of the capsula interna, the putamen and parts of the thalamus. (B) Lesions associated with enhanced early EEG-activity (LMFP) evoked by TMS responses. (C) Lesions related to the deterioration of the numbers of deflections of the TMS-EEG responses. (D) The bottom panel represents lesions associated with changes in natural frequencies. The colour bars represent the corresponding t-values of the VLSM analysis.
Lesion volume correlated neither with any measures of TMS-evoked EEG responses nor with the stroke-induced deficit and the subsequent recovery (all P-values > 0.2). In contrast, VLSM for the enhanced early TMS-evoked EEG-activity (LMFP) revealed an association with lesions in the internal capsule and caudate nucleus (P < 0.05, FDR-corrected at voxel-level). By contrast, simple TEP patterns and the reductions in natural frequencies were linked to lesions in the subcortical white matter of the corona radiata (P < 0.01, FDR-corrected) (Fig. 6). Hence, characteristics of slow waves were mainly related to lesions of the corticospinal tract. Thus, stroke-related alterations of TMS-evoked EEG responses seemed to be related to impaired connectivity rather than to a primary dysfunction of M1 neurons.
Discussion
By combining TMS and EEG, we here present a novel approach to assess the functional properties of the motor system in hemiparetic patients early after stroke. We found evidence for substantial alterations of the TMS-evoked EEG response over the ipsilesional motor cortex for both local and remote effects. Overall, for the majority of patients, TMS evoked differentiated activations sequentially involving distant cortical regions similar to those patterns observed in healthy individuals. However, for a subset of seven severely affected stroke patients, TMS triggered a simple and slow EEG response resembling those previously observed during non-REM sleep and in unresponsive wakefulness patients (Massimini et al., 2005; Rosanova et al., 2012, 2018). Importantly, measures of TMS-evoked EEG responses in the first days after stroke were closely related to the initial motor deficit and the amount of clinical recovery after >3 months post-stroke. Because none of the patients featured direct lesions of the stimulated motor cortex, the observed changes likely reflect a differential dysfunctional processing of the TMS-induced neural activity. Of note, patients with absent MEP responses and no residual motor function, i.e. the identical clinical and electrophysiological phenotype, still featured differential TMS-EEG responses, indicative of their potential of functional recovery.
Alterations of TMS-evoked EEG responses in stroke patients
The cortical response to TMS depends on the neural activation state as well as on synchronous activation of neural populations (Lehmann and Skrandies, 1980). Different temporal components of the TMS-evoked potentials have been related to excitatory and inhibitory neural activity of local cortical populations as well as corticocortical and corticothalamic networks (Ilmoniemi and Kičić, 2009; Pellicciari et al., 2018; Darmani and Ziemann, 2019; Tremblay et al., 2019). While early TEP components, i.e. peaks around 15 ms and 30 ms, appear to result from the local activation of the stimulated area, later peaks are thought to be associated with axonal signal propagation and bilateral distribution within the functional network (Ilmoniemi and Kičić, 2009; Tremblay et al., 2019). Besides, different peaks of the TMS-evoked potential, particularly the later components at 45 ms and 100 ms post-TMS, have been closely linked to GABAergic transmission (Premoli et al., 2014, 2018; Király et al., 2016; Tremblay et al., 2019). In contrast to the TEPs of healthy subjects, which are typically characterized by these differentiated sequences of alternating peaks, here we observed profoundly altered TEPs with an elimination of the known structure in a subgroup of patients, making a classification of specific components impossible. We, therefore, do not refer to TEP components or specific peaks but to an early and later response. Concurrently, these alterations depicted a substantial reduction of the deflections of the TMS-evoked EEG response concerning both local properties and the spreading to other brain regions. Thus, we found not only a significant impairment of the cortical activity and excitability but also a substantial disruption of connectivity in cortico-cortical and cortico-subcortical networks.
In the present study, quantifying the TMS-EEG responses in the time and time-frequency domain revealed that stroke patients exhibited slower and more simple responses, compared to healthy controls. In the latter group, TMS-induced responses featured an oscillatory frequency that was region-inherent and specific to the anatomical location, with a gradient from rostral with faster oscillations to occipital with slower natural frequencies (Rosanova et al., 2009). As in Rosanova et al. (2009), we observed this regional specificity, which is presumably mediated through cortico-subcortical connectivity, even in cortical areas that are not directly activated by TMS. By contrast, in patients in the first days after stroke, we found a diffuse decrease of the TMS-induced main frequencies in the ipsilesional prefrontal and motor regions.
A crucial role of the thalamus has been postulated in the generation of fast neural oscillations (Llinás et al., 2007). The alterations in membrane properties of cortical and subcortical, especially thalamic, neurons associated with several neurological and psychiatric conditions may result in distinctive and detectable changes of their oscillatory properties (Llinás et al., 1999, 2007; Hughes and Crunelli, 2016). In agreement, our stroke sample showed a peak in lesion overlap at the level of basal ganglia, including the thalamus. Along these lines, we found a significant relationship between the main frequency of the ipsilesional motor region and the clinical features of the patients, hence linking the slowing of TMS-evoked oscillations of M1 to motor deficits. Lesion-induced cortical deafferentation from subcortical structures may explain the slowing also observed over the ipsilesional prefrontal region. In line with that, a disruption of thalamocortical connectivity has been implicated in neuropsychiatric diseases in which a slowing of the frontal natural frequencies has also been observed (Ferrarelli et al., 2012). The simple, biphasic and slow EEG responses for the stimulation of ipsilesional M1 constitute one important finding of our study. Such slow waves have so far been observed in non-REM sleep, or anaesthesia in healthy subjects, and disorders of consciousness (Massimini et al., 2005; Rosanova et al., 2012; Sarasso et al., 2015). Of note, here we exclusively showed this pattern for the stimulation of ipsilesional M1. In stark contrast, previous studies found slow waves as a ubiquitous cortical feature irrespective of the stimulated site. Nevertheless, these pattern similarities raise the question of whether the same mechanisms identified for the former conditions may also be implicated at the local level in stroke.
Given that evoked slow waves have been associated with a breakdown of cortico-cortical connectivity during non-REM sleep, anaesthesia and severe brain lesions, one interesting, albeit speculative, hypothesis to reconcile the similar local response patterns in motor stroke patients is that all conditions have profound effects on interregional connectivity (Grefkes and Fink, 2014). Accordingly, functional and effective connectivity studies obtained with functional MRI have revealed substantial disturbances of the intra- and interhemispheric network architecture after stroke that extend far beyond the structural damage of neurons and fibre tracts (Grefkes et al., 2008; Carter et al., 2010; Wang et al., 2010). As these alterations have been associated with motor impairment in the subacute stage post-stroke (Grefkes et al., 2008; Carter et al., 2010), motor recovery seems to be paralleled by a restoration of the network communication in the chronic stage (Rehme et al., 2011). Of note, a reinstatement of the complex network interactions as measured by TMS-EEG responses also appears to drive the recovery of consciousness (Rosanova et al., 2012). In this context, the disconnection of brain regions due to a structural lesion warrants further consideration. A cortical undercut—an animal model of post-traumatic epileptogenesis—resulted in cortical slow waves (Nita et al., 2007). In accordance, our VLSM analyses showed a relationship between characteristics of TMS-evoked activity and structural lesions within the corticospinal tract, posterior limb of the internal capsule, caudate nucleus, and the corona radiata.
Besides factual structural disconnection, a critical reduction of cortico-cortical connectivity may shift the balance between inhibition and excitation towards excessive inhibition (Mann et al., 2009; Funk et al., 2017), which has already been shown to occur locally after stroke (Clarkson et al., 2010; Fanciullacci et al., 2017). In addition, white matter lesions do not only interrupt the output fibres of the cortex, but also ascending activating fibres leading to a partial deafferentation of their target region, i.e. ipsilesional M1 (Grefkes and Fink, 2014) and thereby potentially to states of high inhibition. In line with this notion, TMS studies assessing the cortical silent period have shown that lesions within the corticospinal tract increasingly activate inhibitory neuronal circuits (Classen et al., 1997; Liepert et al., 2005).
The hypothesis of disconnection of critical fibres receives additional support by the results of our VLSM analyses. Here we found abnormal characteristics of the TMS-evoked responses to be linked to lesions within the corticospinal tract, affecting potentially thalamo-cortical fibres.
Such effects may also impact on recovery of function. For example, excessive inhibitory activity within M1 can impede functional recovery (Classen et al., 1997). In turn, a decrease of GABA-mediated inhibitory processes may enhance synaptic plasticity supporting motor recovery (Carmichael, 2006; Nudo, 2007; Clarkson et al., 2010). We observed that the characteristics of the TMS-evoked response—a putative correlate for a pathologically high inhibitory tone—were related to a less favourable outcome after >3 months post-stroke. Thereby, our findings link local cortical characteristics to network dynamics that are relevant for pathological loss and recovery of motor function. However, in contrast to the studies performed during non-REM sleep or in disorders of consciousness showing that slow waves are a ubiquitous cortical feature irrespective of the stimulation site, the generalizability of our findings is limited to ipsilesional M1 and its functional network. In this respect, the question of a local occurrence of the observed TMS-evoked response in patients should be systematically assessed by multiple site testing to verify the topographical specificity of our findings for ipsilesional M1. Besides, the generalizability of the present work may be limited by the relatively small size of the patients’ subgroups as well as the relatively low proportion of female stroke patients (Carcel et al., 2019).
The usefulness of TMS-EEG in stroke research
A further aim of the present study was to establish a novel approach to detect and potentially track the neural correlates of stroke-induced motor deficits and recovery thereof complementing previous paradigms using functional MRI or TMS. A few TMS-EEG studies have provided first data that this technique can be useful to identify neurophysiological changes after stroke (Manganotti et al., 2015; Borich et al., 2016; Pellicciari et al., 2018). An exploratory study in a sample of nine stroke patients suggested alterations of the N100 component after stroke (Manganotti et al., 2015). Borich et al. (2016) furthermore found that in a sample of 10 chronic stroke patients, TMS-EEG responses were linked to abnormal interhemispheric inhibition. The study of Pellicciari et al. (2018) offered a first link between TMS-evoked alpha activity and performance in the Berg balance scale, i.e. a feature of mobility. By contrast, based on an accurate description of upper limb motor function with an elaborated battery of motor tests and a systematic characterization of TMS-EEG alterations after stroke in a clinically broad spectrum of subacute stroke patients, the present work provides a clear link between TMS-EEG parameters and both motor impairment as well as recovery of function. So far, TMS parameters such as RMT or MEPs have been used to explain motor deficits after stroke by changes of corticospinal excitability (Stinear et al., 2015). For example, the PREP algorithm, as well as its further development to PREP2, used the presence or absence of MEPs as one crucial factor to predict long-term outcome after stroke (Stinear et al., 2012, 2017b). However, although MEPs provide valuable information about the state of the corticospinal system post-stroke (Talelli et al., 2006; Stinear, 2010; Byblow et al., 2015), TMS can only indirectly evaluate pyramidal tract excitability. MEPs reflect the functional integrity along the entire corticomotor pathways and hence comprise cortical, subcortical, brainstem, spinal, and peripheral mechanisms. After a stroke, alterations at different levels, i.e. the loss of motor neurons, leading to altered excitability of the remaining cells, compromised fibre tracts, and increased inhibition, all may affect the peripheral motor response to TMS applied over the motor cortex (Stinear et al., 2007; Byblow et al., 2015; Pellicciari et al., 2018). For the present study, it remains open whether a stronger TMS machine or any kind of pre-activation manoeuvre would have turned some of the MEP negative patients into MEP positive. Therefore, an essential advantage of TMS-EEG over standard TMS-EMG applications is that it does not rely on the integrity of the corticospinal tract or other efferent and afferent pathways (Sato et al., 2015), but instead directly assesses the cortical excitability and activity (Ilmoniemi and Kičić, 2009).
Finally, TMS-EEG enriches the methodological repertoire in the assessment of stroke patients as it relies less on the participant’s ability to understand and comply with instructions, nor does it involve the processing of sensory stimuli or performing an action, which is needed in particular for task functional MRI studies (Rosanova et al., 2012; Casarotto et al., 2016). TMS-EEG, therefore, allows for a standardized assessment of stroke patients and holds the potential to provide novel markers of stroke pathophysiology with practical implications concerning the assessment, monitoring, and potentially also the enhancement of rehabilitation (Sato et al., 2015). In this vein, it may also offer a personalized readout for targeting and titrating interventions such as neuromodulation that aim at restoring connectivity and complex patterns of activity (Fink et al., 2016).
Funding
C.G. is supported by the German Research Foundation (DFG GR 3285/2-1). C.G. and G.R.F. are also supported by the University of Cologne Emerging Groups Initiative (CONNECT group) implemented into the Institutional Strategy of the University of Cologne and the German Excellence Initiative. U.Z. received grants from the German Research Foundation and the German Ministry of Education and Research. G.R.F. gratefully acknowledges additional support from the Marga and Walter Boll Stiftung.
Competing interests
U.Z. received grants from Biogen Idec GmbH, Servier, and Janssen Pharmaceuticals NV, and consulting fees from Biogen Idec GmbH, Bayer Vital GmbH, Bristol Myers Squibb GmbH, Pfizer, CorTec GmbH, Medtronic GmbH, all not related to this work. G.R.F. serves as an editorial board member of Cortex, Neurological Research and Practice, NeuroImage: Clinical, Zeitschrift für Neuropsychologie, and DGNeurologie; receives royalties from the publication of the books Funktionelle MRT in Psychiatrie und Neurologie, Neurologische Differentialdiagnose, and SOP Neurologie; received honoraria for speaking engagements from Bayer, Desitin, Ergo DKV, Forum für medizinische Fortbildung FomF GmbH, GSK, Medica Academy Messe Düsseldorf, Medicbrain Healthcare, Novartis, Pfizer, and Sportärztebund NRW, none related to this work.
References
- ARAT
= Action Research Arm Test
- ERSP
= event-related spectral perturbation
- LMFP
= local mean field power
- MEP
= motor evoked potentials
- M1
= primary motor cortex
- MSO
= maximal stimulator output
- NIHSS
= National Institutes of Health Stroke Scale
- RMT
= resting motor threshold
- TEP
= TMS-evoked EEG potential
- TMS
= transcranial magnetic stimulation

