


Abstract
Cancer cells contain many genetic alterations, and genetic instability may be important in tumourigenesis. We evaluated 58 breast and ovarian cancer cell lines for microsatellite instability (MSI) and chromosomal instability (CIN). MSI was identified in 3/33 breast and 5/25 ovarian cell lines, and 7/8 MSI lines showed an inactivation of mismatch repair. Average ploidy by centromeric fluorescence in situ hybridization (FISH) of MSI ( n = 8, average ploidy = 2.65) and microsatellite stable (MSS; n = 7, average ploidy = 3.01) cell lines was not different, due to the presence of three aneuploid MSI lines, and two near-diploid MSS lines. However, the variability of the centromeric FISH data was different between MSI and MSS ( P = 0.049). The complexity of structural chromosomal rearrangements was not different between MSI and MSS. Thus, MSI and numerical CIN are not mutually exclusive, and structural CIN occurs independently of MSI or numerical CIN. Dynamic genetic instability was evaluated in three cell lines—MSI diploid (MT-3), MSS diploid (SUM159) and MSS aneuploid (MT-1). Ten clones of each of these cell lines were analysed by centromeric FISH and six-colour chromosome painting. The variation in chromosome number was different among all three cell lines ( P < 0.001). MT-3 appeared numerically constant (94% of centromeric FISH signals matched the mode). SUM159 was 88% constant; however, 7% of cells had duplicated chromosomes. MT-1 was 82% constant; most changes were chromosomal losses. The six-colour FISH data showed that SUM159 had more stable structural chromosomal alterations (e.g. chromosomal translocations) compared with MT-3 and MT-1, but had no increase in unstable changes (e.g. chromatid breaks) when compared with MT-3. MT-1 had fewer unstable changes than both MT-3 and SUM159. These data suggest that numerical CIN may contribute to aneuploidy, but that selection plays an important role, particularly for the accumulation of structural chromosomal changes.
Introduction
Genetic instability is considered to be necessary for generating the mutations that drive tumour development ( 1 ). This concept has been reinforced by studies of microsatellite instability (MSI) and numerical chromosomal alterations ( 2 , 3 ). The discovery of increased mutation rates in colorectal cancers with somatic mismatch repair (MMR) gene inactivation represented the first strong evidence of a role for genetic instability in human cancer. Subsequently ( 3 , 4 ), it was found that cancer cell lines with MSI were generally near-diploid and had a stable chromosome complement, while MMR-proficient colorectal cancer cell lines were generally aneuploid and showed a persistent increased rate of chromosome gains and losses. This finding suggested that aneuploid cancer cell lines have an underlying segregation defect leading to chromosomal instability (CIN), a hypothesis supported by the discovery of mutations in spindle assembly checkpoint genes in CIN cell lines ( 5 ). However, others have argued that selection drives tumour development ( 6 ), and analysis of unstable structural chromosomal aberrations does support a selection mechanism for the presence of chromosomal rearrangements ( 7 ).
We have studied a collection of primarily breast and ovarian cancer cell lines (Supplementary Table I) to determine if, as with colorectal cancer, they show evidence of distinct types of genetic instability. Cell lines were analysed for MSI, aneuploidy and chromosomal rearrangements. We then examined the dynamic genetic instability in three cancer cell lines with different phenotypes to determine whether the genetic alterations observed in these cell lines are a consequence of increased mutation rate or selection. Distinguishing between genetic instability and selection in human cancer is not easy to do directly owing to the static nature of most clinical tumour material and the difficulty in obtaining suitable normal controls for rate comparisons. Fluctuation analysis is a method for determining the rate of mutation, and modified versions have been used to measure the rate of chromosome gain and loss in colorectal cancer cell lines and rates of microsatellite mutation in MSI cell lines ( 2 , 3 , 8 ). We generated single cell clones from three cancer cell lines and analysed them by centromeric and six-colour chromosome painting fluorescence in situ hybridization (FISH) to assess whether the rate of generation of chromosomal aberrations is different between cell lines with different genetic instability phenotypes.
Materials and methods
Cell lines
Cancer cell lines were obtained either from ATCC or were generous gifts from individual investigators (Supplementary Table I). Five colorectal cancer cell lines (HCT116, LoVo, DLD-1, CACO-2 and COLO205) with previously characterized genetic instability phenotypes were obtained from ATCC and used as controls in MSI and CIN assays. All the cell lines were maintained in culture as recommended by the provider. DNA was extracted using the Gentra Systems Puregene kit (Flowgen), or by standard SDS/proteinase K method. RNA was extracted from the cell lines using Trizol (Invitrogen) and cDNA was synthesized utilizing random hexamers. Microsatellite analysis (see below) showed that three of the ovarian cancer cell lines, OC314, OC315 and OC316, were genetically identical, and so presumably derived from the same tumour. The results are shown only for OC314.
MSI analysis
MSI was initially determined by PCR amplification at the mononucleotide repeat loci BAT25, BAT26 and BAT34C4 ( 9 ) in 34 breast and 27 ovarian cell lines. A subset of cell lines were also analysed at BAT40. PCR products from BAT25, BAT26 and BAT40 were analysed by electrophoresis in 12% non-denaturing polyacrylamide gels followed by silver staining. This quick analysis was sufficiently sensitive to detect MSI changes, which were generally at least 4 bp deletions ( 9 , 10 ). For BAT34C4, cell lines were also analysed by radioactive PCR and electrophoresis in 6% denaturing polyacrylamide gels to detect single base pair changes. All the cell lines with alterations at these loci and ten cell lines that showed no alterations were also analysed at the dinucleotide loci D2S1471, D13S246, D17S250 and D2S2150 and the pentanucleotide locus XuINOS. Dinucleotide repeat loci were amplified using fluorescently labelled primers and analysed using an ABI 377 automatic sequencer. Results were scored by two independent observers, with an alteration considered MSI on showing more than two alleles of equal intensity or a characteristic ‘ladder’ pattern ( 11 , 12 ). Cell lines with no alterations at the mononucleotide loci were grouped as MSS, a criterion supported by the lack of any alterations found in the 10 MSS cell lines that were included in the dinucleotide repeat analysis. Cell lines were grouped as MSI if >40% of loci analysed and scored had alterations, consistent with the current consensus for distinguishing MSI cancers ( 13 ). All PCRs with alterations were repeated to confirm MSI.
Analysis of target genes
Mononucleotide repeats at seven target genes ( TGFβRII , IGFIIR , BAX, MSH3, hMSH6, BRCA1 and BRCA2 ) and two housekeeping genes ( NSEP and NGFR ), were amplified by radioactive PCR and products electrophoresed in denaturing 6% polyacrylamide gels ( 14 ). Mononucleotide repeats in the BRCA2 gene were analysed using PCR and single-stranded conformation polymorphism (SSCP) of exon fragments 3, 10A, 11D, 11F, 11J, 11S, 22, 23, 25A ( 15 ).
Analysis of mismatch repair genes
In the case of MLH1 and MSH2 , every exon including intron–exon boundaries was amplified from genomic DNA by PCR and analysed by SSCP in a 0.6 × MDE/0.6 × TBE gel with or without 10% glycerol at 10°C. Products were visualized by silver staining and aberrant products were sequenced. MMR genes ( MLH1, MSH2, MSH3 , MSH6 , PMS1 and PMS2 ) were also amplified by RT–PCR in two or three overlapping fragments and analysed by protein truncation test. Methylation-specific PCR of the MLH1 promoter was carried out as described ( 16 ). All primer sequences are available on request.
Generation of cell line clones
Replica plates were seeded with 1 × 10 4 cells and one counted every 24 h for 96 h to obtain a growth curve. Cell doubling time was estimated by triplicate experiments. Clones were obtained by seeding each cell line at low density (50–100 cells/plate) in 0.3% agarose/1× culture medium on a 0.6% agarose/1× culture medium base. When sufficient colonies were visible, they were picked and transferred to 96-well plates in culture medium and then expanded until ∼25 generations had occurred from initial plating. Ten clones were analysed for each cell line.
FISH
Cells in culture were treated with colcemid Karyomax (Invitrogen) for up to an hour and metaphases and interphase nuclei were prepared using standard potassium chloride/Carnoy's fixative method. Spectral karyotyping (SKY) and CGH were done for 18 and 17 cell lines, respectively, as described ( 17 ). Fifteen cancer cell lines were analysed for chromosome number using centromeric probes to chromosomes 3, 7, 8, 12, 15, 17 and 18 (Qbiogene, UK and Vysis, UK) in two-colour FISH ( 18 ). Slides were viewed on an Axioplan II fluorescence microscope (Zeiss, UK) and images acquired by SmartCapture 2001 software (Digital Scientific, Cambridge, UK), controlling a Sensys CCD camera (Roper Scientific, Duluth, MN). At least 100 nuclei were scored following image collection.
Ten clones of each of the three cell lines (MT-3, MT-1 and SUM159) were analysed for chromosome number using four centromeric FISH probes, in dual-colour FISH, representing a cross section of chromosomal sub-types (chromosomes 3, 8, 15, 17). FISH signals in at least 100 interphase nuclei were counted for each FISH probe set and each clone. For an analysis of chromosomal structural alterations in the clones and their parental cell lines, six-colour painting probes were labelled by DOP–PCR in a combinatorial system and hybridized as described ( 19 ). Chromosomes were selected for analysis in order to encompass a cross section of subtypes and a mix of frequently translocated ( 5 , 8 and 15 ), less frequently translocated ( 7 ) and infrequently translocated ( 4 , 18 ) chromosomes, based on the SKY data obtained previously ( 17 ). Chromosomes were labelled as follows: chr4 with Spectrum orange (SO; Vysis UK) and biotin, chr5 with digoxigenin (DIG; Roche Biochemicals, UK) and biotin (Roche Biochemicals, UK), chr7 with SO and DIG, chr8 with SO, chr15 with DIG and chr18 with biotin. DIG was detected with a FITC-labelled antibody (Roche Biochemicals, UK), and biotin with a Cy5-labelled antibody (Amersham-Pharmacia, UK). Thirty metaphases were captured and analysed for each parental cell line and each clone using SmartCapture software. Aberrations were considered to be part of the modal karyotype for each clone if they were present in the majority of the 30 metaphases examined. Non-modal chromosomal aberrations were noted and confirmed by returning to the slide and examining the putative aberration at a higher power of magnification. All the aberrations were confirmed by a second observer.
Data analysis
For each cell line, the average ploidy was estimated as the mean of the modal ploidy scores for each chromosome analysed. A comparison of average ploidy between MSS and MSI cell lines was then done using a Mann–Whitney U -test. We also carried out a multivariate analysis to compare the ploidy between MSI and MSS cell lines, while controlling for chromosomes scored and cell type, and allowing for correlation of ploidy scores within each cell line. This analysis was carried out using the generalized linear modeling command implemented in STATA. Other statistical comparisons of MSI and MSS cell lines were done by Mann–Whitney U -test. All the data from experiments using clones were analysed using chi-squared calculations. Differences were considered to be significant with P < 0.05.
Results
Identification of MSI in breast and ovarian cancer cell lines
Mononucleotide and dinucleotide repeat loci were analysed in 33 breast and 25 ovarian cancer cell lines by comparison with colorectal controls to determine MSI status ( Table I , Figure 1 ). Overall, eight breast and ovarian cell lines were unstable at ∼60% of the loci scored. However, OC314, OC315 and OC316 were later found to be the same cell line (below) and so only OC314 has been included in the analysis. A further two breast cancer cell lines, OCUB-F and OCUB-M, and the ovarian line A2780 were unstable at a lower level (17, 43 and 43% of loci tested, respectively). While OCUB-F is not strictly MSI, and was excluded from statistical comparisons below, we have presented the data here to compare it with the cell line OCUB-M, because both cell lines were derived from the same breast cancer patient ( 20 ). We believe these cell lines represent different clones within the original tumour, based on shared complex translocations and MLH1 mutation (see below). Four of the MSI cell lines had mutations in two or more mononucleotide repeats located in the coding sequence of target genes ( Table I , Supplementary Table II). No mutations were found in the 12 MSS cancer cell lines tested.
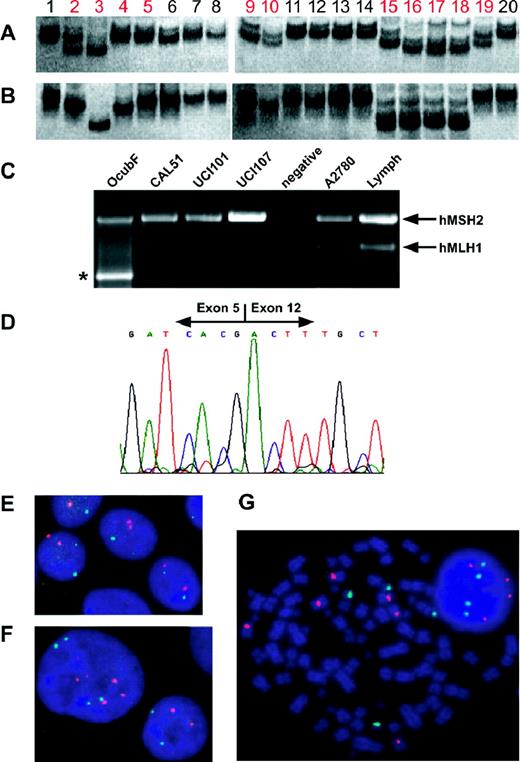
( A and B ) Silver-stained 12% non-denaturing polyacrylamide gel analyses of mononucleotide repeat PCRs. (A) BAT25, (B) BAT26, 1. Lymph, 2. CAL51, 3. MT-3, 4. OCUB-F, 5. OCUB-M, 6. MDA-MB-157, 7. MDA-MB-231, 8. MDA-MB-435s, 9. UCI-101, 10. UCI-107, 11. KEN3, 12. OVKATE, 13. LK1, 14. PAI, 15. OVI-P, 16. OC314, 17. OC315, 18. OC316, 19. A2780, 20. CaCo2. MSI cell lines in red. (C) Multiplex RT–PCR of 3′ region of MSH2 (exons 4–16) and 5′ region of MLH1 (exons 1–12) illustrating the lack of expression of MLH1 in CAL51, UCI-101 and UCI-107, as well as the deletion in OCUB-F (*). ( D ) Sequence of OCUB-F MLH1 RT–PCR product in which the 3′ end of exon 5 adjoins the 5′ end of exon 12, showing the deletion of exons 6–11. ( E , F and G ) Centromeric FISH of chromosomes 8 (red) and 17 (green) counterstained with DAPI (blue). (E) CAL51—MSI diploid, (F) SUM159—MSS diploid with duplicated nucleus shown, (G) OVI-P—MSI aneuploid, variable numbers of chromosome 8 seen.
Characterization of MSI+ cell lines
| Cell line | MSI (mononucleotide) | MSI (dinucleotide, pentanucleotide) a | MMR gene inactivation | Target gene mutation | ||||
|---|---|---|---|---|---|---|---|---|
| Breast | ||||||||
| CAL51 | 4/4 | 2/3 | MLH1 —methylation, loss of expression | 2/9 | ||||
| MT-3 | 4/4 | 2/3 | MLH1 —350C > T, T117M, homozygous | 7/9 | ||||
| OCUB-F b | 1/4 | 0/2 | MLH1 —deletion exons 6–11 | 0/9 | ||||
| OCUB-M b | 2/4 | 1/3 | MLH1 —deletion exons 6–11 | 0/9 | ||||
| Ovarian | ||||||||
| A2780 | 1/4 | 2/3 | MLH1 —methylation, no expression loss | 0/9 | ||||
| OC314 c | 3/3 | 4/5 | MSH2 —494delCTC, heterozygous | 2/9 | ||||
| OVI-P | 4/4 | 3/4 | MLH1 —1513delA, protein truncated at codon 507 | 4/9 | ||||
| UCI-101 | 2/3 | 3/5 | MLH1 —methylation, loss of expression | 0/9 | ||||
| UCI-107 | 2/2 | 3/5 | MLH1 —methylation, loss of expression | 0/9 | ||||
Number of abnormal loci out of those that were scored in agreement by two researchers.
OCUB-F and OCUB-M were from the same patient.
The same instability and mutation were found in OC315 and OC316.
Mutation analysis of MMR genes
Inactivation of either MLH1 or MSH2 , by mutation or loss of expression, was seen in all the MSI cell lines, with the exception of the ovarian cancer cell line A2780 ( Table I ). An identical heterozygous 3 bp deletion in MSH2 ( Table I ), resulting in the loss of a conserved leucine residue, was detected in three ovarian cancer cell lines OC314, OC315 and OC316. Although previously believed to be independent, we have confirmed these cell lines to be genetically near-identical (data not shown). Homozygous mutations in MLH1 were identified in four MSI cell lines: OCUB-F and M, MT-3 and OVI-P ( Table I ). Both OCUB cell lines had a large genomic deletion that was confirmed by RT–PCR and sequencing ( Figure 1 ), but interestingly, OCUB-F had a surprisingly mild MSI phenotype, even with apparently no functional MLH1 (17% of loci, compared with 43% for OCUB-M). The MLH1 mutation in MT-3 (350C>T) was previously observed in an HNPCC kindred ( 21 ), and as a somatic mutation in a colorectal cancer cell line, LS180 ( 22 ). In a recent publication, the classification of MT-3 as MSI was confirmed with the same mutation identified ( 23 ). OVI-P had a 1 bp frameshift deletion at nucleotide position 1513 in exon 13, resulting in the downstream formation of a stop codon (confirmed by protein truncation test). Since normal tissue from the patients from whom these cell lines were derived was not available, it was not possible to determine whether these mutations were sporadic or inherited. MLH1 expression analysis by RT–PCR and methylation-specific PCR identified one breast and two ovarian cancer cell lines (CAL51, UCI-101, UCI-107) with no expression of the MLH1 transcript and full methylation of the promoter. This result was confirmed for CAL51 in a recent publication ( 23 ). The ovarian cancer cell line A2780 also showed hMLH1 promoter methylation, but the gene transcript was still detected by RT–PCR. This apparently puzzling result is probably due to an element of clonal heterogeneity (a minority of cells without promoter methylation that still express hMLH1 ).
Numerical chromosomal aberrations in MSI and MSS
Chromosomes were counted in interphase nuclei using centromere-specific FISH (Supplementary Table III, Table II, Figures 1 and 2). Five of the nine MSI lines examined were diploid or near-diploid, and the remainder were highly aneuploid, including the pair OCUB-F and OCUB-M ( Table II ). Seven randomly selected MSS lines were analysed: two (SUM-159 and LK-1) were in the diploid range while the rest were aneuploid. Average ploidy was not significantly different between MSI and MSS (MSI average ploidy = 2.65, MSS average ploidy = 3.01, P = 0.32, Mann–Whitney U -test). A multivariate analysis of all centromeric FISH data (rather than averaged data) showed that the chromosome number distribution was also not significantly different between MSI and MSS cell lines ( P = 0.63, Figure 2 ). However, MSS cell lines appeared to have a wider distribution of centromeric FISH signals, while the MSI cell lines have almost a bimodal distribution. The variability of chromosome number between cells (indirect evidence for ongoing numerical instability) ranged from 7.2 to 29% ( Table II ) and was significantly higher in MSS cell lines ( P = 0.049).
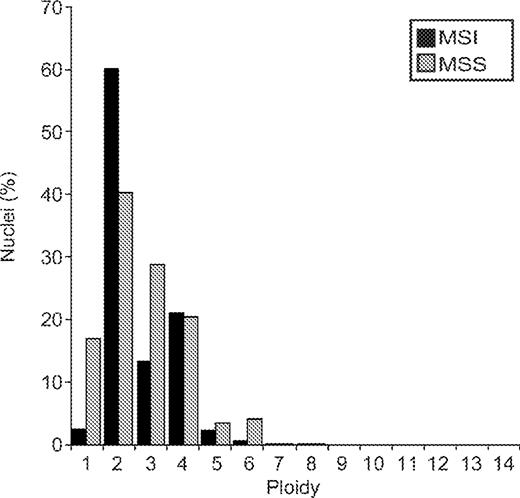
Comparison of ploidy in MSI and MSS cell lines. Ploidy represents the number of copies of a chromosome in a nucleus as detected by FISH. For each cell line, the percentage of nuclei with a given number of signals for a chromosome was averaged over the chromosomes studied. These percentages were then averaged over all cell lines in the MSI group and the MSS group, respectively. For example, in the MSS lines, 4% of nuclei showed 6 signals when averaged over all chromosomes and lines, while for MSI lines, 0.5% showed 6 signals. A multivariate statistical analysis taking into account the number of nuclei, chromosomes and cell lines analysed, found that the two groups were not significantly different ( P = 0.63).
Results of centromeric FISH
| Cell line | MSI status a | Average ploidy | Average variability (%) |
|---|---|---|---|
| Lymphocytes b | − | 2 | 4.8 |
| A2780 | + | 2 | 8.5 |
| CAL51 | + | 2 | 10.3 |
| UCI-101 | + | 2 | 8.2 |
| UCI-107 | + | 2 | 8.4 |
| SUM159 | − | 2 | 16.9 |
| LK-1 | − | 2.125 | 9.1 |
| MT-3 | + | 2.17 | 7.2 |
| MDA-MB-157 | − | 2.83 | 29.0 |
| MDA-MB-468 | − | 3 | 23.8 |
| OC314 c | + | 3 | 19.3 |
| MaTu | − | 3.25 | 18.6 |
| KPL1 | − | 3.5 | 26.1 |
| OCUB-F | + | 3.67 | 16.7 |
| OCUB-M | + | 4 | 20.0 |
| OVI-P | + | 4 | 20.8 |
| MT-1 | − | 4.375 | 20.5 |
| MSI d | 2.65 | 12.8 | |
| MSS | 3.01 e | 20.6 f |
+ MSI; −MSS.
Normal lymphocytes control, excluded from statistical analyses.
The same average ploidy and similar variability were found in OC315 and OC316.
Excluding OCUB-F as from the same patient as OCUB-M.
Structural chromosomal aberrations in MSI and MSS
Data from 18 cell lines obtained by 24-colour FISH (‘SKY’) was used to determine the ‘break index’ (Supplementary Table IV), calculated by summing the minimum number of chromosomal breaks that would be required to generate an observed karyotype ( 24 ). The break index ranged from 0 for CAL51 (a diploid cell line) to 99 for MCF-7 (a complex aneuploid karyotype). The average value of the break index was 47 for MSS cell lines and 21 for MSI cell lines, but this difference was not statistically significant ( P = 0.13), and the number of MSI cell lines was small ( n = 4). The total number of chromosome arm gains or losses was determined by comparative genomic hybridization (CGH). The average number of alterations was 19.5 for MSS cell lines and 8 for MSI cell lines ( P = 0.059).
Analysis of cell line clones
Based on the results above, three cancer cell lines representing different phenotypes were selected for further analysis (Supplementary Table V). MT-3 is a classic example of an MSI cancer, with a near-diploid karyotype and a mutation in the MMR gene MLH1 . SUM159 is also near-diploid, with a small number of translocations, but microsatellite-stable. MT-1 is microsatellite-stable with a hypertetraploid karyotype and multiple translocations. Ten clones were generated for each cell line and allowed to expand for ∼25 generations. By starting from a single cell, chromosomal aberrations seen at the end of the clonal expansion that are different from the mode for that clone (‘novel’ alterations) would have occurred following the cloning event and therefore, represent the actual rate of change. In effect, starting from a single cell ‘resets the clock’. If, over the 25 generations that each clone had been growing in culture the number of novel numerical or structural chromosomal alterations were the same for each cell line (after averaging across all clones), then it is likely that the parental karyotype of that cell line had arisen as a result of selection during the evolution of the tumour. However, if the levels of novel alterations were different among the three cell lines, then one or more may have an intrinsically different rate of chromosomal aberration. We decided against attempting to ‘calculate’ an actual rate, because factors such as cell death during culture or slight changes in growth rate at different points during culture (e.g. after passage) could not be accounted for.
Analysis of numerical changes in cell line clones
We first assessed aneuploidy, i.e. chromosome gains and losses, with centromeric FISH of interphase nuclei for four chromosomes in ten clones of each cell line ( Figure 3 ). Stability was measured by the percentage of cells retaining the modal chromosome number of each clone. When data were averaged over all four chromosomes and 10 clones, MT-3 (MSI, near-diploid) was very stable (94%), and the most common numerical change was the loss of a single chromosome. SUM159 (MSS, near-diploid) was more variable (88%), with 7% of nuclei showing at least duplication of both chromosomes (probably representing a doubling of the entire chromosome complement). MT-1 (MSS, aneuploid) was the most variable (82%) and the main change was chromosome loss. The three cell lines showed very different distributions of gains and losses and this was highly statistically significant ( Figure 3 , P < 0.001). No particular chromosome was preferentially lost or gained across all cell lines.
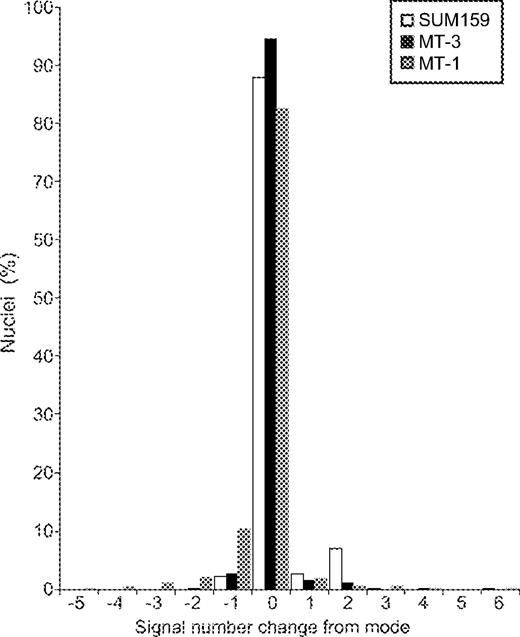
Centromeric FISH of clones, all data. The distribution of signal number is shown in terms of the change from the modal number for each cell line and chromosome. Chi-squared analyses were done by grouping the signal changes from the mode into positive (i.e. gain of signal/s) and negative (i.e. loss of signal/s). Combined and pairwise comparisons were all P < 0.001.
It may be possible that the increase in MT-1 variability was owing to an increased chromosome number increasing the probability of alteration. After compensating for chromosome number (Supplementary Methods 1), the cell lines were still significantly different ( P < 0.001). By chance, one of the MT-3 clones had a modal chromosome number of 92; the clone arose from a cell with a duplicated genome. If the increase in ploidy changes observed in MT-1 was merely a consequence of aneuploidy, this MT-3 clone might also have an increased variability. This clone was only slightly less stable compared with the other MT-3 clones (91.3 and 94.5%, respectively, for the other clones combined).
We then considered gains and losses separately. When pairwise comparisons were made between the cell lines, the aneuploid MT-1 had significantly more losses than the near-diploid lines MT-3 and SUM159, and SUM159 had significantly more gains than both MT-1 and MT-3. After correcting for chromosome number, MT-3 had more gains than MT-1. SUM159 gains were most often a consequence of duplication of the entire chromosome complement (7% both chromosomes duplicated versus 2.5% single chromosome gain). MT-3 showed the gain of a single chromosome equally as often as duplication, whereas MT-1 seldom underwent duplication; the gains seen for this cell line were mostly of a single chromosome.
Analysis of chromosomal structural aberrations in cell line clones
Structural chromosomal aberrations are often found in tumour karyotypes ( 17 ). We analysed the three parental cell lines and each of their ten clones by six-colour FISH to identify non-modal chromosomal alterations. These aberrations were grouped as cytogenetically ‘stable’ (e.g. translocations) or ‘unstable’ (e.g. chromatid breaks, see Supplementary Methods 2). Unstable aberrations are considered to be precursors of stable abnormalities ( 7 ). In the parental cell lines, the non-modal stable alterations observed are likely to represent karyotypic heterogeneity (Supplementary Table V). The number of unstable structural aberrations observed in metaphases of each parental cell line was uniformly low (0–2 in 30 metaphases). The total number of novel alterations (stable and unstable) in the clones ranged from 38 to 55 ( Table III ). MT-3 (MSI, near-diploid) clones were fairly consistent, with 0–6 structural changes in each clone over the 30 metaphases analysed. SUM159 (MSS, near-diploid) clones were more variable, with 1–13 structural changes present in each clone. MT-1 (MSS, aneuploid) clones contained between two and eight structural aberrations.
Summary of six-colour FISH data
| Cell line | SUM159 | MT-1 | MT-3 |
|---|---|---|---|
| Phenotype | MSS, diploid | MSS, aneuploid | MSI, diploid |
| Parental rearrangements (6 chromosomes) | 4 | 16 | 0 |
| Novel stable alterations in clones | 37 | 22 | 19 |
| Range in clones | 1–9 | 0–5 | 0–4 |
| Novel unstable alterations in clones | 18 | 16 | 19 |
| Range in clones | 0–4 | 0–5 | 0–3 |
| Total alterations in clones | 55 | 38 | 38 |
| No. of metaphases examined | 303 | 298 | 298 |
| Metaphases with alterations | 18% | 13% | 13% |
| Approximate number of chromosomes analyzed per metaphase | 13 | 26 | 13 |
| Total chromosomes examined | 3939 | 7748 | 3874 |
| Alterations per chromosome analyzed | 1.40% | 0.49% | 0.98% |
The six-colour FISH results were divided into unstable and stable aberration groups for statistical analysis. Statistical comparisons took into account the amount of genetic material in each cell line (Supplementary Methods 3). Both stable and unstable alterations were significantly different among the three cell lines ( Figure 4A ). SUM159 clearly had significantly more stable chromosomal aberrations when compared with both MT-1 and MT-3. With respect to unstable aberrations, SUM159 and MT-3 were not significantly different, but both had significantly more of these chromosomal aberrations than MT-1. These results suggest that the aneuploid line MT-1 did not have an increased rate of structural chromosomal aberrations despite the observed translocations in the parent line. These data also indicate that although MT-3 and SUM159 had the same rate of unstable chromosomal alterations, SUM159 had acquired more chromosomal aberrations of the stable type.
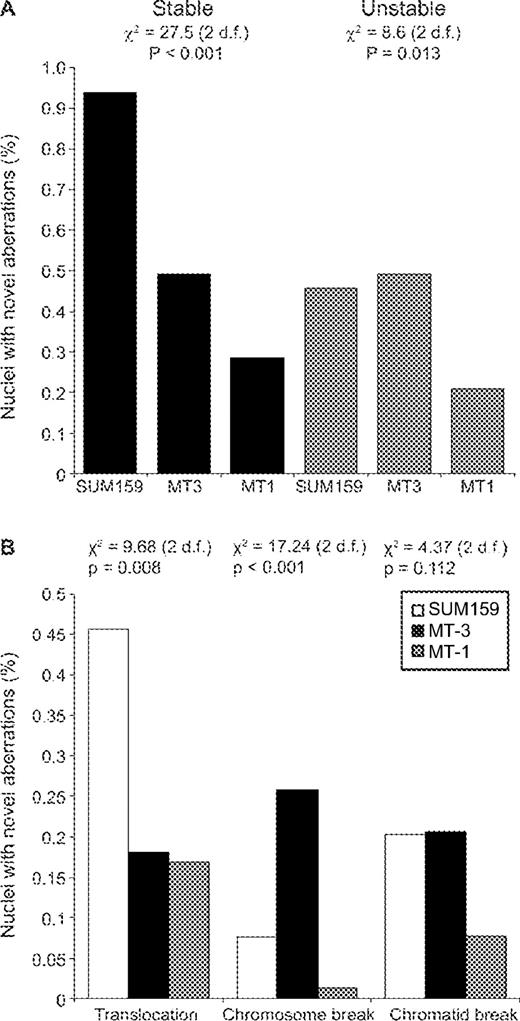
Six-colour FISH data of clones. ( A ) Stable and unstable rearrangements. The statistics for each three-way comparison are shown on the graph. ( B ) Differences in the levels of certain aberrations. The statistics for each three-way comparison are shown on the graph. Pairwise χ 2 analyses gave the following results:
| Stable | Unstable | Translocation | Chromosome break | Chromatid break | |
|---|---|---|---|---|---|
| SUM159 versus MT-3 | P = 0.019 | P = 0.83 | P = 0.031 | P = 0.048 | P = 0.973 |
| SUM159 versus MT-1 | P < 0.001 | P = 0.017 | P = 0.004 | P = 0.083 | P = 0.066 |
| MT-1 versus MT-3 | P = 0.077 | P = 0.008 | P = 0.89 | P < 0.001 | P = 0.061 |
Three other features of the data were also apparent. First, the increase in stable alterations in the near-diploid line SUM159 was mostly attributable to over twice as many new translocations ( Figure 4B ). This increase was statistically significant when compared with the other cell lines ( P = 0.008). Second, the MSI near-diploid line MT-3 had a significantly greater number of chromosomal breaks ( P < 0.001). The levels of chromatid breaks were not significantly different for the three cell lines ( P = 0.112). No chromosomal location in MT-3 was more affected by this than any other, discounting the possible effect of a fragile site. Finally, none of the individual chromosomes were more frequently affected than any other.
Discussion
Data from colorectal cancer initially suggested a model whereby MSI and CIN are alternative and mutually exclusive genetic instability pathways required for tumourigenesis ( 3 ). We first identified breast and ovarian cancer cell lines with MSI and MMR deficiency, then correlated these data with observations of numerical and structural chromosomal aberrations.
We identified MSI in 5 out of 25 (20%) distinct ovarian cancer cell lines, which is comparable to observations of MSI in primary tumours ( 25 , 26 ). We also identified 3 out of 33 (9%) independent breast cancer cell lines with MSI, all three with inactivation of MLH1 and two with mutations in target genes. This was more than expected, given that MSI has been found in 4% of primary breast tumours using stringent criteria ( 27 – 29 ), but whether this is by chance or through a selection in establishing lines does not substantially alter our conclusions.
Numerical chromosomal analysis ( Table II ) showed that MSI and MSS cancer cell lines were not significantly different for ploidy. There were breast and ovarian cancer cell lines that were near-diploid with no MSI (SUM159, LK1) and MSI cell lines that were aneuploid (OCUB-F, OVI-P). An MSI colorectal cancer cell line with both numerical and structural chromosomal changes typical of MSS cell lines has been found ( 30 ). MSS-diploid colorectal cancers have been described ( 31 , 32 ), and may constitute a distinct subgroup with aggressive clinical features ( 31 ). This MSS-diploid tumour phenotype may have been unnoticed initially because it appears to be underrepresented in colorectal cancer cell line studies ( 3 , 24 ), but our results with breast and ovarian cancer cell lines confirm that a subset of human cancers develop without any evidence of either MSI or extensive CIN. These cancers could have a different form of instability such as an increased rate of transversion mutations ( 33 ). Thus, MSI and numerical CIN appear not to be mutually exclusive, and neither may be required in epithelial tumourigenesis.
Our analysis of structural chromosomal abnormalities showed that break indices are not significantly different in MSI and MSS cell lines. This reflects the complex karyotypes of MSI cell lines such as OCUB-F and the presence of several cell lines with fairly simple karyotypes in the MSS group (SUM159, MDA-MB-134). A significant difference in both numerical and structural chromosomal changes between the MSI and MSS colorectal cancer cell lines has been found ( 24 ), contrasting with our findings. This illustrates a major difference in the chromosomal phenotypes between the colorectal and breast/ovarian cancer cell lines, in that, colorectal cancers tend to have fewer complex translocations relative to the chromosome modal number. For example, the MSS breast cancer cell line VP267 had a modal number of 59 and a break index of 98, whereas Vaco576, the most complex karyotype found in a study of colorectal cancer cell lines ( 24 ), had a similar modal number and a break index of only 29. The average break index for colon cancer lines was 11.28 ( 24 ), while it was 42.8 ( P < 0.05) for the breast cancer lines studied here. Although we were unable to karyotype sufficient ovarian cancer cell lines to make a comparison, a published SKY analysis of 4 ovarian tumours and 7 cell lines found the average number of breakpoints to be 49.8 ( 34 ).
Chromosomal aberrations observed in cancer cell lines may accumulate through a process driven primarily by either genetic instability or selection. Genetic instability denotes a mutation rate elevated above that seen in normal cells. Tumour development driven by selection implies that only chromosomal aberrations that provided a cell survival or division advantage, enabling clonal outgrowth, will be present in the tumour. Selection will act on chromosomal aberrations that have arisen both spontaneously and as a consequence of inherent genetic instability. If accumulation of chromosomal aberrations in tumour development is predominantly driven by genetic instability, then cell lines with complex karyotypes should show an inherently elevated rate of chromosomal aberrations. Conversely, if there is little difference in this rate between cell lines, accumulation of chromosomal aberrations could be driven mostly, but not necessarily exclusively, by selection.
Aneuploid cell lines have been found to show increased rates of numerical chromosomal change ( 3 ). Our centromeric FISH data of the clones found that the three cell lines did have different patterns of ploidy change, and that the most variable cell line, MT-1, was also the aneuploid line. The level of variability was somewhat lower than that observed in aneuploid colorectal cancer cell lines, with MT-1 having no more than 24% variability for any chromosome. This is, however, consistent with a report using some of the same colorectal cancer cell lines as Lengauer et al . ( 3 ) that found technical reasons for large increases in signal variability ( 35 ).
We found that while the level of novel chromosomal structural alterations did differ between the cell line clones, it did not correlate with the complexity of the parental cell line karyotype. In addition, the data indicate that the rate of numerical and structural aberrations can vary independently. The MSS cell line SUM159 had the highest number of novel structural alterations, but the anaplastic carcinoma from which this cell line was derived had an uncomplicated near-diploid karyotype. MT-1, the cell line with the most complex karyotype, had no more novel structural alterations than the simple diploid MSI cell line MT-3. Similarly, in colorectal tumours of differing karyotypes, there was no increase in the level of unstable chromosomal structural aberrations ( 7 ). Hence, it appears that selection is likely to be critical for the accumulation of structural chromosomal alterations regardless of the level of an underlying genetic instability. Indeed, mathematical modelling has predicted that even with persistent CIN, cell lines in steady-state non-selective culture conditions will evolve little, given a growth penalty associated with novel aberrations ( 35 ). Thus, if selection is so important, it is perhaps not unexpected that the range of genetic instability phenotypes in breast and ovarian cancer are different from those observed in colorectal cancer, given the different cellular and tissue contexts in which these cancers develop.
The data for both numerical and structural analyses presented here do not suggest dramatic differences between the cell lines for the rates of chromosome gain or loss, or structural aberration formation. This is in contrast to the 100-fold increase in mutation rate found in MMR-deficient cells. MAD2 +/− HCT116 cell clones expressing 70% of the normal MAD2 protein level showed an increased interphase centromeric FISH signal variability from 2.8 to 9.9% ( 36 ). This increased level is comparable to the increased numerical variability identified in the analyses of MT-1 clones (18%) compared with MT-3 (6%). A minor change in the protein level may therefore be sufficient to subtly decrease the numerical chromosomal stability. A proportion of Mad2 +/− mice (28%) develop lung tumours late in life (18 months). This contrasts with the MMR-deficient mice, which develop tumours at an early age (average lifespan of 5–6 months). Thus, a restrained increase in chromosomal instability may be sufficient to assist in the accumulation of the mutations and aneuploidy that are required for tumour development, if selection is considered as well. Indeed, a mutation conferring undue levels of chromosomal instability by a cell would be most likely to bestow an immediate selective disadvantage.
In summary, we have shown that MSI, numerical CIN and structural CIN are independent and not mutually exclusive genetic instability pathways in the breast and ovarian cancer cell lines. Aneuploid cell lines appear to have a low level of numerical CIN; however, we suggest that selection may be more important than genetic instability in driving the accumulation of structural chromosomal aberrations.
Supplementary material
Supplementary material is available online at http://www.carcin.oupjournals.org/
Research in the Caldas and Edwards laboratories was supported by Cancer Research UK. Thanks to S. Batley for technical assistance. KLG was supported by Cambridge Commonwealth Trust Prince of Wales Scholarship and a Sackler studentship.
References
Loeb,L.A. (
Bhattacharyya,N., Skandalis,A., Ganesh,A., Groden,J. and Meuth,M. (
Lengauer,C., Kinzler,K. and Vogelstein,B. (
Muleris,M., Dutrillaux,A., Olschwang,S., Salmon,R. and Dutrillaux,B. (
Cahill,D.P., Lengauer,C., Yu,J., Riggins,G.J., Willson,J.K., Markowitz,S.D., Kinzler,K.W. and Vogelstein,B. (
Tomlinson,I., Novelli,M.R. and Bodmer,W. (
Muleris,M. and Dutrillaux,B. (
Ribas,M., Masramon,L., Aiza,G., Capella,G., Miro,R. and Peinado,M. (
Zhou,X., Hoang,J.-M., Cottu,P., Thomas,G. and Hamlein,R. (
Hoang,J., Cottu,P., Thuille,B., Salmon,R., Thomas,G. and Hamelin,R. (
Oda,S., Oki,E., Maehara,Y. and Sugimachi,K. (
Thibodeau,S., French,A., Cunningham,J., Tester,D., Burgart,L., Roche,P., McDonnell,S., Schaid,D., Vockley,C.W., Michels,V.V., Farr,G.H.,Jr and O'Connell,M. (
Boland,C.R., Thibodeau,S.N., Hamilton,S.R., Sidransky,D., Eshleman,J.R., Burt,R.W., Meltzer,S.J., Rodriguez-Bigas,M.A., Fodde,R., Ranzani,G.N. and Srivastava,S. (
Yamamoto,H., Sawai,H. and Preucho,M. (
Friedman,L., Gayther,S.A., Kurosaki,T., Gordon,D., Noble,B., Casey,G., Ponder,B.A. and Anton-Culver,H. (
Herman,J., Umar,A., Polyak,K., Graff,J., Ahuja,N., Issa,J., Markowitz,S., Willson,J., Hamilton,S., Kinzler,K., Kane,M., Kolodner,R., Vogelstein,B., Kunkel,T. and Baylin,S. (
Davidson,J.M., Gorringe,K.L., Chin,S.F., Orsetti,B., Besret,C., Courtay-Cahen,C., Roberts,I., Theillet,C., Caldas,C. and Edwards,P.A. (
Daigo,Y., Chin,S.F., Gorringe,K.L., Bobrow,L.G., Ponder,B.A., Pharoah,P.D. and Caldas,C. (
Roberts,I., Wienberg,J., Nacheva,E., Grace,C., Griffin,D. and Coleman,N. (
Sawada,T., Chung,Y.S., Nakata,B., Kubo,T., Kondo,Y., Sogabe,T., Onoda,N., Ogawa,Y., Yamada,N. and Sowa,M. (
Maliaka,Y.K., Chudina,A.P., Belev,N.F., Alday,P., Bochkov,N.P. and Buerstedde,J.M. (
Wheeler,J.M., Beck,N.E., Kim,H.C., Tomlinson,I.P., Mortensen,N.J. and Bodmer,W.F. (
Seitz,S., Wassmuth,P., Plaschke,J., Schackert,H.K., Karsten,U., Santibanez-Koref,M.F., Schlag,P.M. and Scherneck,S. (
Eshleman,J.R., Casey,G., Kochera,M.E., Sedwick,W.D., Swinler,S.E., Veigl,M.L., Willson,J.K., Schwartz,S. and Markowitz,S.D. (
Fujita,M., Enomoto,T., Yoshino,K., Nomura,T., Buzard,G.S., Inoue,M. and Okudaira,Y. (
King,B.L., Carcangiu,M.L., Carter,D., Kiechle,M., Pfisterer,J., Pfleiderer,A. and Kacinski,B.M. (
Lininger,R.A., Fujii,H., Man,Y.G., Gabrielson,E. and Tavassoli,F.A. (
Toyama,T., Iwase,H., Yamashita,H., Iwata,H., Yamashita,T., Ito,K., Hara,Y., Suchi,M., Kato,T., Nakamura,T. and Kobayashi,S. (
Walsh,T., Chappell,S.A., Shaw,J.A. and Walker,R.A. (
Abdel-Rahman,W.M., Katsura,K., Rens,W., Gorman,P.A., Sheer,D., Bicknell,D., Bodmer,W.F., Arends,M.J., Wyllie,A.H. and Edwards,P.A. (
Georgiades,I., Curtis,L., Morris,R., Bird,C. and Wyllie,A. (
Hawkins,N.J., Tomlinson,I., Meagher,A. and Ward,R.L. (
Eshleman,J., Donover,P., Littman,S., Swinler,S., Li,G., Lutterbaugh,J., Wilson,J., Modrich,P., Sedwick,W., Markowitz,S. and Veigl,M. (
Rao,P.H., Harris,C.P., Yan Lu,X., Li,X.N., Mok,S.C. and Lau,C.C. (
Roschke,A.V., Stover,K., Tonon,G., Schaffer,A.A. and Kirsch,I.R. (
Author notes
Cancer Genomics Program, 1Departments of Oncology and 2Pathology, Hutchison/MRC Research Centre, University of Cambridge, Cambridge CB2 2XZ, UK and 3Cancer Research UK Human Cancer Genetics Research Group, Strangeways Research Laboratories, Worts Causeway, Cambridge, UK
Present addresses: 4Comparative Genomics Centre, James Cook University, Townsville, QLD 4811, Australia, 5Cambridge Cytogenetics Laboratory, Addenbrooke's NHS Trust, Kefford House, Cambridge CB2 2FF, UK and 6IPATIMUP, Rua Dr Roberto Frias, s/n 4200-465 Porto, Portugal
