


Abstract
Myocardial fibrosis is an important contributor to heterogeneity of left ventricular (LV) dysfunction in the metabolic syndrome (MS). Comparison of strain with calibrated integrated backscatter (cIB) and serological fibrosis markers could provide a means to understand the association of cardiac function with markers of fibrosis.
We studied 172 patients with MS (age 50 ± 13years) and 61 healthy controls in a prospective, cross-sectional study. Echocardiographic evaluation included myocardial velocities and deformation, and calibrated cIB. Procollagen type III amino-terminal propeptide (PIIINP) and procollagen type I carboxy-terminal propeptide (PICP) were measured from serum. MS patients demonstrated LV systolic and diastolic function, and myocardial echodensity disturbances, as well as elevated serum PIIINP and PICP levels. For most functional variables, calibrated cIB in the basal septum was the strongest determinant of impaired LV performance, independent of higher procollagen levels, LV mass index, age, body mass index, creatinine level, and C-reactive protein. Patients with increased abdominal fat deposit (assessed by the waist-to-hip ratio) presented higher levels of procollagen peptides and septal calibrated cIB, and with more profound LV dysfunction as indicated by lower myocardial deformation and early diastolic velocity, and higher E/e′.
Myocardial echodensity is a stronger correlate of LV systolic and diastolic dysfunction in MS, than circulating procollagen peptides. Both fibrosis and LV function abnormalities are increased at a higher waist-to-hip ratio, which might provide a rationale for the implementation of intensified therapy in this subset of patients.
Introduction
The metabolic syndrome (MS) is a cluster of cardiovascular risk factors, including lipid disturbances, hypertension, hyperglycaemia, and abdominal obesity, that is reaching epidemic proportions.1 Myocardial involvement in MS comprises both functional and structural alterations, including left ventricular (LV) hypertrophy, and systolic and diastolic dysfunction; the major adverse outcome following initially subclinical abnormality is congestive heart failure.2–6 Myocardial fibrosis, promoted by upregulation of the renin–angiotensin–aldosterone system, may be a potent contributor to the impairment of LV systolic and diastolic function.7–9 Evaluation of prophylactic and therapeutic measures to target fibrosis would permit identification of patients suitable for more aggressive management.
Non-invasive determination of myocardial fibrosis may be extremely relevant for screening and monitoring patients with cardiac dysfunction. Procollagen type I carboxy-terminal propeptide (PICP) and procollagen type III amino-terminal propeptide (PIIINP) might serve as surrogate serological markers of fibrotic processes, reflecting the intensity of collagen synthesis in the myocardium,10–13 but these are not widely available. Ultrasonic tissue characterization by calibrated integrated backscatter (cIB) has been validated to be related to the myocardial collagen content measure by a morphometric method,14–18 and has the attraction of much greater availability than contrast magnetic resonance imaging. The examination of calibrated cIB is a technique that has been available for three decades. Initially its application was limited by the need for specific acquisition protocols and the memory requirements of saving in raw data format. Neither of these requirements is a barrier with modern echo machines. In this study, we investigated the interrelations of tissue reflectivity parameters with cardiac performance and circulating procollagen peptides in MS, to attest the role of enhanced fibrosis in LV dysfunction and to identify patients who might benefit from anti-fibrotic treatments.
Methods
Patient selection
We prospectively recruited 172 patients with cardiovascular risk factors (hypertension, diabetes mellitus, and obesity) satisfying the criteria of MS, who were referred from general practice, and ambulatory and specialist clinics. The control group encompassed 61 age-matched healthy volunteers recruited from the community. The diagnosis of MS was established as recommended by the amended National Cholesterol Education Program's Adult Treatment Panel III (ATP-III) guidelines in patients meeting three or more than three of the following criteria: (i) increased waist circumference (>102 cm in men or >88 cm in women); (ii) increased fasting triglycerides (>1.7 mmol/L) or drug treatment for elevated triglycerides; (iii) high blood pressure (≥130/≥85 mmHg) or anti-hypertensive therapy; (iv) decreased HDL-cholesterol (<0.45 mmol/L in men or <0.56 mmol/L in women) or drug treatment for reduced HDL-cholesterol; (v) impaired fasting glucose (≥5.6 mmol/L) or drug treatment for elevated glucose.19 All study participants were subjected to a medical evaluation including clinical history, physical examination, routine blood analysis, lipid profile, electrocardiography, and echocardiography. Coronary artery disease was excluded on the basis of a negative history and normal stress electrocardiogram or echocardiogram. Other exclusion criteria were moderate and severe valvular heart diseases, absence of stable sinus rhythm, adrenocortical and connective tissue disorders, and pulmonary, hepatic, rheumatic, neoplastic, skeletal, thyroid, and renal diseases (including renal insufficiency with serum creatinine >220 μmol/L (2.5 mg/dL).
Pharmacological treatment in MS patients consisted of angiotensin converting enzyme inhibitors in 65%, angiotensin receptor blockers in 10%, beta-blockers in 34%, calcium channel antagonists in 27%, diuretics in 44%, statins in 49%, fibrates in 7%, biguanides in 29%, and sulphonylureas in 25% of patients. Other characteristics of the patient population are presented in Table 1.
Demographic and laboratory characteristics of the study group
| MS (n= 172) | Controls (n= 61) | P-value | |
|---|---|---|---|
| Clinical features | |||
| Age (years) | 50.3 ± 13.2 | 48.7 ± 11.6 | NS |
| Male [n (%)] | 81 (47) | 26 (43) | NS |
| BMI (kg/m2) | 35.4 ± 9.0 | 22.9 ± 2.4 | 0.001 |
| Waist circumference (cm) | 106 ± 18 | 76 ± 6 | 0.001 |
| Waist-to-hip ratio | 0.93 ± 0.12 | 0.80 ± 0.04 | 0.005 |
| Systolic blood pressure (mmHg) | 137 ± 15 | 122 ± 14 | 0.001 |
| Diastolic blood pressure (mmHg) | 79 ± 10 | 74 ± 10 | 0.03 |
| Laboratory findings | |||
| Fasting insulin (mIU/L) | 14.3 ± 12.9 | 3.9 ± 1.4 | 0.006 |
| Fasting glucose (mmol/L) | 6.4 ± 1.6 | 5.1 ± 0.9 | 0.02 |
| HOMA IR | 4.6 ± 4.6 | 1.0 ± 0.4 | 0.008 |
| Creatinine (mg/dL) | 0.93 ± 0.21 | 0.81 ± 0.08 | 0.08 |
| Uric acid (mg/dL) | 6.5 ± 1.6 | 4.9 ± 0.3 | 0.04 |
| Total cholesterol (mg/dL) | 200 ± 39 | 205 ± 31 | NS |
| Low-density lipoprotein (mg/dL) | 121 ± 34 | 125 ± 27 | NS |
| High-density lipoprotein (mg/dL) | 49 ± 13 | 69 ± 14 | 0.001 |
| Triglycerides (mg/dL) | 150 ± 66 | 110 ± 40 | 0.008 |
| C-reactive protein (mg/L) | 3.3 ± 2.8 | 2.1 ± 0.4 | 0.005 |
| PIIINP (μg/L) | 5.54 ± 1.96 | 4.55 ± 1.30 | 0.004 |
| PICP (μg/L) | 146 ± 38 | 124 ± 43 | 0.005 |
| TGF-β1 (μg/mL) | 32.8 ± 7.1 | 29.1 ± 8.8 | 0.04 |
BMI, body mass index; HOMA IR, homoeostasis model assessment of insulin resistance; PICP, procollagen type I carboxy-terminal propeptide; PIIINP, procollagen type III amino-terminal propeptide; TGF-β1, transforming growth factor-β1.
All participants were informed of the purpose of the study and provided written informed consent. Investigations were in accordance with the Declaration of Helsinki and were approved by the institutional ethics committee.
Echocardiography
Echocardiographic examination was performed using Vivid 7 and System Five machines (GE, Vingmed Ultrasound, Horten, Norway) equipped with phased-array 2.5-MHz multi-frequency transducers.
Conventional echocardiography
Measurements of cardiac dimensions and wall thicknesses were carried out according to standard recommendations.20 LV mass was calculated using the Devereux-modified American Society of Echocardiography-cube formula and indexed for height to the power of 2.7 to achieve the LV mass index.21 LV ejection fraction was estimated from a modified Simpson's biplane method.
Pulsed-wave Doppler recordings of the LV inflow were acquired from the apical four-chamber view with the sample volume placed between the tips of the mitral leaflets. Peak early and late diastolic flow velocities, the ratio of peak early and late diastolic flow velocities and deceleration time of early diastolic flow wave were evaluated. Isovolumic relaxation time, defined as an interval between the end of aortic outflow and the onset of mitral inflow, was measured in the apical five-chamber view using continuous wave Doppler with a beam placed in the intermediate position for simultaneous visualization of mitral and aortic tracings.
Tissue Doppler imaging
Real-time colour Doppler myocardial imaging data were obtained in the three apical views to assess LV longitudinal function. The image sector angle and the optimal depth of imaging were adjusted to achieve the maximal frame rate >180 frames/s. Pulse repetition frequency was set at the lowest value without aliasing. The ultrasonic beam was aligned with the myocardial segment of interest to give an insonation angle <20°. The sampling window was located in the centre of each segment and tracked manually to keep a fixed mid-myocardial position throughout the cardiac cycle. Digital data were saved in a cine-loop format and transferred to a dedicated workstation (GE, Echopac, Horten, Norway) for subsequent off-line analysis.
Myocardial velocities
Regional myocardial velocity curves were derived from colour Doppler data acquired in the basal segment of the interventricular septum to assess peak systolic velocity and peak early diastolic velocity. Pulsed-wave tissue Doppler recordings of the septal and lateral portion of annulus were used for the assessment of peak early diastolic mitral annular velocity (e′). The ratio of mitral inflow early diastolic velocity to the average e′ velocity obtained from the septal and lateral sides of the mitral annulus (E/e′) was computed for the approximation of the LV filling pressure.22
Myocardial deformation
LV myocardial deformation curves were obtained from the apical, mid, and basal segments of each LV wall. The strain rate was estimated by measuring the spatial velocity gradient over a computation length of 12 mm. Subsequently, strain rate profiles were integrated over time to achieve the strain curves using end-diastole, defined by the R-peak of the ECG. Parameters assessed from myocardial deformation curves were: peak strain, defined as the greatest negative value on the strain curve, and peak systolic strain rate. The post-systolic strain index representing the relative amount of segmental shortening occurring after end-systole was calculated as the difference between the greatest negative strain value after aortic valve closure and the greatest negative strain value, divided by the greatest negative strain value between end-diastole and end-systole.
Calibrated integrated backscatter
Integrated backscatter curves were acquired in the parasternal long-axis view by locating a 4 × 4 mm sample volume in the basal septum, posterior wall, and pericardium in end-diastole. Calibrated IB was calculated by subtracting average pericardial IB intensity from average myocardial IB intensity of the septum and posterior wall. The sample volume was tracked manually to maintain the same region throughout the heart cycle.
All strain, strain rate, myocardial velocity, and IB profiles were averaged over three consecutive cardiac cycles. The results for strain and strain rate were presented as the average values from all segments analysed.
Blood assays
Peripheral venous blood samples were drawn between 8:00 and 9:00 h in the morning after 30 min of rest in the supine position. Serum PICP levels were measured using ELISA kits from Takara Bio, Inc. (Shiga, Japan). Intra- and inter-assay coefficients of variation were 4.9 and 5.5%, respectively. Serum PIIINP levels were assessed with radioimmunoassay using commercially available kits manufactured by Orion Diagnostica (Espoo, Finland). Intra- and inter-assay coefficients of variation were 3.9 and 5.3%, respectively. Serum transforming growth factor-beta (TGF-β1) levels were quantified by ELISA kits produced by R&D Systems, Inc. (Minneapolis, USA). Intra- and inter-assay coefficients of variation were 2.7 and 7.0%, respectively. Serum glucose was evaluated by enzymatic assay (Dade Behring, Inc., Newark, Delware). Serum insulin was determined using a chemiluminescent enzyme immunoassay (Immulite 2000, Diagnostic Products Corp., Los Angeles, CA). The homoeostasis model assessment (HOMA IR), an index of insulin resistance, was calculated as the product of fasting insulin multiplied by fasting glucose divided by 22.5.
Statistical analysis
Data are presented as mean ± SD; skewed variables were log-transformed. Inter-group comparisons were performed by an unpaired two-sided Student's t-test or, when more than two groups were included, by one-way ANOVA with Scheffe's post hoc test for continuous variables and by χ2 for categorical variables. Homogeneity of variances was evaluated by the Levene test. Associations between variables were studied with the use of the Pearson correlation coefficient and stepwise multiple regression analysis. All calculations were performed with standard statistical software (Statistica for Windows 8, StatSoft, Inc., Tulsa, OK). The level of statistical significance was set at P-value <0.05.
Results
Clinical characteristics
As expected, patients with MS demonstrated increased body fat deposition (as evidenced by higher body mass index, waist circumference, and waist-to-hip ratio), higher blood pressure, impaired metabolic control (increased fasting glucose, fasting insulin, and HOMA-IR), plasma lipid disturbances (lower HDL-cholesterol and higher triglycerides), increased pro-inflammatory activation (higher C-reactive protein), and higher uric acid compared with healthy subjects (Table 1).
Cardiac morphology and function
Patients with MS showed significantly greater LV end-diastolic dimension, interventricular septal thickness, LV posterior wall thickness, LV mass index, and left atrial dimension than healthy controls (Table 2). Decreased peak early diastolic myocardial velocity and the ratio of peak early and late diastolic flow velocities, as well as increased E/e′ ratio and prolonged isovolumic relaxation time in patients with MS were indicative of LV diastolic abnormalities (Table 2). LV longitudinal systolic function impairment in the MS group was evidenced by reduced myocardial deformation indices—strain and peak systolic strain rate, and decreased peak systolic myocardial velocity. LV ejection fraction did not differ significantly between MS group and the controls (Table 2).
Echocardiographic characteristics of the study group
| MS (n= 172) | Controls (n= 61) | P-value | |
|---|---|---|---|
| LV end-diastolic dimension (mm) | 50.0 ± 4.7 | 46.2 ± 4.1 | 0.001 |
| IVS (mm) | 11.8 ± 2.2 | 9.2 ± 2.2 | 0.001 |
| PW (mm) | 10.2 ± 1.6 | 8.5 ± 1.3 | 0.001 |
| LV mass index (g/m)2,7 | 52.3 ± 14.2 | 34.8 ± 8.2 | 0.001 |
| Left atrial dimension (mm) | 43.4 ± 3.8 | 36.0 ± 2.7 | 0.001 |
| LV ejection fraction (%) | 67.2 ± 4.2 | 67.6 ± 4.0 | NS |
| E/A | 1.17 ± 0.42 | 1.38 ± 0.44 | 0.02 |
| DT (ms) | 238 ± 43 | 217 ± 24 | NS |
| IVRT (ms) | 105 ± 22 | 86 ± 19 | 0.001 |
| E/e′ | 10.9 ± 3.3 | 8.1 ± 2.4 | 0.007 |
| Sm (cm/s) | 5.1 ± 1.5 | 6.8 ± 1.4 | 0.001 |
| Em (cm/s) | 6.0 ± 1.9 | 9.4 ± 2.5 | 0.001 |
| Strain (%) | 19.3 ± 3.3 | 22.3 ± 3.6 | 0.001 |
| SR (1/s) | 1.48 ± 0.27 | 1.64 ± 0.18 | 0.001 |
| PSSI | 0.05 ± 0.04 | 0.03 ± 0.04 | NS |
| IB sept (dB) | −14.4 ± 5.2 | −21.8 ± 5.8 | 0.001 |
| IB post (dB) | −24.2 ± 5.4 | −25.3 ± 5.8 | NS |
DT, deceleration time of early diastolic flow wave; E/A, ratio of peak early and late diastolic flow velocities, E/e′, the ratio of peak early mitral inflow velocity and peak early diastolic mitral annular velocity; Em, peak early diastolic myocardial velocity; IB sept, calibrated integrated backscatter in the basal septum; IB post, calibrated integrated backscatter in the basal posterior wall; IVRT, isovolumic relaxation time; IVS, interventricular septal thickness; LV, left ventricular; PSSI, post-systolic strain index; PW, LV posterior wall thickness; Sm, peak systolic myocardial velocity; SR, peak systolic strain rate.
Changes in acoustic properties reflecting increased myocardial tissue density in MS patients were identified by significantly higher calibrated IB in the basal septum (Table 2).
Biochemical markers
Parameters associated with fibrosis intensity—PICP, PIIINP, and TGF-β1were significantly higher in the MS group (Table 1). To evaluate the effect of echodensity from the fibrotic processes to myocardial function, the studied population was divided into three groups of fibrosis severity depending on the levels of procollagen peptides: ‘low’, patients in the first tertile of PICP and PIIINP (n = 33); ‘high’, patients in the third tertile of PICP and PIIINP (n = 26); ‘intermediate’, the remainder (n = 113).
LV deformation parameters and myocardial velocities were significantly lower, and E/e′ ratio and cIB in the basal septum significantly higher in the group with the largest degree of fibrosis when compared with the other two groups. Significant differences between the ‘low’ and ‘intermediate’ fibrosis groups were seen only with respect to the E/e′ ratio (higher values in patients with ‘intermediate’ fibrosis, Figure 1).
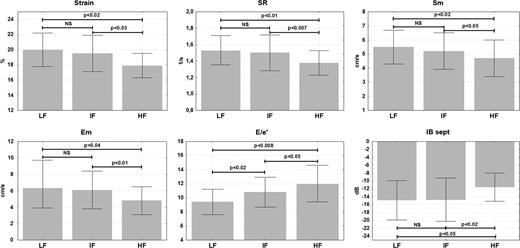
Left ventricular function and myocardial reflectivity in patients with the metabolic syndrome in relation to intensity of fibrotic processes. LF, ‘low’ fibrosis degree; IF, ‘intermediate’ fibrosis degree; HF, ‘high’ fibrosis degree. E/e′, the ratio of peak early mitral inflow velocity and peak early diastolic mitral annular velocity; Em, peak early diastolic myocardial velocity; IB sept, calibrated integrated backscatter in the basal septum; Sm, peak systolic myocardial velocity; SR, peak systolic strain rate.
Regional myocardial function
Strain, strain rate, and peak systolic and early diastolic myocardial velocities in the basal septal segment progressively decreased with the advancement of collagen metabolism, i.e. from the ‘low’ fibrosis to the ‘high’ fibrosis group. In the basal lateral segment, significant exacerbation of myocardial dysfunction evidenced by the above parameters was noted only in patients with the most intense fibrosis (Figure 2).
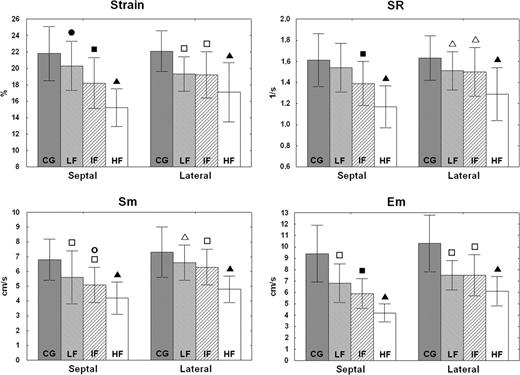
Left ventricular systolic and diastolic function in the basal septum and lateral wall according to fibrosis intensity. CG, control group; LF, ‘low’ fibrosis degree; IF, ‘intermediate’ fibrosis degree; HF, ‘high’ fibrosis degree. Em, peak early diastolic myocardial velocity; Sm, peak systolic myocardial velocity; SR, peak systolic strain rate. Filled triangle, P < 0.001 vs. CG, LF and IF; open triangle, P < 0.01 vs. CG; open square, P < 0.001 vs. CG; filled square, P < 0.001 vs. CG and LF; filled circle, P < 0.05 vs. CG; open circle, P < 0.01 vs. LF.
Relationship of fibrosis to cardiac function
Significant univariate correlations of LV function and structure variables with potential markers of fibrosis—cIB, procollagen peptides, and TGF-β \xEF\x80are presented in Table 3. The strongest univariate correlation was with cIB. The correlations between cIB in the basal septum and LV function parameters were small in the ‘low’ fibrosis group (r = −0.07, P = NS for strain, r = −0.08, P = NS for strain rate, and r = −0.03, P = NS for peak early diastolic velocity), modest in the ‘intermediate’ fibrosis group (r = −0.28, P < 0.003 for strain, r = −0.25, P < 0.009 for strain rate, and r = −0.18, P < 0.05 for peak early diastolic velocity); and greatest in the ‘high’ fibrosis group (r = −0.72, P < 0.001 both for strain and strain rate, and r = −0.73, P < 0.001 for peak early diastolic velocity). Stepwise multiple regression models were developed to identify independent associations between LV systolic and diastolic function. This analysis demonstrated that cIB in the basal septum was a determinant of LV performance, independent of higher procollagen levels, LV mass index, age, body mass index, creatinine level, and C-reactive protein. For most variables, cIB was the strongest independent correlate of LV dysfunction (Table 4).
Significant univariate correlations of left ventricular function with left ventricular structure and procollagen peptides in patients with the metabolic syndrome
| IB sept | TGF-β1 | PICP | PIIINP | |
|---|---|---|---|---|
| Strain | r = −0.51, P < 0.001 | r = −0.18, P < 0.02 | r = −0.30, P < 0.001 | |
| SR | r = −0.51, P < 0.001 | r = −0.17, P < 0.03 | r = −0.28, P < 0.001 | |
| Sm | r = −0.27, P < 0.001 | r = −0.27, P < 0.001 | ||
| Em | r = −0.41, P < 0.001 | r = −0.20, P < 0.008 | ||
| E/e′ | r = 0.35, P < 0.001 | |||
| PICP | r = 0.54, P < 0.001 | |||
| PIIINP | r = 0.27, P < 0.001 | r = 0.34, P < 0.001 |
E/e′, the ratio of peak early mitral inflow velocity and peak early diastolic mitral annular velocity; Em, peak early diastolic myocardial velocity; IB sept, calibrated integrated backscatter in the basal septum; LVMI, left ventricular mass index; PICP, procollagen type I carboxy-terminal propeptide; PIIINP, procollagen type III amino-terminal propeptide; Sm, peak systolic myocardial velocity; SR, peak systolic strain rate; TGF-β1, transforming growth factor-β1.
Independent determinants of left ventricular function in patients with the metabolic syndrome
| β | P-value | |
|---|---|---|
| Strain (R2= 0.39) | ||
| IB sept | −0.41 | 0.0001 |
| LVMI | −0.25 | 0.005 |
| Age | −0.22 | 0.02 |
| PIIINP | −0.19 | 0.04 |
| SR (R2= 0.31) | ||
| IB sept | −0.40 | 0.0001 |
| PIIINP | −0.18 | 0.05 |
| Age | −0.18 | 0.05 |
| E/e′ (R2= 0.46) | ||
| Creatinine | 0.35 | 0.001 |
| C-reactive protein | 0.30 | 0.002 |
| Age | 0.30 | 0.002 |
| PIIINP | 0.24 | 0.01 |
| BMI | 0.21 | 0.04 |
| Em (R2= 0.39) | ||
| LVMI | −0.36 | 0.0001 |
| IB sept | −0.34 | 0.0001 |
| Age | −0.27 | 0.004 |
| PICP | −0.20 | 0.02 |
BMI, body mass index; E/e′, the ratio of peak early mitral inflow velocity and peak early diastolic mitral annular velocity; Em, peak early diastolic myocardial velocity; IB sept, calibrated integrated backscatter in the basal septum; LVMI, left ventricular mass index; PICP, procollagen type I carboxy-terminal propeptide; PIIINP, procollagen type III amino-terminal propeptide; SR, peak systolic strain rate.
To seek for a biological support for the demonstrated associations between the markers of fibrosis and LV function, the studied MS population was divided according to the sex-specific waist-to-hip ratio tertiles. Patients with larger visceral fat deposit (as assessed by the waist-to-hip ratio) presented higher levels of PIIINP and PICP, higher cIB in the basal septum, and more profound LV function impairment as indicated by lower peak systolic myocardial velocity and peak early diastolic myocardial velocity, and higher E/e′ (Figure 3A and B). No changes across the waist-to-hip tertiles were found for TGF-β1.
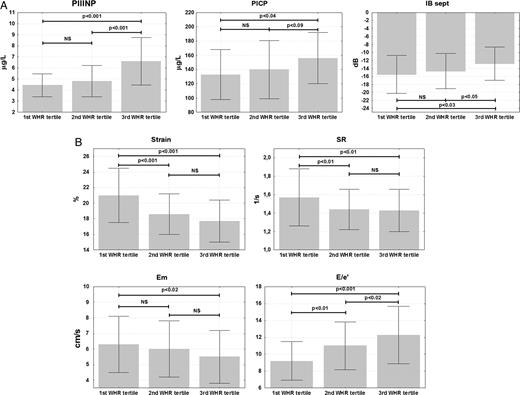
(A and B) Serum procollagen peptides and left ventricular function stratified by sex-specific waist-to-hip ratio (WHR) tertiles in patients with the metabolic syndrome. Cut-off points for tertiles of waist-to-hip ratio were as follows: first tertile men <0.94, women <0.8; second tertile men 0.94–1.03, women 0.84–0.91, and third tertile men >1.03, women >0.91. E/e′, the ratio of peak early mitral inflow velocity and peak early diastolic mitral annular velocity; Em, peak early diastolic myocardial velocity; IB sept, calibrated integrated backscatter in the basal septum; PICP, procollagen type I carboxy-terminal propeptide; PIIINP, procollagen type III amino-terminal propeptide; SR, peak systolic strain rate.
Reproducibility
The reproducibility of tissue Doppler measurements was calculated using values averaged from all the segments analysed in 15 randomly selected examinations, and the intra- and inter-observer variability was 0.7 ± 0.4 and 0.8 ± 0.5% for strain, 0.05 ± 0.02 and 0.07 ± 0.04/s for strain rate, 0.2 ± 0.3 and 0.3 ± 0.3 cm/s for myocardial velocities, and 1.2 ± 1.3 and 1.4 ± 1.4 dB for cIB, respectively.
Discussion
The main clinical findings of the present study are that myocardial echodensity is a stronger correlate of LV systolic and diastolic dysfunction in MS, than circulating procollagen peptide levels. Both fibrosis and LV function abnormalities are more marked at a higher waist-to-hip ratio, indicating larger visceral fat content. This might provide a rationale for the implementation of intensified therapy, both improving fibrosis and cardiac derangements, in this subset of patients.
LV function changes in metabolic syndrome
In line with the pathophysiological background, as well as data from previous studies, our investigations demonstrated LV derangements including myocardial hypertrophy, and systolic and diastolic dysfunction in the studied population with MS. The mechanisms underlying these abnormalities are multifactorial. Cardiac functional impairment has been postulated to be caused by enhanced myocardial fibrosis, inflammatory up-regulation, increased production of reactive oxygen species, hyperinsulinaemia and insulin resistance, myocardial substrate utilization abnormalities, reduced adenosine triphosphatase activity, disturbances of intracellular calcium turnover, local and systemic neurohormonal activation, intracellular accumulation of triglycerides, and toxic fatty acid intermediates with cardiomyocyte apoptosis, endothelial dysfunction, and increased ventricular load.3,5–7,23 Of the above factors, a pivotal contributor seems to be the renin–angiotensin–aldosterone system with its cell proliferation and free radical formation-stimulating actions, as well as pro-inflammatory and profibrotic properties. The two mediators of this system, namely angiotensin II and aldosterone, have been shown to augment extracellular matrix production, and TGF-β1 signalling is thought to partially mediate these effects.8,9
We used tissue Doppler-derived parameters for the quantitation of LV function. Myocardial deformation reflects the intrinsic performance of the heart muscle and minimizes the effects of external confounders, in contrast to myocardial velocities, which represent the total motion of cardiac tissue relative to the transducer. Nonetheless, myocardial velocities were used to provide information about diastolic motion, as the strain rate measurement of diastolic events may result from through-plane motion of the heart and a resultant excursion of the sample volume out of the scanning field.
Fibrosis in metabolic syndrome
Data are available on the influence of particular components of MS—hypertension, diabetes, and obesity—favouring both fibrotic processes and the development of LV dysfunction. However, the number of previous studies assessing fibrosis intensity in MS is limited. Enhanced myocardial fibrosis has been documented in experimental models of MS, which demonstrated increased collagen accumulation in arterial, perivascular, and pericapillary compartments of the heart muscle.24–26 In the only human study encompassing patients satisfying MS criteria, the evaluation was based on measurements of serum PICP, which was found to be elevated in the studied group.7
Our results concur with the above observations. We showed increased cIB in the basal septum—an echocardiographic parameter linked to myocardial fibrotic changes and increased levels of circulating PICP and PIIINP, indicating intensified collagen synthesis. Disproportionate fibrous tissue accumulation has previously been shown as a major determinant of altered myocardial acoustic properties.16,17 In the present study, blood procollagen peptides are less strongly associated with impaired cardiac function than abnormal myocardial echodensity. These biochemical markers are not heart specific and their blood pool actually reflects systemic collagen anabolism. Although validated previously to correlate with myocardial collagen deposition, circulating procollagen peptides give only an indirect insight into myocardial extracellular matrix activity. The interplay of fibrosis and myocardial reflectivity with LV dysfunction was corroborated in our investigations by the observation that patients with the highest levels of both procollagen I and III peptides, likely reflecting the most intensive fibrosis, demonstrated the most profound disturbances of both cardiac performance and cIB. This might provide further evidence for the link between myocardial fibrosis and LV functional and structural derangements. Different degrees of relationship between cIB and LV functional abnormalities, progressing from insignificant in ‘low’ fibrosis to strong in ‘high’ fibrosis patients might indicate that the relevance of information provided by IB in the context of its heterogeneous contribution to myocardial dysfunction differs depending on concomitant changes in collagen metabolism.
According to pathophysiological data, exaggerated collagen deposition leading to the interstitial and perivascular fibrosis is associated with deterioration of both LV systolic and diastolic performance. The mechanistic consequences of excessive fibrous tissue accumulation in the myocardium include increased myocardial stiffness with decreased LV distensibility and dynamic elastance that contribute to the rate of relaxation, diastolic suction, and contractile abilities of the heart muscle.27 Global LV systolic dysfunction develops only with severely increased myocardial collagen deposition, and is manifested by subtle deficits in longitudinal contractility. Another mechanism by which fibrosis involving perivascular regions may facilitate LV dysfunction includes diminished vasodilator capacity of the intramyocardial segments of coronary arteries, resulting in reduced coronary flow reserve.28,29
Our results imply that the progression of LV dysfunction is more rapid in the septal than in the lateral wall. LV systolic and diastolic abnormalities, which in the group with the lowest fibrosis were similar in both of these myocardial regions, became more severe in the basal septum in patients with intermediate severity of the fibrotic process. Conversely, the basal lateral wall proved to be more dysfunctional in later stages, involving the most advanced fibrosis. The above sequence might be consistent with the notion that the interventricular septum is exposed to a larger systolic stress than the LV free wall, due to its flatter and more asymmetric shape with a greater radius of curvature.30–32 There is resultant local up-regulation of signal transduction pathways, causing fibrosis.
Implications
The demonstrated association between the intensity of collagen synthesis and LV function disturbances suggests a mechanistic background that may warrant a therapeutic response. Adipose tissue, especially abdominal fat, is a source of fibrotic mediators or their precursors, such as TGF-β1 and angiotensinogen, and also other cardiodepressant factors.33 In keeping with these considerations, we found that patients with higher waist-to-hip ratio had more severe LV dysfunction, coincident with myocardial echodensity abnormalities and more intensive collagen synthesis. This observation might imply that specific treatments aimed at the limitation of myocardial fibrosis (e.g. aldosterone antagonists) should be implemented in MS patients with LV dysfunction. Excess body weight is also connected with insulin resistance. Haemodynamic changes with loading alterations affect cardiac performance as well.34 The accumulation of these many adverse conditions increases the risk of LV dysfunction and heart failure in patients with higher body weight.
The implementation of anti-fibrotic measures targeting the improvement in LV functional characteristics requires antecedent verification of the presence of excessive cardiac collagen deposition. The direct identification of fibrotic changes by endomyocardial biopsy cannot be used for large-scale applications due to its invasiveness. In addition, because of the inhomogeneity of myocardial collagen deposition, the accuracy of this method may vary depending on the site of sampling and specimen size.35 Echocardiography may be a reasonable, economically acceptable option, allowing for not only the quantitation of cardiac functional disturbances, but also the evaluation of structural alterations of myocardial tissue. This, however, needs further studies to standardize the integrated backscatter method, including the determination of threshold values justifying aforementioned therapeutic interventions.
Limitations
Although the demonstrated relationships seem coherent and are supported by previous findings, the cross-sectional design of this study limits conclusions about their causal character. Secondly, despite the absence of significant drug contribution in multivariable analysis, the maintenance of pharmacotherapy during investigations might have distorted some associations. Finally, as mentioned above, serum PIIINP and PICP do not exclusively represent myocardial collagen synthesis and are influenced by other extracardiac sources.
Conclusions
This study demonstrates the association between increased echocardiographic reflectivity, fibrosis markers, and LV systolic and diastolic dysfunction in MS. MS patients with remarkably increased abdominal fat deposition, who present more severe cardiac functional and fibrotic abnormalities, appear to be appropriate candidates for targeted preventive and therapeutic interventions intended to improve both fibrosis and LV function. Echocardiographic evaluation of myocardial acoustic properties might have clinical utility in MS and other disease conditions associated with enhanced fibrosis. Both the assessment of LV function, especially deformation parameters and myocardial echodensity might contribute to better estimation of patient prognosis, as well as provide a monitoring tool in patients subjected to specific therapies, e.g. those limiting fibrosis. This issue, critically important in view of the high prevalence of cardiac impairment in MS, should be explored in subsequent studies.
Funding
This work is supported in part by a grant from the National Health and Medical Research Council of Australia [455832].
Conflict of interest: none declared.
