


Abstract
Purpose: This study examines how life satisfaction changes as a function of the transition into retirement, distinguishing between different types of voluntary and involuntary exits. Design and Methods: Perceived satisfaction with life (SWL) was measured among 1,388 older Dutch workers on two occasions, separated by 6 years. During that time, more than half of participants (54%) left full-time employment and entered retirement. Results: Those who made a voluntarily departure from the workforce reported higher levels of perceived SWL compared with those who remained employed, whereas the life satisfaction scores of those whose departure was involuntary (due to health reasons, organizational reasons) were found to be the lowest. Other factors that had an effect on satisfaction included positive and negative health changes experienced during the 6-year interim, as well as changes in marital status due to divorce or loss of a spouse. Implications: These findings have important theoretical implications for the understanding of factors that shape individuals’ perceptions of how they view the quality of their lives. From an applied perspective, the findings have implications for the development of organizational initiatives aimed at helping workers transition into retirement in such a way as to maintain high levels of subjective well-being.
In the coming decades, Western countries will experience an unprecedented demographic change. Large numbers of baby boomers will begin to enter retirement, which in turn will signal the beginning of a significant increase in the number of individuals that depend on old-age pensions as a primary source of support (Beehr & Bennett, 2007). In this context, understanding how the successful aging of individuals is related to work and retirement patterns takes on increased importance. The portrait of retirement as an attractive and carefree phase of life may no longer be reflective of individuals’ expectations, particularly in light of the serious credit crises that have transpired in recent years. Indeed, among Europeans there is widespread concern that future pension levels will be insufficient to ensure a reasonable retirement quality of life (Hershey, Henkens, & Van Dalen, 2010).
As a result of these concerns, there has been an increase in studies over the past decade that have examined the implications of retirement for the individual older worker (see Van Solinge, 2012, for an overview). Particularly valuable have been longitudinal studies that have examined changes in retirees’ social, psychological, and economic well-being over time (Wang, 2007; Wang, Henkens, & Van Solinge, 2011). Such investigations have revealed appreciable differences in the quality of the retirement experience, ostensibly due to variations in resources, contextual dimensions, and the individual attributes of those who are newly retired. In this article, we argue that one of the key elements for understanding postretirement outcomes is the nature of the retirement transition—that is, whether it is forced or voluntary (Quine, Wells, de Vaus, & Kendig, 2007).
Empirical studies have revealed that involuntary retirement has negative effects on health (Gallo, Bradley, Siegel, Kasl, & Stanislav, 2000; Van Solinge, 2007), well-being (Calvo, Haverstick, & Sass, 2009; Gall, Evans, & Howard, 1997; Isaksson & Johansson, 2000; Van Solinge & Henkens, 2008), and depression (Brand, Levy, & Gallo, 2008; Gallo et al., 2006). Involuntary retirement has also been linked to an increase in deleterious health-related behaviors such as smoking, reduced physical activity, increased alcohol consumption among nondrinkers, and, ultimately, physical disability (Falba, Teng, Sindelar, & Gallo, 2005; Gallo, Bradley, Siegel, & Kasl, 2001; Gallo, Brand, Teng, Leo-Summers, & Byers, 2009; Henkens, Van Solinge, & Gallo, 2008). Few studies have analyzed the impact of involuntary retirement on satisfaction with life (SWL), and among those studies that have, changes in postretirement well-being have failed to compare satisfaction levels to individuals who have chosen to remain in the workforce. This is indeed a design weakness of many existing studies, as they have been unable to control for those who choose to “select themselves” into retirement. The aim of this investigation is to examine perceived changes in SWL that occur as individuals transition into retirement and the unique circumstances that surround those perceived changes. This is accomplished through the use of a research design in which older workers and retirees were followed for a period of 6 years.
This article adds to the retirement literature in four ways. First, this study is among only a handful of investigations that attempt to link the transition from the workforce to a person’s global assessment of subjective well-being (SWB; Wang, 2007; Pinquart & Schindler, 2007; Calvo et al., 2009). Second, this investigation is the first to examine SWL among those who experience different types of involuntary exits, and then, we compare those well-being levels with individuals who choose to leave the workforce voluntarily or remain in paid employment. With respect to this second point, we would go so far as to argue that the inclusion of a contrast group of older workers who remain employed is a prerequisite for a complete understanding of the impact that different types of workforce departures have on well-being. Third, the panel design of our study enables us to control for preretirement levels of well-being, while seeking to identify the nature of the relationships at the nexus of retirement transitions and life satisfaction. Pre–post data such as these in studies of well-being are rarely available (Wells, de Vaus, Kendig, & Quine, 2009; Wong & Earl, 2009). Finally, we will examine the impact of the retirement transition on SWL in relation to four critical life events: (a) health improvements (i.e., positive physical change), (b) health declines (i.e., negative physical change), (c) becoming divorced, and (d) becoming a widow. Health improvements could be expected to contribute in a positive way to an overall sense of well-being, whereas health declines and loss of a partner or spouse (either through divorce or death) could be expected to have a detrimental effect on SWL. The rationale for inclusion of these critical life event indicators will be further discussed in the following paragraphs, in the context of the broader theoretical framework.
Data for this investigation are drawn from The Netherlands. At the time the survey was carried out, The Netherlands was still a country with a strong early exit culture (De Vroom, 2004). Although the official (and mandatory) retirement age is still 65, very few workers (fewer than 10%) reach that age while still in the labor force. A large majority of older Dutch workers have the opportunity to benefit from the various early retirement arrangements and retire before the official public pension age of 65 (Damman, Henkens, & Kalmijn, 2011). At the organizational level, the early exit culture has been manifest as a lack of managerial support for later retirement. Although the law prohibits age discrimination in The Netherlands, age stereotypes exist, and employers encourage early retirement (Henkens, 2005). Recently, several policy changes have been implemented to restrict early retirement, including a move to raise the public pension age to 67 by the year 2020.
In the conceptual development of this project, we relied heavily on Wang’s (2007) resource view of well-being and retirement transitions. In that article, Wang argued that one’s perceived resources—be they social, health, financial, or psychological—serve to shape perceptions of well-being. So, for example, a retiree who experiences a reduction in social and financial resources upon entering retirement (due to the loss of regular interactions with colleagues and a reduction in income stream) might initially have negative perceptions of retirement. A different retiree, in contrast, might view the transition positively, if leaving the workforce resulted in a reduction in stress and increase in the quality of his or her physical health (Wang, 2007; see also Wang et al., 2011).
Retirement Transitions
From a life course perspective (Elder, 1995; Elder, Johnson, & Crosnoe, 2003), it is expected that the context surrounding one’s transition into retirement will affect perceptions of overall SWL. This is because one’s departure from the workforce is a critical life event that carries with it multiple and complex ramifications that could color psychological perceptions of past and future events (Kim & Moen, 2002; Moen, 1996). The act of leaving the workforce means that the individual must relinquish an organizational context in which he or she is embedded, which, for many, provides an important source of social support (Szinovacz, 2003). Furthermore, if the timing of the retirement transition is not on schedule (i.e., at an age that is either appreciably earlier or later than the societally normative retirement age), then the worker might not find support for the transition among friends, colleagues, and family members (Van Solinge & Henkens, 2007); thereby further eroding confidence in the notion that the transition is well founded. Thus, from an overarching standpoint, the life course perspective provides a broad theoretical framework from which to view resource changes that surround the work to retirement transition.
Moreover, the act of leaving full-time employment signals an important role transition that could itself be viewed as a critical life event from the life course perspective. According to the tenets of role theory (George, 1993), the worker is trading a specified role and concomitant position of occupationally linked status for the previously untested role of “retiree” (Feldman, 1994; Hulin, 2002). In many westernized countries, the stereotype of the retiree is that of one who has an overabundance of idle time and who is lacking in productivity (Price, 2000). According to Wang (2007), the onset of retirement can be particularly threatening to those who are most invested in their work; that is, those who see themselves as having the most to lose when it comes to the prospect of leaving regular employment. It is also important to acknowledge that new retirees enter a stage of life during which they can realistically expect to encounter other types of significant life events such as health-related declines (Piazza, Almeida, Dmitrieva, & Klein, 2010), the loss of a spouse due to death or divorce (Röcke & Cherry, 2002), and declines in intellectual functioning (Lindenberger & Ghisletta, 2009), all of which have been linked to the onset of depression (Burton, Haley, & Small, 2006; Huang, Wang, Li, Xie, & Liu, 2011; Kelley-Moore & Ferraro, 2005). For the new retiree, the subjective experience of encountering these negative life changes could lead to a diminished sense of self-worth (Ashforth, 2001), anxiety, depression (Thoits, 1992), and, ultimately, a lower overall sense of SWL.
In contrast to the arguments outlined earlier, recent studies recognize the heterogeneity that exists when it comes to the nature of one’s likely retirement experiences. Retirement may lead to a positive overall experience by providing opportunities for role enhancement (Fehr, 2012; Wang, 2007), leisure and recreation (Pinquart & Schindler, 2009; Siegenthaler & Vaughan, 1998), and civic engagement (Kaskie, Imhof, Cavanaugh, & Culp, 2008). These are all factors that have been shown to be positively linked to levels of well-being. In fact, Van Solinge and Henkens (2007) found that among recent Dutch retirees, 41% indicated that their retirement years were better than the 2 years prior to retirement. Similarly, Latif (2011) found that entering retirement had an overall positive impact on psychological well-being among older Canadian working adults.
The life course perspective provides a promising framework from which to study the heterogeneity of changes that take place surrounding the retirement transition, and the impact those changes are likely to have on psychological well-being. This perspective emphasizes the important role of contextual embeddeness in relation to perceptions of the nature of the transition (Van Solinge & Henkens, 2007). In the transition from work to retirement, probable contextual changes include declines in one’s financial status and decreases in the availability of social resources. The recognition of diminishing resources in one or both of these contexts could lead some to negatively view the transition, but among others, it could cast a broader negative shadow on the overall quality of one’s life. Furthermore, as suggested earlier, as one ages other possible critical life events—such as a decline in health status, divorce, and death of a spouse—may signal a loss of personal or social resources that could negatively impact perceptions of SWB.
The life course perspective also emphasizes the important role of human agency when it comes to the ability to successfully adapt to significant life transitions (Elder & Shanahan, 2006). Some 20%–30% of workers perceive the retirement transition to be beyond their control—that is, it is either forced (due to organizational downsizing) or involuntary (due to declining health conditions; Dorn & Souza-Poza, 2010; Szinovacz & Davey, 2005; Van Solinge & Henkens, 2007). In cases in which a worker’s transition is at the effect of a condition, entity, or individual beyond him or herself, it is tacitly acknowledged that the individual will need to relinquish a degree of autonomy and control. Giving up such control itself has been shown to be a risk factor for reduced well-being (Lachman, Rosnick, & Rӧcke, 2009; Pearlin & Pioli, 2003; Quine et al., 2007; Szinovacz & Davey, 2005). In light of the observations regarding life course and retirement transitions described earlier, for this study, we are able to make predictions regarding SWL for the second (T2) occasion of measurement. Those predictions are outlined in the following paragraphs.
We hypothesize that forced or restricted workforce departures will have a negative impact on SWL, particularly when compared with voluntary workforce departures or the decision to continue working. In contrast, it is difficult to make an a priori prediction as to the expected level of T2 satisfaction among those who indicated they left the workforce for “other” reasons, given the potentially varied set of motives they may have had for permanently exiting paid employment.
Furthermore, from the life course perspective, certain significant life events such as health changes and marital changes might also be thought to have an impact on SWL, as these events carry with them positive or negative resource implications. Specifically, it is anticipated that the loss of a spouse or partner either through death or divorce will be negatively linked to T2 SWL scores (Ben-Zur & Michael, 2009; Lucas, 2007). Negative health changes between T1 and T2 are also predicted to be linked to declines in SWL2 scores, primarily due to the actual or perceived constraints and loss of control individuals are likely to experience as a function of physical decline (Jonker, Comijs, Knipscheer, & Deeg, 2008; Lachman et al., 2009). Positive health changes that take place during the 6-year period are expected to be positively linked to the criterion (Johnsson, Tenenbaum, & Westerlund, 2011; Kim, June, & Song, 2003). By examining these health and marital changes in the context of the work to retirement transition, we hope distinguish variability in life satisfaction scores attributable to these critical life events from variability attributable to the nature of the retirement transition.
Design and Methods
Participants and Design
The data for this investigation were taken from an ongoing panel investigation of retirement behavior in The Netherlands, which was carried out by The Netherlands Interdisciplinary Demographic Institute (NIDI). In 2001 (Wave 1), data were collected from two sources: (a) older employees of more than 80 business units attached to three large Dutch multinational companies that are active in the fields of information and communications technology, retail, trade, and industry; and (b) older civil servants who were employed by the Dutch central government. A questionnaire was mailed to a select sample of employees aged 50 and older (n = 3,900) and their spouses. The total number of individuals who completed the survey at Wave 1 was 2,406. The response rate for older workers was 62%; 92% of their partners also agreed to participate in the study.
In 2006–2007 (Wave 2), a follow-up survey was conducted in which all surviving Wave 1 participants were resurveyed, once again by mail questionnaire. The Wave 2 survey asked respondents about changes in employment status, including retirement, since Wave 1, as well as changes in health-related and relationship behaviors. A total of 2,240 questionnaires were sent to surviving Wave 1 participants (45 individuals died between T1 and T2), of which 1,678 surveys were returned; 1,595 of those surveys were found to have complete or virtually complete data. Wave 2 response rates, following two reminder notices, were 75% for older workers and 97% for their partners.
For participant selection purposes, retirement was defined as shifting from receiving wages in the first wave to drawing an early retirement benefit or pension at the second wave. Following the approach of Pinquart and Schindler (2007), we excluded from analysis any employed individuals who shifted from solely receiving wages at T1 to receiving wages plus pension benefits at T2, because it was not possible to unambiguously determine the work status for these individuals. Moreover, persons who reentered the workforce after retiring were excluded from consideration, because not enough cases were available for a separate analysis. This resulted in a final sample of 1,388 individuals. Item nonresponse was low (<3%) and missing values were imputed using mean substitution. Whereas neither Wave 1 health nor gender predicted participation likelihood at Wave 2, younger and less educated persons were somewhat less likely to participate at the second measurement occasion. A complete description of this NIDI panel study and its participants can be found elsewhere (Henkens et al., 2008). Table 1 presents further details regarding the sample, the measurement and coding of variables, the wording of survey items, and descriptive statistics for dependent and independent variables.
Means, Standard Deviations, Percentages of Missing Values, Coding of Variables, and Wording of Survey Questions
| M | SD | Coding and psychometric properties | Wording (questions translated from Dutch) | |
|---|---|---|---|---|
| Criterion measure | ||||
| Satisfaction with life T2 (SWL2) | 3.64 | 0.62 | 3-item scale, range 1 (low level of satisfaction with life) to 5 (high level of satisfaction with life). For Wave 1, Cronbach’s alpha = .74. | Three Likert-type items drawn from Diener, Emmons, Larsen, and Griffin (1985) included: “In most ways my life is close to ideal,” “The conditions of my life are excellent,” and “So far I have gotten the important things I want in life.” (response categories: 1 = strongly disagree; 5 = strongly agree) |
| Life change variables | ||||
| Change in work status T1–T2 | ||||
| Continued working (reference category) | 0.46 | 0.50 | Dummy variable coded 0–1; 1 = yes | Five different types of changes in retirement status from T1 to T2 were recorded. The five categories for this variable are (a) continued working (continued working), (b) left the workforce on a voluntary basis (voluntary), (c) left the workforce for health reasons (involuntary health), (d) left the workforce for organizational reasons such as downsizing (involuntary organizational), and (e) left the workforce for other reasons (involuntary other). |
| Retired: voluntary | 0.39 | 0.49 | Dummy variable coded 0–1, 1 = yes | |
| Retired: involuntary—health | 0.02 | 0.15 | Dummy variable coded 0–1, 1 = yes | |
| Retired: involuntary—organizational | 0.11 | 0.31 | Dummy variable coded 0–1, 1 = yes | |
| Retired: involuntary—other | 0.02 | 0.15 | Dummy variable coded 0–1, 1 = yes | |
| Health changes T1-T2 | ||||
| Positive health change | 0.09 | 0.28 | Dummy variable coded 0–1, 1 = positive health change (codes 4 and 5) | Respondents were asked “Did your health situation change during the last 5 years?” (answer categories: 1 = strongly declined; 2 = declined; 3 = no change; 4 = improved; 5 = strongly improved). Two dummy variables were coded; no health change served as the reference category. |
| Negative health change | 0.28 | 0.45 | Dummy variable coded 0–1, 1 = negative health change (codes 1 and 2) | |
| Change in relationship status T1–T2 | ||||
| Divorced | 0.02 | 0.19 | Dummy variable coded 0–1, 1 = divorced | Marital status was measured at both waves using four categories: 1 = married; 2 = divorced; 3 = widowed; and 4 = never married. Two dummy variables indicated whether P’s became divorced or widowed between waves. |
| Widowed | 0.02 | 0.21 | Dummy variable coded 0–1, 1 = widowed | |
| Control variables | ||||
| Satisfaction with life T1 (SWL1) | 3.72 | 0.64 | See satisfaction with life T2. Cronbach’s alpha = .72 | See with life T2 |
| Age | 54.10 | 2.89 | Chronological age at T1, continuous | |
| Gender | 0.28 | 0.45 | Dummy variables; 0 = male, 1 = female | |
| Years of education | 12.80 | 3.41 | Continuous variable | The number of formal years of education that had been completed. |
| Married T1 (reference category) | 0.82 | 0.39 | Dummy variable 1 = married | Marital status was measured using four categories: 1 = married; 2 = divorced; 3 = widowed; and 4 = never married. Two dummy variables indicated whether respondents had a divorce or became widowed between the waves. |
| Divorced T1 | 0.10 | 0.30 | Dummy variable 1 = divorced | |
| Widowed T1 | 0.02 | 0.15 | Dummy variable 1 = widowed | |
| Never married T1 | 0.07 | 0.25 | Dummy variable 1 = never married | |
| Self-rated health T1 | 4.07 | 0.83 | Single item indicator: minimum 1 to maximum 5 | Question: “How would you characterize your health in general?” (1 = very good; 5 = very poor). Reverse coded. |
| Wealth (log) | 11.31 | 1.51 | Quasi-interval measure, range 7.73–13.25 | Question: “How large do you estimate your total wealth (own house, savings, stocks, etc., minus debts/mortgage) to be?” (1 = <10,000 guilders to 7 = >1 million guilders). The natural logarithm of the class averages was used (transformed to euros). |
| Perceived pension shortage (reference category = no/don’t know) | 0.34 | 0.47 | Dummy variable: 0 = no pension shortage/don’t know; 1 = pension shortage | Question: “Do you think you have sustained pension shortcomings during your career?” (1 = no, 2 = yes, 3 = don’t know). Missing values were coded as “don’t know.” |
| Supervisor T1 | 0.26 | 0.44 | Dummy variable, 1 = supervisor | Question T1: “Did you hold a supervisory or managerial position at work?” (answer categories: yes/no) |
Analysis Plan
The planned analysis will involve calculating a conditional change hierarchical regression model in which SWL scores at time two (SWL2) will serve as the criterion (Aickin, 2009). This dependent measure will be regressed on three sets of predictors. At the first level, SWL2 scores will be regressed on SWL scores at time one (SWL1) to control for baseline levels of the construct. In essence, each participant will serve as his or her own control with respect to the life satisfaction construct and will allow for a less ambiguous test of the retirement transition and critical life event constructs in a subsequent hierarchical level.
The second set of predictors will contain a series of control variables including marital status at T1 (including divorced; widowed; never married—“married” served as the reference category), gender, age at T1, years of education, health status at T1, self-reported wealth, the existence of a pension shortfall, and whether the respondent works in a supervisory or managerial position. Whether these 10 constructs are found to be linked to T2 life satisfaction scores will be empirically informative, but not of particular theoretical interest from the life course perspective. Rather, they will be entered into the regression model to statistically adjust T2 life satisfaction scores so as to provide a more clear-cut test of the life transition and life event variables entered in the third hierarchical level.
Once the individual difference dimensions in the second level have been accounted for, a third set of eight predictors indicative of major life changes will be added to the model. It is these predictors that are of primary interest in this investigation. The independent variables entered in this hierarchical level will include four separate indicators designed to capture the nature of the retirement transition, that is, whether the transition is: (a) voluntary, (b) organizationally dictated, (c) health-related, or (d) other/nonspecified (for this analysis “continued working” will be used as the reference category for the four dummy-coded retirement transition dimensions). In addition to these four transition indicators, four additional indicators of critical life events will be entered into the model, including: (e) the existence of positive and (f) negative health changes between T1 and T2, and (g) whether individuals became divorced or (h) widowed during the study period.
Results
The overall three-level conditional change model was found to account for nearly 33% of the variance in SWL2 scores (R2 = .328). The first level of the model revealed a significant effect for the SWL1 (baseline) scores taken on the first measurement occasion, F(1, 1386) = 466.89, p < .01, R2 = .252 (see Table 2). This anticipated effect reflects the strong positive relationship between the two sets of SWL scores.
Hierarchical Multiple Regression Analysis Predicting SWL2 (N = 1,388)
| Variable | B | SE B | Effect size | ∆R2 |
|---|---|---|---|---|
| Step 1 | ||||
| SWL1 (baseline) | .491* | .023 | 0.44b | .252* |
| Step 2 | ||||
| Marital status: divorced | −.004 | .050 | — | |
| Marital status: widowed | −.005 | .098 | — | |
| Marital status: never married | −.074 | .059 | — | |
| Gender | .024 | .035 | — | |
| Age at T1 | .002 | .005 | — | |
| Years of education | .010** | .005 | 0.06b | |
| Supervisor | .067** | .034 | 0.11d | |
| Self-rated health | .067* | .018 | 0.05b | |
| Wealth | .033* | .010 | 0.06b | |
| Pension shortfall | −.046 | .031 | — | .027* |
| Step 3 | ||||
| Positive health change | .101** | .051 | 0.16d | |
| Negative health change | −.160* | .033 | 0.26d | |
| Divorced between T1/T2 | −.272* | .103 | 0.44d | |
| Widowed between T1/T2 | −.326* | .098 | 0.52d | |
| Retirement: voluntary | .087** | .037 | 0.14d | |
| Retirement: involuntary health | −.387* | .103 | 0.62d | |
| Retirement: involuntary organizational | −.125* | .050 | 0.20d | |
| Retirement: involuntary—other | −.125 | .094 | — | .049* |
Notes: “Married” was used as the reference category for “marital status.” “Continued working” was used as the reference category for “retirement.” B values shown are unstandardized regression coefficients and SE(B) values are standard errors for those coefficients. Effect sizes are shown for each statistically significant predictor—these are standardized beta weights for continuous variables (designated with a b superscript) and Cohen’s d values for categorical variables (designated with a d superscript).
*p < .01. **p < .05.
The second hierarchical level, which contained 10 (individual difference) control variables, was also statistically significant as a set, F(11, 1376) = 48.47, p < .01, R2 = .279. As seen in the table, having never been married had a significant negative impact on SWL2. Years of education, supervisory/managerial status, and wealth were all positively related to SWL2 scores, and self-rated health showed a trend toward statistical significance. The incremental R2 at this level (2.8%) was statistically significant, F(10, 1376) = 5.21, p < .01.
As a set, the variables entered in the third hierarchical level also contributed significantly to overall prediction in the model, F(19, 1368) = 35.11, p < .01, R2 = .327. In fact, seven out of the eight independent variables in this set were found to be statistically significant at either the .05 or .01 level. A positive health change between the two occasions of measurement had a positive impact on SWL scores, as did the decision to voluntarily leave the workforce. In terms of Cohen d values (Cohen, 1988), effect sizes for these two predictors (0.16 and 0.14, respectively) proved to be small. Other critical life event indicators had a small or moderate negative impact on SWL scores, including negative health changes (d = 0.26), divorce (d = 0.44), and loss of a spouse or partner (d = 0.52). Moreover, involuntary retirement for organizational reasons was found to have a small detrimental impact on satisfaction scores (d = 0.20), but forced retirement due to health limitations proved to have a substantial impact (d = 0.62). The incremental R2 at this hierarchical level (4.9%) was statistically significant, F(8, 1368) = 12.35, p < .01.
In the analysis reported earlier, T1 life satisfaction scores were used as a control variable. However, to graphically illustrate the change in scores over occasions of measurement, we have plotted T1 and T2 satisfaction scores (using unadjusted means) for each of the different subgroups. Panel A of Figure 1 shows mean T1 and T2 SWL scores for individuals who continued working, retired voluntarily, and retired involuntarily. As seen in the figure, voluntary retirement resulted in similar SWB scores over the two occasions of measurement, which were not found to be significantly different from one another, t(543) = −0.34, ns. There was a small but significant T1/T2 decline for those who continued working, t(631) = −3.65, p < .01, d = 0.14. In contrast, sharper declines were witnessed among those who left the workforce on an involuntary basis, t(211) = −4.58, p < .01, d = 0.32.
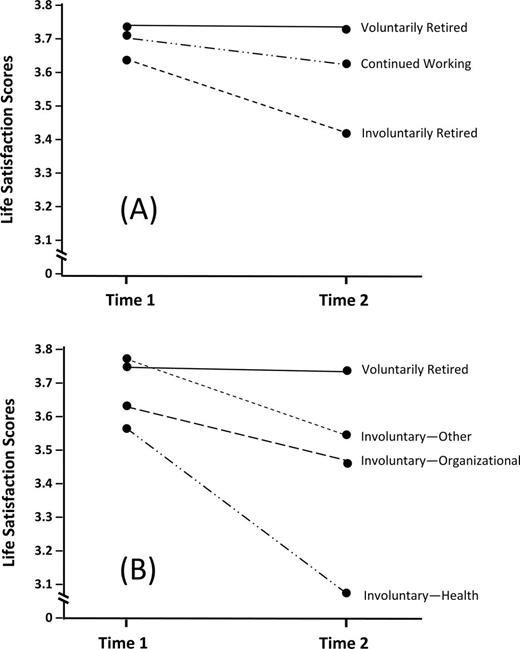
Mean T1 and T2 life satisfaction scores for those who continued working, retired voluntarily, and retired involuntarily (Panel A). Mean life satisfaction scores for those who experienced the four different types of retirement transitions (Panel B).
Panel B of Figure 1 shows mean scores plotted as a function of the four different types of retirement transitions over the two occasions of measurement. Although the initial (T1) starting point for well-being scores differed somewhat across the four groups shown, the magnitude of the slopes reveals a clear trend. Relative to those who retired of their own volition (reported earlier), the mean scores for involuntary retirees in all three groups revealed a clear decline that coincided with the timing of the work to retirement transition. There was a significant drop in scores for those who faced forced retirement for “other” reasons, t(33) = −2.33, p < .05, d = 0.39; those who retired for organizational reasons, t(149) = −2.82, p < .01, d = 0.23; and those who left the workforce due to health concerns, t(27) = −3.52, p < .01, d = 0.81. As seen in the figure, a particularly precipitous drop in scores was observed among those who were forced to retire due to ill health. Presumably, for these individuals, their state of well-being was affected not only by failing health but also by being forced to relinquish their position in the workforce on the basis of the physical decline(s) they had experienced.
Discussion
The objective of this investigation was to explore whether different types of retirement transitions have differential influences on how individuals rate overall levels of satisfaction with their lives. The empirical findings in this regard were unequivocal. Those individuals who chose to voluntarily retire during the 6-year study period showed stable perceptions of satisfaction with their lives. This is indeed an interesting outcome inasmuch as scores from the reference group—that is, those who continued to work during the course of the investigation—showed a significant decline. Therefore, it would appear that the ability to transition from the workforce on a volitional basis provides a buffering effect against sliding negative perceptions of satisfaction seen among those who are unable or unwilling to leave employment. The fact that those who remained in the workforce perceived SWL to decline over the 6-year period is an intriguing finding. It suggests the possibility of heterogeneity among members of this group, which could stem from a subset of individuals who feel they are forced to continue working due to a lack of opportunities to retire.
The stability of those who voluntarily chose to leave the workforce is brought into sharper contrast when the comparison conditions involve those workers who left the workforce on an involuntary basis. Workers who transitioned out of the workforce for organizational reasons (e.g., downsizing, golden parachutes) demonstrated lower levels of SWL compared with those who remained employed. Those who transitioned out of employment for health reasons showed the greatest drop in SWL relative to baseline scores, presumably in part due to the nature of the transition itself and in part due to the nature of the health considerations that drove them into retirement.
In addition to the significant impact of the retirement transition on SWL, other life change indicators—changes in health status and changes in relationship status—revealed appreciable effects. In terms of the former, it was found that a health improvement during the study period was positively related to evaluations of SWL. In contrast, a negative health change was associated with perceived declines in life satisfaction, a finding that is consistent with the work of Jonker and colleagues (2008). The effect sizes in Table 2 reveal that involuntary exits due to health reasons and the loss of a partner (for either reason) had a more profound effect on SWL than either a negative health shock or being forced to transition out of the workforce for organizational reasons.
A number of the major findings from this study are consistent with the tenets of the life course perspective (Elder, 1995; Elder et al., 2003). Specifically, there is clear evidence to suggest that one’s phenomenological sense of self is indeed shaped by the context surrounding the work to retirement transition. In instances in which the workforce departure is involuntary due to downsizing, then the individual faces the loss of important social, occupationally linked psychological, and financial resources. Alternatively, if the individual has to continue working beyond the normative retirement age, then negative self-perceptions may arise due to the sense of being “off time” relative to one’s peers (i.e., by retiring later than the normative age at which one’s peers leave the workforce). Moreover, involuntary retirement due to health concerns represents a multifaceted threat. In such cases, workers face what may be an off time (early) transition, a loss of social resources and financial capital, while at the same time having to deal with the challenges brought about by diminishing physical abilities. In each of the earlier scenarios, the worker not only loses the support of a familiar social context but also has to face up to the fact that the transition is poorly timed with respect to either societal norms or personal expectations. Both factors—social embeddedness and the timing of the transition—are critical when it comes to the perceived quality of the retirement transition (Szinovacz, 2003).
As pointed out in the introduction, role theory (e.g., George, 1993; see also role enhancement theory, Barnett & Gareis, 2006) also delineates expectations regarding the way in which the retirement transition is likely to be experienced on the basis of the nature of the circumstances surrounding the change. Specifically, it would be anticipated that SWL would be more positively perceived in cases in which the individual leaves employment on a voluntary basis as opposed to situations in which the transition is either “forced” (on the basis of organizational pressures) or due to circumstances beyond the worker’s control (such as in the case of ill health; Calvo et al., 2009; Isaksson & Johansson, 2000). The data from this investigation are indeed consistent with these predictions. Not only was it found that those who exited the workforce of their own volition experienced the most positive outcome in terms of SWB, but in all three conditions in which individuals experienced involuntary workforce departures, SWL showed a significant pre–post decline.
Taken together, the observations pointed out earlier regarding life satisfaction provide a degree of empirical support for Wang’s (2007) resource view of well-being and retirement. The panel data from this study revealed that in situations in which individuals are likely to encounter a reduction in personal resources—be they financial, health, social, or psychological—then they are likely to encounter a decline in SWB. In contrast, choosing to enter retirement volitionally and on the basis of one’s own terms was the only context in which SWB did not decline. Furthermore, under conditions when resources improved, such as in the case of a positive health change, then an improvement in SWB was observed. These observations lead us to conclude that as our understanding of retirement transitions become more nuanced, making predictions regarding individual quality-of-life outcomes should become more straightforward. That is, changes in the trajectory of one’s life satisfaction upon leaving employment should be reflective of gains and losses in personal resources that accompany the retirement transition.
The theoretical observations raised earlier also resonate with the personal resource (lifestyle) model advanced by Hendricks and Hatch (2006, 2009), which suggests that perceptions of one’s life situation is determined, in part, by the interaction of structure and agency. Specifically, these authors suggest that one’s perceived status is largely a function of social–familial resources, physiological–psychological resources, and fiduciary (often monetary) resources. We believe that the effects of all three types of capital on perceptions of life satisfaction are evident among our data.
Although the findings from this study are illuminating, they need to be interpreted with caution as the investigation is not without its limitations. One such consideration is the fact that the second time of measurement for individuals was, on average, only 2 to 3 years after they had experienced their departure from the workforce. It could be that the declines witnessed in SWL scores among those who experienced an involuntary change in work status are themselves transitional in nature (cf., Gall et al., 1997; Von Hippel, Henry, & Matovic, 2008), reflecting the turbulence and stress that accompany a major life change. Perhaps negative changes in SWL following an involuntary departure from employment would rebound in a positive direction once the individual fully adjusts to the new role of retiree, and discovers the unique positive opportunities that role has to offer. Consistent with this suggestion, there is evidence that longitudinal patterns of psychological well-being are neither stable nor linear surrounding the retirement transition (Wang, 2007), and for this reason, future studies that explore SWL along a longer timeline would be beneficial. By taking more observations over an extended time frame, it should be possible to evaluate the stability of the patterns observed in this investigation.
Future investigations might also profitably explore why it was that those who faced involuntary retirement had lower baseline levels of life satisfaction than those who voluntarily retired, as seen in Panel B of Figure 1. This observation begs the question as to whether there might have been other (unmeasured) individual difference dimensions that had an influence on well-being and the nature of the retirement transition, other than the factors we control for in our regression models.
Large numbers of baby boomers will transition into retirement in the coming decades under a variety of different circumstances. Some will cross the threshold from work to retirement of their own volition, whereas others will experience the transition on an involuntary basis, and in some cases, under high levels of stress or duress. The findings from this investigation clearly indicate that the nature of the conditions surrounding the transition will affect not only one’s SWL but also presumably the quality of one’s self concept. This is not an inconsequential outcome in light of the impact SWB has on the anticipated quality of one’s mental health. That being the case, from an organizational perspective, it would behoove employers to consider developing opportunities to help downsized workers experience the transition smoothly. At a minimum, this could involve employer-sponsored preretirement planning programs that go beyond the standard topics of health and financial planning to address topics such as psychological well-being and the optimal timing of the retirement transition. Other organizational initiatives could involve the development of retiree mentoring programs for younger workers or other types informal mechanisms—be they social, occupational, or professional—through which retirees could remain engaged. Also beneficial would be attempts to develop prescriptive decision-making tools or strategies workers could use to evaluate the timing of their departure from the workforce. After all, the findings from this study clearly demonstrate that an organizational exit that occurs at the “right time” and on the basis of one’s own volition represents the best case scenario when it comes to the prospect of experiencing late life psychological well-being.
Funding
This work was supported by a VIDI grant (452-05-314) awarded to K. Henkens by The Netherlands Organization for Scientific Research (NWO).
References
Author notes
Decision Editor: Rachel Pruchno, PhD

