


Abstract
Min mice provide a good model of human familial adenomatous polyposis. Recently, we have reported on two recombinant inbred lines (I and V) and the location of a modifier (Mom3) close to Apc, which altered polyp numbers in our mice possibly by modifying the frequency of wild-type (WT) allele loss at Apc; mice with severe disease (line V) showed elevated rates of loss. We now show that in line I only, a single pregnancy caused a significant increase in adenoma multiplicity compared with virgin controls (P<0.001) and that an additional pregnancy conferred a similar risk. Pregnancy was linked to both adenoma initiation and enhanced tumour growth in line I mice, and interline crosses indicated that susceptibility to pregnancy-associated adenomas was under genetic control. We found no evidence for the involvement of oestrodial metabolizing genes or the oestrogen receptors (Esr1 and 2) in tumour multiplicity. Importantly, a significantly elevated frequency of WT allele loss at Apc was observed in adenomas from parous mice (line and backcrossed) carrying the line I Min allele relative to equivalent virgin controls (P=0.015). Our results provide the first experimental evidence for genetic determinants controlling pregnancy-associated tumourigenesis; analogous genetic factors may exist in humans.
INTRODUCTION
In the UK, colorectal cancer (CRC) is the second highest cause of cancer-related deaths (1). In the majority of CRC patients (80%), tumours are considered sporadic in origin, although a number of studies have shown that genetic factors may account for a proportion of the total CRCs presenting in the general population, as well as influencing disease severity (2–4). Overall, an individual's lifetime risk of developing CRC is probably determined by a combination of life-style, chance and the balance between inherited resistance and susceptibility genes. For women, reproductive factors have been shown to alter the risk of colon cancer: parity has been inversely associated with colon cancer; and the use of hormone replacement therapy (HRT) decreases risk (5–12). Pregnancy itself involves steady, elevated levels of the hormone oestrogen and these increased levels have been reported to reduce the risk of microsatellite unstable CRC tumours (13). It is also curious that hypermethylation, and consequent reduced expression, of the oestrogen receptor in the colon is linked to ageing, and that tumours have been found to arise from cells that have lost expression of this receptor (14). Elevation of oestrogens in post-menopausal women undergoing HRT, or as a result of obesity, may reduce loss of ER expression. Paradoxically, in vitro studies have shown that oestradiol stimulates the growth of colon cancer cell lines (15). However, during pregnancy, a number of factors in addition to oestrogen, such as growth hormones and prostaglandins, are produced and may contribute to alterations in CRC risk. Extensive experimental studies on hormonal influences on intestinal tumour susceptibility and predisposition remain to be undertaken and, as yet, there have been no studies to assess common genetic determinants influencing adenoma formation or CRC risk following pregnancy.
Familial adenomatous polyposis (FAP) is a well-characterized, rare, autosomal-dominant condition that predisposes to CRC. FAP patients inherit a mutated copy of the adenomatous polyposis coli (APC) gene, and are characterized by the formation of hundreds to thousands of polyps in the large bowel. It is notable that these tumours typically arise during puberty. These benign lesions, if left untreated, will lead to colon cancer. ApcMin/+ (Min) mice are heterozygous for a truncating Apc mutation; but, in contrast to FAP patients, the majority of adenomatous polyps occur in the small intestine rather than the colon. Like FAP, most of the adenomas appear in ApcMin/+ mice during the period of sexual maturation (16). The Min model has been used to provide examples of loci (Mom1, 2 and 3) that modify adenoma numbers in the small intestine (17–21). We have reported recently the establishment of two recombinant lines of Min mice, which show significantly different numbers of adenomas in the intestinal tract. Line V has a severe phenotype (mean adenoma number, 370) compared with line I (mean=79) (21). Adenoma numbers have remained stable over a significant number of generations with only limited intraline variation observed (21). We mapped Mom3 close to Apc, using the recombinant lines and we proposed that the modifier influences adenoma number by altering the frequency of wild-type (WT) Apc allele loss (line I, 77% against line V, 96%; P=0.003, Fisher's exact test) (21). The influence of pregnancy on adenoma numbers in the Min mouse has yet to be investigated and we now report such a study using the two recombinant inbred lines, V and I.
RESULTS
A single pregnancy increases adenoma numbers in line I but not line V Min mice
To test the influence of a single pregnancy on adenoma numbers in the two lines, we counted tumours in the intestinal tracts of female mice that had undergone a single pregnancy and in virgin control mice (Table 1). In accordance with data reported previously (21), control line V mice had significantly more adenomas than control line I mice (P<0.0001, Student's t-test). In line I female mice, a single pregnancy was an important determinant of total adenoma numbers in sections II and III of the small intestine (line I section II mean: one litter, 39.3; virgins, 17.9; line I section III mean: one litter, 91.0; virgins, 57.5; P=0.0002 and P=0.01, respectively; Table 1) and in the caecum (mean: one litter, 17.0; virgins, 2.4; P<0.0001; Table 1). Moreover, in line I, the total adenoma numbers in the intestinal tract were significantly higher in females that had had a single pregnancy (mean, 212.1) than in virgin controls (mean, 121.4; P=0.0008; Table 1). The caecum showed the highest fold increase in tumour numbers (8.0×) of any region examined. We noted that age at death was not significantly different between line I virgin mice and those who had a pregnancy (mean: one litter, 136.1; virgins, 141.1; P=0.6). In contrast to the line I animals, pregnancy had no influence on tumour numbers in any segment of the intestine of line V mice (mean total numbers: one litter, 344.4; virgins, 322.3; P=0.4) and age at death did not differ between controls and a single pregnancy (mean: one litter, 82.3; virgins, 84.3). Overall, our data strongly suggested that the effect of pregnancy on tumour number had a genetic basis. In comparison, adenoma numbers did not increase in male line V or I mice used for breeding purposes relative to virgin males from the same line (line V, P=0.7; line I, P=0.4, Student's t-test).
Tumour multiplicity as a result of a single pregnancy in line I and V ApcMin/+ mice
| Line I | Line V | |||||
|---|---|---|---|---|---|---|
| No litter (n=21) | One litter (n=7) | P-value | No litter (n=30) | One litter (n=10) | P-value | |
| Sm.Int.I | 9.3±4.0 | 12.1±9.2 | 0.4 | 23.0±8.8 | 20.3±6.1 | 0.3 |
| Sm.Int.II | 17.9±7.2 | 39.3±19.0 | 0.0002 | 41.1±13.1 | 41.2±12.0 | 0.9 |
| Sm.Int.III | 57.5±14.0 | 91.0±21.6 | 0.01 | 149.4±33.6 | 162.5±35.7 | 0.3 |
| Sm.Int.IV | 31.4±9.2 | 48.4±11.8 | 0.2 | 104.0±31.7 | 115.2±38.0 | 0.3 |
| Colon | 2.8±2.0 | 4.7±3.4 | 0.09 | 4.6±2.6 | 4.5±3.3 | 0.9 |
| Caecum | 2.4±1.8 | 17.0±13.9 | <0.0001 | 0.3±0.5 | 0.7±0.9 | 0.8 |
| Total | 121.4±28.5 | 212.1±59.6 | 0.0008 | 322.3±67.5 | 344.4±68.8 | 0.4 |
Mice are grouped according to line, and then whether they have had a single pregnancy (one litter) or are virgins (no litter). Small intestine (Sm.Int.) was divided into four segments I–IV. Values shown are mean±standard deviations.
More than one pregnancy results in enhanced risk of adenoma formation in line I mice
We now considered the influence of more than one pregnancy on tumour formation in Line I Min mice. Compared with a single pregnancy, those mice producing more than one litter showed a statistically significant increase in tumour numbers in segments I (mean: >1 litter, 18.6; one litter, 12.1), III (mean: >1 litter, 110.5; one litter 91.0) and IV (mean:>one litter, 65.0; one litter, 48.4) of the small intestine (P=0.04, 0.01, 0.009, respectively; Table 2). Multiple pregnancy did not significantly alter adenoma number in the colon (mean: >one litter, 5.0; one litter, 4.7; P=0.8) or caecum (mean: >one litter, 18.0; one litter, 17.0; P=0.7; Table 2). Age at death was not significantly different between mice producing one, more than one or virgin controls (mean: >one litter, 143.4; one litter, 136.1; no litters, 141.1; P=0.6). By using a multivariate linear regression model, adjusting for age at death and nesting number of litters, we identified that there is a significant positive linear increase in the number of tumours with the increasing number of litters (all sections of the gut (P<0.0001). Age was not significant in the regression model. Furthermore, the relative increase in polyp numbers when comparing virgin control mice with those producing one litter was approximately equal to the increased tumour burden observed between mice producing one and those completing one or more pregnancies. This was true for all sections of the small intestine (P>0.3, Wald test).
Tumour multiplicity as a result of multiple pregnancies in line I ApcMin/+ mice
| Line I | |||
|---|---|---|---|
| One litter (n=7) | >One litter (n=20) | P-value | |
| Sm.Int.I | 12.1±9.2 | 18.6±8.8 | 0.04 |
| Sm.Int.II | 39.3±19.0 | 48.5±18.1 | 0.2 |
| Sm.Int.III | 91.0±21.6 | 110.5±21.0 | 0.01 |
| Sm.Int.IV | 48.4±11.8 | 65.0±18.3 | 0.009 |
| Colon | 4.7±3.4 | 5.0±4.0 | 0.8 |
| Caecum | 17.0±13.9 | 18.0±10.7 | 0.7 |
| Total | 212.1±59.6 | 265.5±55.8 | 0.01 |
Mice are grouped according to whether they have had a single pregnancy (one litter) or more than one pregnancy. Small intestine (Sm.Int.) was divided into four segments: duodenum (I), jejunum (II), proximal and distal ileum (III and IV, respectively). Values shown are mean±standard deviations.
Pregnancy leads to an increase in the smallest and largest adenomata
We assessed the size of adenomas appearing in the small intestines dissected from parous line I Min mice and virgin controls (n=12). The mice selected were all sacrificed at approximately the same time point (150–165 days). The total number of adenomas recorded was significantly different between parous and virgin mice for each of the three size bins (<0.75, 0.75–4 and >4 mm; P<0.001; Student's t-test). Binomial regression analysis indicated that when breeders were compared with virgins, the incidence rate ratio (IRR) was highest for adenoma ≤0.75 mm and ≥4 mm (IRR, 3.2 and 9.8, respectively; Table 3) and lowest for tumours 0.75–4 mm (IRR, 1.6, Table 3). These data show that tumours <0.75 and >4 mm represent a significant proportion of the additional tumour burden in the line I Min mice completing a pregnancy, and while the smallest adenomas (>0.75 mm) were equally distributed in each of the small intestine section, the largest adenomas (≥4 mm) were more common in section IV (IRR, 26.0) compared with the other three segments (IRR, 5.5–6.4; Table 3) of parous mice.
IRR of adenoma size when comparing parous (n=12) and nulliparous (n=11) Line I Min mice
| <0.75 | 0.75–4 | >4 | |||||||
|---|---|---|---|---|---|---|---|---|---|
| IRR | 95% CI | P-value | IRR | 95% CI | P-value | IRR | 95% CI | P-value | |
| Total Sm. Int. | 3.2 | 2.3–4.5 | <0.001 | 1.6 | 1.2–2.1 | 0.001 | 9.8 | 4.9–19.4 | <0.001 |
| Sm.Int.I | 3.0 | 1.7–5.2 | <0.0001 | 0.8 | 0.6–1.1 | 0.16 | 6.4 | 1.8–23.0 | 0.004 |
| Sm.Int.II | 4.8 | 2.9–7.8 | <0.0001 | 2.1 | 1.4–3.2 | <0.0001 | 5.5 | 0.8–36.9 | 0.08 |
| Sm.Int.III | 1.9 | 1.3–2.7 | <0.0001 | 1.7 | 1.5–2.0 | 0.001 | 6.4 | 1.4–30.0 | 0.02 |
| Sm.Int.IV | 3.4 | 1.9–5.9 | <0.001 | 1.4 | 1.1–1.6 | 0.002 | 26.0 | 2.8–234.0 | 0.004 |
Pregnancy-associated adenoma formation is retained by backcrossed mice carrying the line I APCMin allele
We investigated the influence of pregnancy on tumour numbers in an N1 cross (line I ApcMin/+ × line V Apc+/+, denoted IMinV+). The N1 IMinV+ that had produced one or more litters showed significantly more tumours than virgins in sections II (mean: >one litter, 52.0; virgins, 14.6; P=0.006) and III (mean: >one litter, 97.8; virgins, 51.0; P=0.01) of the small intestine, and the caecum (mean: >one litter, 16.8; virgins, 1.0; P=0.0006; Table 4). There was no significant difference in age at death between virgins and mice producing litters (mean: >1 litter, 150.5; virgins, 133.4; P=0.5). When mice from another N1 cross (line I WT × line V WT) were backcrossed to line I Min mice over five generations (N5), the resulting progeny that experienced one or more pregnancies had significantly more adenomas in all sections of the small intestine and caecum than control mice (all <0.0001; Table 5). Age did not differ between experimental groups (mean: >1 litters, 141.6; virgins, 146.1; P=0.9). Overall, these data confirmed that the effect of pregnancy on tumour multiplicity has a genetic basis.
Adenoma numbers in intestinal tract of N1 ApcMin/+ mice
| N1 (line I ApcMin/+ × line V Apc+/+) | |||
|---|---|---|---|
| No litter (n=7) | ≥One litter (n=4) | P-value | |
| Sm.Int.I | 11.9±2.9 | 16.5±10.5 | 0.2 |
| Sm.Int.II | 14.6±5.7 | 52.0±28.1 | 0.006 |
| Sm.Int.III | 51±17.2 | 97.75±19.8 | 0.01 |
| Sm.Int.IV | 33.7±19.6 | 58.8±22.4 | 0.2 |
| Colon | 2.4±2.5 | 3.5±1.3 | 0.9 |
| Caecum | 1.0±1.2 | 16.8±7.7 | 0.0006 |
| Total | 114.6.1±39.8 | 245.3±80.7 | 0.02 |
Mice are grouped according to whether they have had one or more pregnancies (≥one litter) or are virgins (no litter). Values shown are mean±standard deviations.
Adenoma numbers in intestinal tract of N5 ApcMin/+ mice
| N5 (I+V+) × IMinI+ (genotype, IMinV+ or IMinI+) | |||
|---|---|---|---|
| No litter (n=30) | ≥One litter (n=6) | P-value | |
| Sm.Int.I | 8.0±4.3 | 19.7±8.3 | <0.0001 |
| Sm.Int.II | 19.4±7.6 | 58.5±19.0 | <0.0001 |
| Sm.Int.III | 61.7±13.7 | 112.2±14.1 | <0.0001 |
| Sm.Int.IV | 33.9±11.0 | 68.5±17.6 | <0.0001 |
| Colon | 3.5±2.3 | 2.8±2.3 | 0.5 |
| Caecum | 2.2±2.0 | 11.3±6.2 | <0.0001 |
| Total | 128.7±28.3 | 273.0±54.4 | <0.0001 |
N1 (line I WT × line V WT) backcrossed to line I Min mice to give N5 Min mice. Animals are grouped according to whether they have had one or more pregnancies (≥one litter) or are virgins (no litter). Values shown are mean±standard deviations.
No evidence for the involvement of oestrodial metabolizing genes in pregnancy-associated adenoma formation
Oestrogen and oestrogen-metabolizing enzymes such as those encoded by the hydroxysteroid dehydrogenase (Hsd) genes are known to be important in cancer (22,23). Previously, our screen of 838 microsatellite markers revealed a small number of chromosomal segments containing markers polymorphic between lines I and V (Fig. 1). Curiously, the polymorphic region on chromosome 3 contains a cluster of Hsd genes (Hsd3b, Hsd3b1-6) and two 17-beta Hsd genes, Hsd17b2 and Hsd17b5, map to two other segments containing polymorphic markers on chromosomes 8 and 13, respectively. Hsd17b4, which has been implicated directly in colon cancer (15), is located distal to Apc on proximal chromosome 18 (Fig. 1) close to the mapped position of Mom3. Given the association of sex steroids with gastrointestinal disease, it was important to investigate these genes as potential modifiers in Min mice. We sequenced all coding regions and splice sites of Hsd3b, Hsd3b1-6 and Hsd17b2, Hsd17b4 and Hsd17b5, but did not identify any polymorphisms between the two lines. Similarly, there were no coding sequence or splice site polymorphisms between lines for Perc, Taf7, Taf4beta, Cables1 and Egr-1, all of which map to proximal chromosome 18 and are known to interact with oestrogen and/or its metabolites.
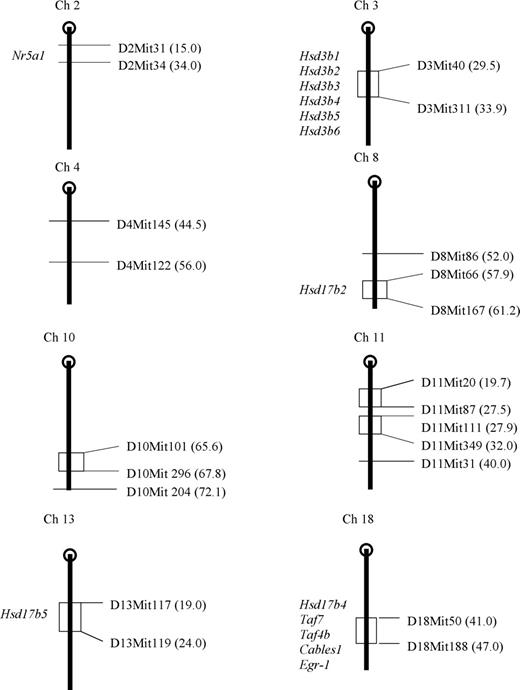
Chromosomal locations of line I and V polymorphic microsatellites markers. Polymorphic markers delineating chromosomal segments harbouring polymorphic microsatellites are given to the left of the stylized chromosome and their position in centimorgans (cM) shown in parenthesis. Genes mapping within regions and referred to in text are shown to the left of chromosome.
Q-PCR based on a TaqMan assay for Hsd17b4 did not show any difference in expression between the lines in female normal mucosa from any of the four section of the small intestine (data not shown). We also tested for difference in expression for the Cyp19A1 gene using TaqMan assay. Cyp19A1 is involved in oestrogen production along with a cis-regulating element Nr5a1 that maps within the line I/V polymorphic segment on chromosome 2 (Fig. 1). No expression differences were detected in any section of the small intestine (data not shown).
Oestrogen receptors alpha and beta, and a number of genes interacting with oestrogen were not implicated in pregnancy-associated adenoma formation
Given previous reports of alteration in oestrogen receptors (Esr1 and Esr2) in human colorectal tumours, we next investigated if there were differences in the levels of protein expression between the two lines, and/or whether there were any changes in expression following pregnancy. Immunohistochemistry showed that both tumours and normal mucosa from each experimental group were Esr1 and 2 positive and, furthermore, Q-PCR failed to find any difference in receptor gene expression in the normal small intestinal mucosa (I–IV) prepared from female line I and V mice that had completed a pregnancy and virgin controls (data not shown).
Tumours from parous line I mice show higher frequency of allele loss of WT Apc than line I nulliparous controls
In ApcMin/+ C57BL/6J, adenoma formation generally occurs by somatic recombination and consequent allele loss of the WT Apc copy (23–25). We have previously shown that the increased severity of disease in line V was linked to a higher frequency of allele loss in the adenomas from these mice compared with Line I (Line I, 76% (46/60); line V, 96% (52/54); P=0.003, Fisher's exact test) (21). In an independent set of intestinal adenomas from female Line I and V mice for this study, we have confirmed the difference in frequency of WT allele loss between the two lines (line I, 76%, 56/73; line V, 91%, 75/82; P=0.014, Fisher's exact test). Importantly, the frequency of loss in adenomas from line I females who had undergone a pregnancy (parous line I, 91%, 81/89) was essentially equal to that of tumours from equivalent line V females (parous line V, 94%, 45/48; P=1.0, Fisher's exact test); but significantly different from virgin line I females (nulliparous line I, 76%, 38/50; P=0.015, Fisher's exact test). Overall, these data suggest that the increase in disease severity in line I animals might be a consequence of enhanced allele loss at WT Apc and is consistent with the observations regarding the higher adenoma multiplicity seen in line V relative to line I (21).
DISCUSSION
The experimental data presented here indicate that Min mice of line I, but not of line V, are susceptible to pregnancy-associated adenoma formation and that this is under genetic control. Each subsequent pregnancy in line I females confers a similar risk. In terms of increased tumour multiplicity in parous mice, the most significant contribution was made by the smallest adenomas (<0.75 mm) observed in all sections of the small intestine. The tumours' small size suggested they might have been initiated during the course of pregnancy. In contrast, most large adenomas (>4 mm) were found in section 4 (proximal ileum) of the small intestine of parous mice indicating a region specific influence of pregnancy on the growth of those tumours initiated prior to pregnancy.
Interestingly, our data for increased susceptibility to intestinal tumourigenesis in line I female Min mice completing a pregnancy appear to run counter to the human epidemiological data, as both parity and HRT use reduce colon cancer risk (5–12). Nevertheless, the genetic basis of the pregnancy-associated susceptibility to adenoma formation in the mouse clearly warrants investigation, as any identified variant(s) might influence CRC disease susceptibility and/or severity in the human population. Although the genetic basis remains to be elucidated, it is possible that underlying variation between the line I and V recombinant lines results in differences in hormonal levels as a consequence of expression or metabolism and/or a disparity in cellular response to hormones between pregnant Min I and V animals leading to tumour promotion only in the former. The mechanisms whereby hormones, such as oestrogens, influence tumour development is unknown. Interestingly, evidence of functional interaction between the oestrogen receptor α and the Wnt signalling pathway, in which abnormalities are known to occur in CRC, have been reported using transgenic Drosophila (26).
Evidence that oestradiol can act as a mutagen has recently been demonstrated using human breast epithelial cells exposed to 17β-oestradiol and the catechol metabolites 4-hydroxyestradiol and 2-hydroxyestradiol (27). Transformation phenotypes observed using cell culture techniques were associated with genomic changes including loss of heterozygosity (LOH) in chromosomes 13 and 17. Genetic losses from both these chromosomes are known to play critical changes in initiation and progression of human breast cancer. Allelic loss from human chromosome 11 (11q23–q24) has also been shown to be induced in breast epithelial cells exposed to oestrogen (28). In our mouse model system, pregnancy, was associated with an increase in the frequency of allelic loss of the WT copy of Apc in line I Min mice. Furthermore, the human diet is known to contain several non-steroidal compounds such as flavorous, comestans and lignans that are weakly oestrogenic (29) and it also remains to be seen if susceptibility in line I can be modulated through phyto-oestrogenic dietary factors and whether such factors influence frequency of LOH.
In summary, mutation(s) leading to an alteration of a key protein(s) involved in hormonal synthesis or metabolism may underlie the susceptibility of female line I Min mice to pregnancy-associated adenoma formation in the intestine. The possibility of a direct or indirect effect of pregnancy on the frequency of Apc allele loss clearly warrants investigation. It is likely that any identified variant(s) will influence CRC disease susceptibility and severity in the human population. Given the inherent difficulties in identifying such variants in the human population, our mouse model using recombinant lines provides a unique opportunity to identify the relevant gene(s) as well as examining protein function in vivo.
MATERIALS AND METHODS
Animals, genotyping and adenoma scoring
Mice from the recombinant lines I and V (21) were housed in conventional cages and standard maintenance diet provided ad-libitum. All procedures involving animals were carried out in accordance with the Animals (Scientific Procedures) Act 1986 and with guidance from the local Ethical Review Committee on animal experiments. Genotyping of ApcMin/+ was performed as detailed previously (30). Mice were sacrificed by CO2 asphyxiation after 100 days when the quality of life was compromised, and the whole gastrointestinal tract removed. The tract was separated into small intestine, caecum and colon with the small intestine divided further into four equal segments: (denoted small intestine I–IV) as detailed in Haines et al. (21). The gut segments were cut along the line of the mesenteric attachment, flushed with PBS, spread onto paper strips with villi uppermost and then fixed for 24 h in phosphate buffered formol saline prior to transfer to 70% ethanol for storage. Sizing of tumours was conducted using sizing loops as described previously (31). We reviewed H and E slides and analysed 100 lesions (including 30 lesions <0.75 mm) from 12 different mice and confirmed that each tumour was an adenoma.
Gene expression assays
Gene expression was quantified using TaqMan assays (Applied Biosystems, CA, USA) for ESR1, ESR2, HSD17b4 and Cyp192a according to manufacturer's instructions. Experiments were conducted in triplicate and repeated three times with GAPDH as the experimental control. Fold differences were calculated as previously published (32).
Immunohistochemistry
Mouse gut tissue sections were rehydrated in an ethanol series and endogenous peroxidase activity was quenched with a 30 min incubation in 30% hydrogen peroxide–methanol. Antigen retrieval was performed by the pressure cooker method, boiling the slides for 10 min in citrate buffer pH 6. Slides were blocked in normal goat serum for 30 min. Esr1 (1/150, Santa Cruz Biotechnology Inc, CA, USA) and Esr2 (1/100, Abcam, Cambridge, UK) antibodies were incubated overnight at 4°C in a humidified chamber. Following washes, anti-rabbit IgG secondary antibody (Vectorstain kit, Vector Laboratories, Burlingame, CA, USA) was applied for 30 min. Post washing, avidin and biotin (Vectorstain kit, Vector Labs, CA, USA) were incubated for 30 min followed by peroxidase detection with a mixture of 3,39-diaminobenzidine (DAB; Sigma, Poole, UK). Slides were then washed with water and counterstained for 1 min with Gills haematoxylin, dehydrated and coverslipped with Permount (Fisher, Fairlawn, USA).
Statistical analysis
Data were analysed in Stata 8.2 (Stata statistical software release 8.0; Stata corporation College Station, TX, USA). The mouse study was analysed using multiple regression with the number of adenomas detected as the outcome variable. Regressions adjusted for age at death were performed for each of the four sections of the small intestine (I–IV), and for the colon and caecum. In the results, P-values are from multiple regressions unless stated otherwise. Adenomas presenting in Min mice (parous, n=11; nulliparous, n=12) sacrificed at similar time points (135–165 days) were placed into three size bins, ≤0.75, 0.75–4 and ≥4 mm, and statistically significant differences between the numbers recorded for each bin assessed using Student's t-test and binomial regression adjusted for influence of gut section (I–IV) on adenoma number.
ACKNOWLEDGEMENTS
Kevin Whitehill, Rachael Bartram and Pat Hillier (all of Health Protection Agency and staff of the Cancer Research Clare Hall laboratories) for technical assistance. This work was supported in part by Commission of European Communities Contract Grant FI4P-CT95-0008 and Cancer Research UK.
Conflict of Interest statement. None declared.
REFERENCES
Author notes
These authors contributed equally to this work.
